ULg Spectra: an Interactive Software Tool to Improve
Undergraduate Students’ Structural Analysis Skills
Armelinda Agnello,† Cyril Carré,‡ Roland Billen,‡ Bernard Leyh†, Edwin De Pauw † and Christian Damblon ††Department of Chemistry, University of Liège, Sart-Tilman B6c, 4000 Liège, Belgium. 5
‡Department of Geography, University of Liège, Sart-Tilman B5a, 4000 Liège, Belgium.
ABSTRACT
The analysis of spectroscopic data to solve chemical structures requires practical skills and drills. In this context, we have developed ULg Spectra, a computer-based tool designed to improve the ability of learners to perform complex reasoning. The
10
identification of organic chemical compounds involves gathering and interpreting complementary information from mass, infrared, Raman and nuclear magnetic
resonance spectra. Here, special attention is paid to one-dimensional 1H and 13C NMR spectra and to two-dimensional NMR spectra because these techniques particularly require extensive interactive data manipulation. ULg Spectra offers tutorial-drill 15
materials including spectra that are “authentic” in the sense that they contain solvent and impurity traces rather than being “idealized” spectra often found in textbook examples. A public version is accessible online free of charge. The exam results for two groups of students, one having used ULg Spectra for extra home-based training and the other not, were compared. Statistical data demonstrated higher performance for the 20
ABSTRACT GRAPHIC
KEYWORDS 25
First-Year Undergraduate/General, Upper-Division Undergraduate Analytical Chemistry, Organic Chemistry
Computer-Based Learning, Problem Solving/Decision Making
INTRODUCTION
The determination of chemical structures from spectroscopic data is now included 30
in organic chemistry courses at all universities. In addition to providing students with practical skills in analytical chemistry, this contributes to the development of general competencies associated with the integration of knowledge from various origins. Identification of organic chemical compounds is nowadays mainly taught via
textbooks.1-4 These reference books offer valuable complementary information coming 35
from the combination of mass (MS), infrared (IR) and nuclear magnetic resonance (NMR) spectra. However the rigidity of fixed-image spectra and the need to highlight
appropriate details limit the ability of learners to perform the entire reasoning by themselves: i.e. selecting relevant information from each spectrum, handling this information and suggesting a possible chemical structure with an adequate scientific 40
the Web.5–9 Some Web sites explore interactive one-dimensional (1-D) NMR spectra10-13. MS and NMR spectra14 simulations are available but these are not specifically designed to improve structural analysis skills. A large spectral database for organic compounds is available on the Web15 but it is based on fixed images, does not include any two-45
dimensional (2-D) NMR spectra, and is not designed for educational purposes. Here we report the development of ULg Spectra, an interactive computer program (ULg is an abbreviation for the University of Liège). This program is designed to
facilitate active learning16 in real-life structural analysis problem solving. It is a flexible tool that offers many sets of exercises with different difficulty levels, based on the 50
lecturer’s requirements and tailored to student needs. This tool can be used in
cooperative or collaborative learning17-19. Slavin17 defined cooperative learning as “a set of educational strategies in which students work together in small groups to help each other learn academic content”. Cooper et al.18 showed that even more informal
collaborative groups can lead to measurable improvement in student problem-solving 55
ability. Exercises from the database can be solved by collaborative groups of two students with or without the supervision of a lecturer.
Although extensions are planned to fully cover all spectroscopy methods, the current development stage focused on 1-D and 2-D 1H and 13C NMR spectra. 13C NMR spectra were recorded in the APT (Attached Proton Test) mode allowing the observation 60
of all carbons as positive or negative signals depending on the number of protons attached. 2-D NMR is often a requirement for complex molecules, where increased resolution is needed. We have focused on NMR-HCOSY (COrrelation SpectroscopY) which identifies 1H-1H couplings, NMR-HSQC-HC (Heteronuclear Single Quantum Correlation) which correlates 13C nuclei with the directly attached protons (one-bond 65
1J
CH couplings) and NMR-HMBC-HC (Heteronuclear Multiple Bond Coherence) where both two-bond (2JCH) and three-bond (3JCH) couplings are present.
CONCEPT AND DESIGN FEATURE
Concept
The entire concept is driven by an educational approach, as most of the spectra 70
included in our database have been recorded by students as part of training courses. The ULg Spectra database is designed for students. It contains sets of exercises with different difficulty levels. As the spectra are derived from authentic sources and therefore frequently display solvent and/or impurity signals, they are valuable
resources for students to develop meaningful problem-solving strategies18. Our software 75
functionalities are totally comparable with those of commercial software packages. Students’ training can thus be easily transferred to a professional context. A public version of the database including 50 exercises is accessible online free of charge20. Getting started is fast and easy through available video tutorials21. The full version, containing about 100 exercises, is available to students at the University of Liège. Both 80
versions will expand further in the future. The full version can be considered as an internal working version and will serve to upgrade the public version afterward. Features
All of the exercises are numbered, and they are sorted into three categories, namely, A, B and C, of increasing difficulty. An exercise can be searched by its number,
85
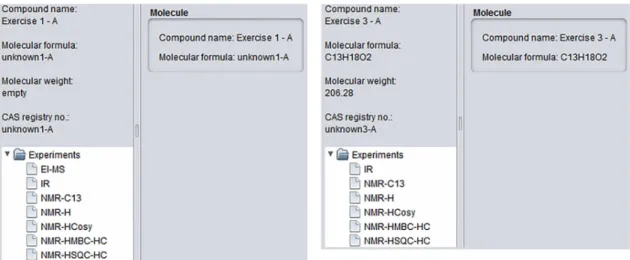
difficulty level, molecular formula or molecular weight. Two examples of exercises are displayed in Figure 1 along with the information and spectral data available in each case. To date, mass, IR and Raman spectra are stored as good-quality images.
Experimental conditions and various documents or spreadsheets can also be archived for each exercise.
90
Full nuclear magnetic resonance (NMR) spectral data are stored and include:
- 1-dimensional 1H and 13C NMR spectra,
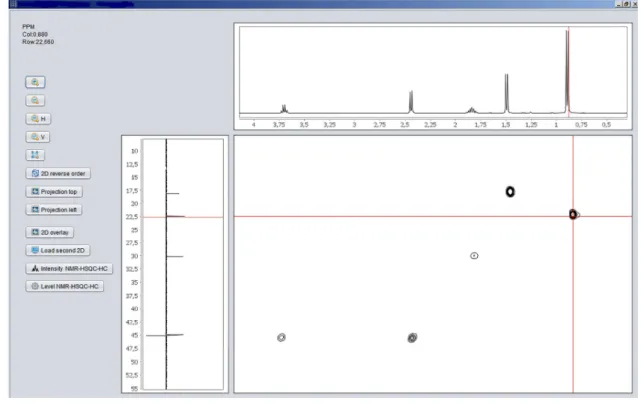
The 1-D spectra can be zoomed, and peak integration can be performed as well (Figure 2). 2-D spectra are displayed with the corresponding 1-D projections (top and left). The 95
zoom function is also available for 2-D spectra and automatically applies to both 1-D projections too (Figure 3). As it is useful to overlay NMR-HSQC-HC and NMR-HMBC-HC spectra, this function has also been implemented. Comments can also be added for each experiment if necessary.
100
Figure 1. Two examples of information and experiments available for an exercise.
Figure 2. Display of a typical NMR-H spectrum illustrating the zoom, peak integration and calibration functions of the software. The cursor position in ppm is indicated in the top left corner.
105
Figure 3. Display of a typical HSQC-HC NMR spectrum with the corresponding 1D-H-NMR (top) and 1D-13C-NMR (left) projections. The cursor position coordinates in ppm are indicated in the top left corner.
Technical considerations
The system relies on a client/server architecture. The data are stored in a 110
PostgreSQL database. The client application is used to visualize and interact with the data. The client/server architecture centralizes all of the data on a server, making data backup and recovery easier. The PostgreSQL database communicates directly with the client in SQL. The NMR data are first processed manually for phase correction and baseline correction and these processed data are then stored in the NMR
115
manufacturer’s text format (Bruker). The client is programmed in Java and can run under Windows, Linux and Mac operating system. It is a fat client application so all of the data processing is performed on the end-user machine. The server is used only for data storage so it needs lower requirements: the computational load is supported by the end user machine. This also allows better real-time computation performance.
EVALUATION OF ULG SPECTRA
This interactive software has been used since January 2014 by undergraduate students taking structural analysis courses. First-year undergraduate students (a cohort of approximately 300 per year) used the software at home to solve extra drill-exercises. Senior undergraduate students (about 30 per year) used it directly during 125
on-campus tutorial classes in informal collaborative groups18. Exercises from the database were solved by collaborative groups of two students supervised by the lecturer.
The impact of the use of ULg Spectra was evaluated by comparing first-year undergraduate exam results achieved by students before it was implemented (i.e. from 130
2010 to 2013) and after it has been used by the students (i.e. from 2014 to 2017). Since 2010, the determination of chemical structures from spectroscopic data has been included in the second-semester organic chemistry course. Besides 4 hours of formal lecture, five 2-hour “traditional” tutorial sessions of problem solving are organized with explained exercises of increasing difficulty. Since 2014, two additional tutorial sessions 135
focusing on how to install and use ULg Spectra have been scheduled. During the first one, a full description of the software is provided, and key features are emphasized by two demo exercises from the database. Students are invited to get used to the software at home for two weeks. They are expected to install the software, get used to its main functionalities and try to solve a given exercise. The second session is a feedback 140
session where students’ questions about the handling of the software are answered and illustrated by two to four additional demo exercises from the database. These tutorial sessions on how to install and use the software could not be considered as spectroscopy training per se. Students can then keep on using the software at home to solve extra drill-exercises. This home-based training is not mandatory and students are free to 145
The students were divided into two groups: the control group (before the
implementation of ULg Spectra) and the treatment group (after the implementation of ULg Spectra). Instruction time was compared between these two groups. The control group had 14 h of spectroscopy training. Even if we include the feedback session, the 150
treatment group had a maximum of 16 h of spectroscopy training; this additional time did not correspond to more time spent interpreting spectra but was mainly associated with technical considerations. ULg Spectra is a free complementary tool provided by the Department of Chemistry of the University of Liège to students. It could be used during their home study instead of or in addition to books.
155
Each year, exams were organized in June with a resit in August and were based on the interpretation of MS, IR and NMR spectra to get the chemical structure. A detailed answer with relevant points was graded. Students were required to determine the molecular weight of the unknown compound, explain the main fragmentation pathways from the MS spectrum, identify important peaks in the IR spectrum, interpret 1H NMR, 160
13C-NMR and HSQC spectra (chemical shift, multiplicity), calculate the index of
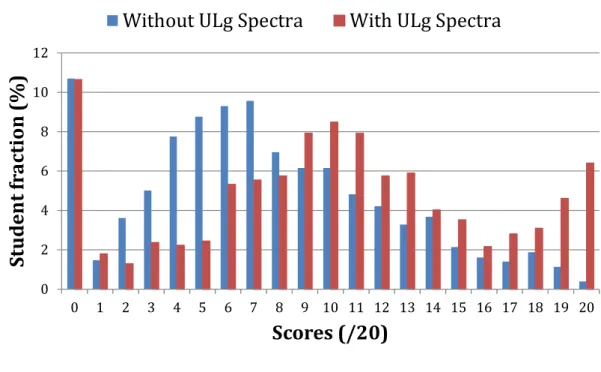
hydrogen deficiency and finally come up with the chemical structure. Results from 2010 to 2013 and from 2014 to 2017 were pooled into 2 groups (Figure 4): the control group (without ULg Spectra – 1495 exams – mean score: 7.4/20 – median: 7.0/20) and the treatment group (with ULg Spectra – 1390 exams – mean score: 10.0/20 – median: 165
10.0/20). The Mann-Whitney U test was performed for both groups and a p value <0.001 was obtained indicating a highly significant difference between the two groups (U = 737987, r = 0.25). The higher scores achieved by students since the
implementation of ULg Spectra compared to those obtained by students before its implementation support the beneficial effect of the use of ULg Spectra on student exam 170
performance. The effect size (r = 0.25 equivalent to Cohen’s d = 0.52) represents a 19 % percentile gain for the treatment group over control group22. This effect size value also
indicates that 33 % of the distributions of scores do not overlap23. Hedges and
Hedberg24 point out that Cohen’s d effect sizes around 0.20 are of policy interest when academic competencies are assessed. Furthermore, it was observed that the fraction of 175
students having good and very good results increased with the use of ULg Spectra. Indeed, the fraction of students having a score greater than or equal to 12/20 doubled and the fraction of students having a score greater than or equal to 18/20 was even four times higher. The appearance of a bimodal behavior in the score distribution may result from an additional motivation increase for the best students, linked to the 180
technology-based approach.
Figure 4. Exam results : correlation of test grades with the implementation of ULg Spectra. The score of 0 was obtained by students who just handed in a blank copy.
STUDENT PERSPECTIVES AND FUTURE DEVELOPMENTS OF ULG SPECTRA 185
In May 2017 an optional survey of ULg Spectra was sent to the last cohort of first-year undergraduate students. Thirty-eight students (out of the 188 students registered for the June 2017 exam) filled it out. Even though this survey included a limited number of students, results and comments were valuable to evaluate the software. The
0 2 4 6 8 10 12 0 1 2 3 4 5 6 7 8 9 10 11 12 13 14 15 16 17 18 19 20
S
tu
d
e
n
t
fr
a
c
ti
o
n
(
%
)
Scores (/20)
analysis of students’ answers showed that 90% of the students found ULg Spectra to be 190
helpful or very helpful to gain practical skills. For the majority of the students (76%), the use of ULg Spectra was rather easy (47%), easy (24%) or very easy (5%). After installation of the software, 92% of the students needed 1 or 2 hours to get used to its main functionalities. The response time for 1-D NMR was found to be acceptable by 86% of the students. For 2-D NMR, the response time was considered to be acceptable 195
by 66% of the students. To further improve the response time, processed NMR data size was optimized before being transferred to ULg Spectra. This clearly reduced the
response the time for both 1-D and 2-D NMR spectra.
In their comments, students relayed that the installation of ULg Spectra was not always easy (usually because of problems with installing Java). Students mainly 200
complained that the full version of ULg Spectra required a Virtual Private Network (VPN) to access the database. Students suggested some technical improvements for user-friendliness and the development of interactivity for mass spectra and IR spectra.
The results of this survey indicated that ULg Spectra is already useful to students, and their comments have been taken into account to set a timeline for further
205
implementations. The following step will be the development of a multiplatform Web application that will be more user-friendly and faster. Interactivity will also be added for mass, IR and Raman spectra. As the entire concept of ULg Spectra is based on
students’ skills, these developments will be part of a graduate thesis conducted to obtain a Master’s degree in Computer Science and Engineering. Development and 210
testing are expected to be finished by the end of 2018.
CONCLUSION
The structural determination of organic compounds is a relevant pedagogical topic to develop competencies in gathering and using complementary information obtained by various analytical methods. Students’ representations constructed during this kind of 215
problem solving have been used by Domin and Bodner to infer conceptual understanding25. Furthermore, a recent study26 has shown that, when trying to
determine a structure, advanced students, in comparison to novices, gaze between NMR pieces of data and chemical structures, or in other words, between spectral information and symbolic representations. This emphasizes the importance of visual effects and 220
confirms how relevant it is to help students to become familiar with interactive spectral data handling.
Current sets of exercises are mainly based on frozen spectral images including the identification of relevant details, a situation that does not foster learners’ autonomy. In contrast, ULg Spectra software offers an interactive tool that mimics real field methods 225
using up-to-date analytical experiments to assign the chemical structure of an unknown compound unambiguously. Thanks to tutorial-drill materials, students can improve their ability to perform autonomous complex reasoning.
Statistical data on first-year undergraduate student exam results provide evidence that the use of ULg Spectra effectively contributes to improving their performance. As 230
an example, the fraction of students passing their examination (grade greater than or equal to 12/20) is twice that of the control group.
AUTHOR INFORMATION
Corresponding Author 235
*E-mail: [email protected].
ACKNOWLEDGMENT
We thank the Department of Chemistry and the Faculty of Sciences for their scientific interest in the project and for their financial support. We are particularly grateful to Jean-François Focant who gave us the opportunity to introduce and test ULg 240
Spectra in the frame of his chemistry course. We also thank Fabienne Humblet for her comments on the manuscript.
REFERENCES
1. Silverstein, R.; Webster, F.; Kiemle, D. Spectrometric identification of organic compounds, 7th
ed.; Wiley: Hoboken, NJ, 2005.
245
2. Field, L.; Sternhell, S.; Kalman, J. Organic Structures from Spectra, 5th ed.; Wiley: Hoboken,
NJ, 2012.
3. Williams, D.; Fleming, I. Spectroscopic Methods in Organic Chemistry, 6th ed.; Mc Graw-Hill:
New York, 2007.
4. Pavia, D.; Lampman, G.; Kriz, G.; Vyvyan, J. Introduction to Spectroscopy, 4th ed.; 250
Brooks/Cole: Belmont, CA, 2009.
5. Bays, J. NMR, IR & MS Spectroscopy Tutorials & Problems.
http://sites.saintmarys.edu/~pbays/Spectroscopy.html (accessed Nov 2017).
6. Smith, B.; Boggess, B.; Zajicek, J. Organic Structure Elucidation.
http://www3.nd.edu/~smithgrp/structure/workbook.html (accessed Nov 2017).
255
7. Merlic, C. A.; Strouse, J. WebSpectra. http://www.chem.ucla.edu/~webspectra/index.html
(accessed Nov 2017).
8. Dessens, S. IR and NMR Introductory Practice Problems.
https://learning.hccs.edu/faculty/steven.dessens/notes_and_practice/chem_2425/practice
-problems/ir-nmr-problems/view (accessed Nov 2017).
260
9. Young, P. R. Organic Chemistry OnLine.
http://www.askthenerd.com/ocol/SPEC/SPCINDEX.HTM (accessed Nov 2017).
10. Hunt, I. Interactive Spectroscopy Problems.
http://www.chem.ucalgary.ca/courses/351/WebContent/spectroscopy/index.html
(accessed Nov 2017).
265
11. ChemSpider. http://www.chemspider.com/ (accessed Nov 2017). 12. SpectraSchool. http://spectraschool.rsc.org/ (accessed Nov 2017). 13. Interactive NMR Problems.
http://www.chem.yale.edu/~chem220/chem220js/STUDYAIDS/nmr/Ynmr.html (accessed
Nov 2017).
270
14. ChemDoodle. Simulate NMR and MS.
http://web.chemdoodle.com/demos/simulate-nmr-and-ms (accessed Nov 2017).
15. Spectral Database for Organic Compounds SDBS. http://sdbs.db.aist.go.jp(accessed Nov 2017).
16. Spencer, J. N. New directions in Teaching Chemistry: A Philosophical and Pedagogical Basis.
275
Journal of Chemical Education, 1999, 76 (4), 566-569.
17. Slavin, R. E. Cooperative learning. In Learning and Cognition in Education; Aukrust, V. G., Ed.; Elsevier: Oxford, 2011; p 160.
18. Cooper, M.M.; Cox, C. T.; Nammouz M.; Case, E.; Stevens, R. An assessment of the Effect of Collaborative Groups on Students’ Problem-Solving Strategies and Abilities. Journal of
280
19. Winschel, G. A.; Everett, R. K.; Coppola, B.P.; Shultz, G.V.; Lonn S. Using Jigsaw-Style Spectroscopy Problem-Solving To elucidate Molecular Structure through Online Cooperative Learning. Journal of Chemical Education, 2015, 92, 1188-1193.
20. Agnello, A. ; Carré, C. ULg Spectra. http://www.facsc.ulg.ac.be/en/ulgspectra(accessed Nov
285
2017).
21. Agnello, A. ULg Spectra tutorials. http://www.facsc.ulg.ac.be/en/ulgspectra (accessed Nov 2017).
22. Durlak, J. A. How to Select, Calculate, and Interpret Effect Sizes. Journal of Pediatric
Psychology, 2009, 34, 917-928.
290
23. Becker, L. A. Effect Size. http://www.uv.es/~friasnav/EffectSizeBecker.pdf (accessed Nov 2017).
24. Hedges, L. V.; Hedberg E. C. Intraclass Correlation Values for Planning Group-Randomized Trials in Education. Educ. Eval. Pol. Anal., 2007, 29(1),60-87; DOI:
10.3102/0162373707299706.
295
25. Domin, D.; Bodner, G. Using Students’ Representations Constructed during Problem Solving To Infer Conceptual Understanding. Journal of Chemical Education, 2012, 89, 837-843. 26. Topczewski, J. J.; Topczewski, A. M.; Tang, H.; Kendhammer, L. K.; Pienta, N. J. NMR
Spectra through the Eyes of a Student: Eye Tracking Applied to NMR Items. Journal of
Chemical Education, 2017, 94, 29-37.
300