E. PLOUGONVEN(a) - D. BERNARD(a) - P. VIOT (b)
(a) Institut de Chimie de la Matière Condensée de Bordeaux ICMCB-CNRS Université Bordeaux I, 87, Av. Dr A.Schweitzer, 33608 PESSAC Cedex (France)
(b) LAMEFIP, ENSAM de Bordeaux, Esplanade des arts et métiers, 33405 Talence Cedex (France)
APPLYING A DEFORMABLE SURFACE MODEL TO IDENTIFY FOAM BEADS IN A SAMPLE OF POLYPROPYLENE FOAM AND FOLLOW THEIR EVOLUTION IN A DYNAMIC CRASH LOADING
EXPERIMENT
1. Introduction
Polymeric foams are widely used in engineering applications for their high impact energy-absorbing properties, which is due to their complex multi-scale structure. To optimise their manufacture and performance, it has become increasingly necessary to gain more insight in the heterogeneous microscopic behaviour of the foam under operation conditions.
X-ray tomography is a powerful tool to visualise the foam structure and its deformation for two reasons: it provides a three-dimensional X-ray attenuation map of the material with micrometric resolution, and it is non-invasive, which implies that the evolution of the material can be followed all through the experiment.
2. Data acquisition
Because crash loading time is much smaller than tomogaphic acquisition time (a few milliseconds vs. almost an hour), several interrupted crashes are applied (a dynamic loading with a constraint on the strain), in between which a micro-tomogram is acquired. If we assume that the foam behaviour is not modified by the interruptedness of the dynamic loading, then we obtain a series of tomograms showing the evolution of the foam sample during dynamic compression. This procedure has been applied to a cylindrical sample of polypropylene foam (1cm diameter and initially 1cm high, the compression being parallel to the cylinder axis) with four compression stages going through the elastic and plastic regimes and to the densification. The experiment was conducted with a portative drop tower at the ESRF on beamline BM05 with a pixel resolution of 4.91µm per pixel and beam energy of 16 keV, producing 20483 pixel tomographic reconstruction1.
3. Foam bead indentification
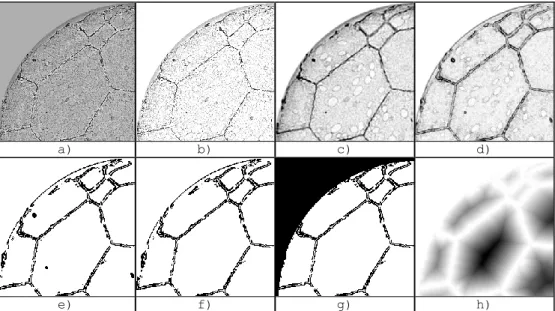
Polypropylene foam is a multi-cellular material made of beads (around 2mm in diameter), initially spherical but that become polyhedral upon agglomeration. Each bead consists of micrometric cells that are visible but not quantifiable in the microtomograms, which makes the scale of interest in this work that of the beads. Unfortunately, the image processing required to segment and partition this material is much more arduous than when separating foam bubbles in a metallic foam or PVC foam, for instance. We present a method to extract a majority of the interior volume of each bead for each tomogram. This first step provides values of average density variation for each bead during a crash loading. The central point of the method is the use of deformable surfaces2, i.e. surfaces whose deformation is guided by features in an image. In our case the surface expands from inside the bead to converge near the bead walls, which have been highlighted beforehand by a sequence of simple image processing operations summarized in figure 1: from the initial reconstruction a), darker pixels along the bead and cell walls (due to phase contrast, an artifact of the acquisition method) are removed a), then a Canny-Deriche type filter is applied, i.e. a gaussian smoothing c) accompanied by a gradient operator, in this case the norm of the Sobel operator d). The image at step d) is the one used for guiding the deformable surfaces, the remaining steps are performed to isolate each bead in order to determine the number and initial positions of the surfaces. From step d), a hysteresis threholding segments most of the bead walls without extracting too much of the bigger cell walls e), although the most visible ones are still extracted. Those that are disconnected from the bead walls are removed by a connected component labelling f). A cylindrical mask is applied g), finally allowing a Euclidean distance map to highlight the most interior regions of the beads h). By thresholding step h), small disconnected interior regions are determined for each bead, and their centre of gravity can be used to approximately locate grain centres (used for registering the beads in each of the microtomograms), and provide an initial position for the deformable surfaces.
The evolution of the surface, which is defined as a faceted 3-simple mesh (a mesh in which each vertex is contained in exactly 3 facets), is calculated at each time step, and is made by subjecting each vertex of the mesh to a second order Newtonian law of motion
F
a
m
, where several forces are defined (expansion, friction, convergence, and smoothing forces). Eventually, each surface converges near the bead walls, that have been highlighted in step d). This allows us to visualise the deformation, as seen in figure 2, and measure the average density of each bead during the compression.4. Perspectives
Unfortunately, due to the difficulty in precisely identifying bead walls (even manually), complete bead volumes and wall thickness is not yet determined: the deformable surfaces contain only the majority of the inside of the beads, and there still remains an intersticial volume which has no physical significance (it represents a volume in which the bead wall is located, volume that is a function of the image processing). Future work to obtain more accurate data would focus on methods such as skeletonisation of the intersticial volume3.
a) b) c) d)
e) f) g) h)
Figure 1 - Illustration of the method used to extract approximate position of the grain centres. It consists of a series of simple arithmetic and morphological operators on the microtomograms4.
Figure 2 - Illustration of the grains at the different stages of impact. The grey levels represent the density of the grains, calculated by averaging the intensities of the pixels of the microtomograms contained inside the surfaces4.
5. Bibliography
1. Philippe Viot, Dominique Bernard and Erwan Plougonven, Développement d'une méthodologie pour l'étude des
déformations de mousse polymère sous compression dynamique, Revue des composites et des matériaux avancés, 17(1),
9-23, 2007
2. Hervé Delingette, Modélisation, déformation et reconnaissance d'objets tridimensionnels à l'aide de maillages
simplexes, PhD thesis, Ecole centrale de Paris, 1994
3. Nicolas Combaret, Dominique Bernard and Hugues Talbot, Comparison of different skeletonization strategies for porous
media transfer properties evaluation, Journées Annuelles de la SF2M, 2007
4. Erwan Plougonven, Dominique Bernard and Philippe Viot, Quantitative analysis of the deformation of polypropylene
foam under dynamic loading, Proceedings of SPIE, Developments in X-Ray Tomography V 6318, 2006