HAL Id: hal-01865770
https://hal.archives-ouvertes.fr/hal-01865770
Submitted on 1 Sep 2018
HAL is a multi-disciplinary open access
archive for the deposit and dissemination of
sci-entific research documents, whether they are
pub-lished or not. The documents may come from
teaching and research institutions in France or
abroad, or from public or private research centers.
L’archive ouverte pluridisciplinaire HAL, est
destinée au dépôt et à la diffusion de documents
scientifiques de niveau recherche, publiés ou non,
émanant des établissements d’enseignement et de
recherche français ou étrangers, des laboratoires
publics ou privés.
Influence model based on actions and reactions in social
networks
Monika Rakoczy, Amel Bouzeghoub, Alda Lopes, Katarzyna Wegrzyn-Wolska
To cite this version:
Monika Rakoczy, Amel Bouzeghoub, Alda Lopes, Katarzyna Wegrzyn-Wolska. Influence model based
on actions and reactions in social networks. [Research Report] Telecom SudParis. 2018. �hal-01865770�
Influence Model Based on Actions
and Reactions in Social Networks
Technical Report
-Monika Ewa Rakoczy
Amel Bouzeghoub
Alda Gancarski Lopes
Katarzyna Wegrzyn-Wolska
Technical Report No. SAMOVAR-TR-201808-01
Telecom SudParis, Evry, France
2018
Technical Report: Influence Model Based on
Actions and Reactions in Social Networks
Monika Ewa Rakoczy
⇤, Amel Bouzeghoub
⇤, Alda Lopes Gancarski
⇤, Katarzyna Wegrzyn-Wolska
† ⇤SAMOVAR, CNRS, Telecom SudParis, Evry, France,Email: {monika.rakoczy, amel.bouzeghoub, alda.gancarski}@telecom-sudparis.eu
†AlliansTIC, Efrei Paris, Villejuif, France
Email: [email protected] Abstract—Today’s social networks allow users to react to
new contents such as images, posts and messages in numerous ways. For example, a user, impressed by another user’s post, might react to it by liking it and then sharing it forward to her friends. Therefore, a successful estimation of the influence between users requires models to be expressive enough to fully describe various reactions. In this article, we aim to utilize those direct reactive activities, in order to calculate users impact on others. Hence, we propose a flexible method that considers type, quality, quantity and time of reactions and, as a result, the method assesses the influence dependencies within the social network. The experiments conducted using two different real-world datasets of Facebook and Pinterest show the adequacy and flexibility of the proposed model, that is adaptive to data having different features.
Index Terms—influence, social scoring, social network analysis
I. INTRODUCTION
Nowadays, due to the increasing number of people using social network sites, the number of careers created using networking sites such as Youtube has risen as well. The majority of such businesses made via social networking are involved with creators generating content for their audiences, i.e. youtubers, bloggers, instagrammers, earning fame and influence, as well as revenue from advertisement. However, one of the concerns of both creators and advertising companies that collaborate with Internet creators is how to measure, prove and sustain their influence on audiences. To illustrate the problem, let us consider the network that consists of different users - proactive and reactive ones, having different interests, and having various numbers of connections to others. Now, we want to target the social campaign to people, using limited resources. The question is how to select creators to share the event, which not only have (possibly large) audiences, but also the audience that would be involved in the campaign?
The topic of Influence Maximization [4] is not new in the literature, however, the proposed methods focus more on the spread of the information in the network already assumed to be indicating influence. Hence, such works suppose to have users influencing others, basing on ”friend” relations on Facebook, sharing posts or even calling each other. While these approaches focus on expanding the reach of information within the network (i.e. the possibility of user seeing some content), none of them actually guarantees that we have actual influence
between users (that is engaging with the message). However, while only the pairwise relation between two users seems to be insufficient to immediately implicate the impact, analyzing and evaluating the engagement and reactions concerning a particular user seem to be good basis for evaluating the influence.
In this paper, we present a simple, general model, which we called ARIM (Action-Reaction Influence Model), for evaluating influence between users using one (any) on-line social network platform. In the model, we base on the users’ proactive and reactive behaviors, that can be found on basically any social networking site. We concentrate on data flexibility aspect of the model, so that the model can be used with different datasets. Our focus is to create a model which uses data features that are possible to obtain for research, and in which each of the properties is connected to its overall expressiveness. Our contributions are as follows:
• We analyze characteristics of different social network
sites, establish the key influence-related terms and present the simple social network sites interactions schema (Sec-tion II),
• We propose a simple, general influence model ARIM,
that focuses on three influence aspects important for model expressiveness namely intensity of users’ reactions, spread and audience engagement differentiation and time dependency (Sections II and III),
• We additionally propose a submodel based on ARIM,
that is focused on trends in time intervals, called Inic – Interval Specific SubModel (Section IV),
• We built a framework based on the proposed models
and test it using two real-world datasets, that allow us to validate the two models (Section V).
II. DESCRIPTION OFACTION-REACTIONINFLUENCE
MODEL
In this section, we firstly define the basic notions and the core of our idea. Then, we describe three components of ARIM model and explain their importance for the model expressiveness.
A. Definitions
The aim of this work is to create a general model for evaluating influence, that is independent of the data platform
on which it is applied on. On top of that, we focus on the simplicity of the model on both abstraction and data levels, for two reasons: to be compatible with the intuitive understanding of influence, and to be able to operate on the minimum features expressive enough to evaluate influence.
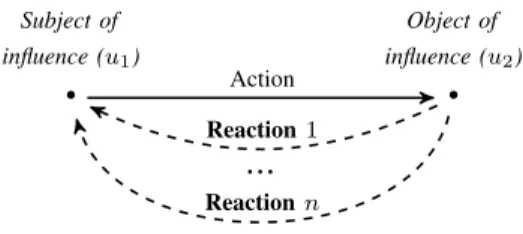
We define the influence from the perspective of Actions and Reactions on social network sites, which goes with intuitive understanding of influence, and the way we tend to evaluate influence in real world. The core of the Action-Reaction Influence Model (ARIM) consists in the simple schema of information exchange on social network sites, depicted in Fig. 1. We base on the situation in which one user is performing an Action by generating the content, i.e positing photo or post. The second user, being (a part of) audience, is performing Reaction1) to the content. We follow the categorization of
the relation from social networks that distinguishes upvotes, comments, etc. (see Section II-B). We aim to measure the influence between Action generating user – the Subject of Influence – and the reacting user – the Object of Influence. In the following, we formally define the notions of influencer, reaction and the influence starting with a social network:
Definition 1: Action: An entity e 2 E such as a person (user), a group of people (e.g. company) or an object (content, conference, etc.) performs an action a 2 A such as posting, photo-sharing etc.
Definition 2: Reaction: An entity e1 2 E can react to an
action a 2 A performed by other entity e22 E
Definition 3: Social Network: A social network SN is a triple SN < E, A, R > where E is a set of entities, A is a set of actions performed by entities from E, and R is a set of reactions of entities from E
Definition 4: Influencer: We say that e1 2 E is an
Influencer iff:
1) e1 performs actions A0✓ A observable in SN
2) Actions from A0 are recognized by other entities e i 2
using reactions from R
3) Actions from A0 have an impact on the behavior or
structure of SN.
Definition 5: Influence: Let e1, e2 2 E from SN <
E, A, R >. We say that e1 influences e2 iff actions A0 ⇢ A
performed by e1 affects the behavior of e2 resulting in the
influenced entity e2 engagement demonstrated in reciprocal
actions–reactions R0 ⇢ R. e
1 is then called the subject of
influence and e2 the object of influence.
Proposition: The relation of influence is asymmetric, time-dependent and oriented. It involves actions generating content (proactive) and reactions (reacting on content).
Remark: Importantly, we do not assume that the Subject and Object of Influence have a relation between each other, i.e. follow, friendship, etc. Obviously, the actions of the Subject of Influence must be visible by the Object of Influence in order to the Object to be able to react. However, this assumption
1In the Action-Reaction schema, we refer to an Action as a self-activity
of user u, while Reactions symbolize activities overtaken by other users in response to the user u Action.
• Subject of influence (u1) • Object of influence (u2) Action Reaction 1 . . . Reaction n
Fig. 1. The Action-Reaction schema. Subject generates content visible to the Object who reacts to the content, possibly by using multiple types of reactions several times.
implies only the visibility of the actions performed by the Subject, and represents more flexible approach in terms of the data requirements and applicability to various social network platforms without a notion of direct relation between users.
The presented general influence definitions and schema aim to cover three degrees of expressiveness, namely: intensity of influence depending on the reactions, influence spread and audience engagement and influence time dependency, which we discuss in the next section.
B. Intensity of influence depending on reactions
The fact that our model is based on the Action-Reaction schema (Fig. 1) implies the flexibility in terms of the number of features the data can include. Obviously, by minimum, the data is required to have the users and reactions of one kind (e.g. comments). Considering the existing to-date potential sources of data, we enlisted most of major social network sites in order to gather all the similar features categorized to Action and Reaction. The results are presented in Table I. From this comparison, it can be seen that most omnipresent reactions available to the users to perform upon the generated content are upvotes (also named likes, claps, hearts, etc. – in this work, all one-click reactions that imply appreciation of the content will be called by the general name upvote), and comments, and then shares (the action of sharing the content originally posted by other user). In this article, without loss of generality, we concentrate on these three reactions due to their ubiquity.
In particular, we want to focus on the implications that different types of reactions have on the influence strength. Indeed, upvotes, comments and shares have various functions and meanings within social networks. According to [10], the upvote is treated as a lightweight reaction, easy to perform to acknowledge the posted content, similar to ”wordless nod”. In comparison, comments are regarded as ”more satisfying to receivers” [10]. Moreover, because of the quickness and easiness of upvoting, it may also be regarded as less mean-ingful than other reactions. Clearly, reacting using comment involves both effort (writing comment content in comparison to ”default” value of upvote) and time (writing and answering versus just one-click). Furthermore, a study [1] has shown that the majority of people share content due to its value – 94% of subjects share ”valuable or entertaining content with others”, 84% share to support causes and issues they care
TABLE I
SOCIALNETWORKASPECTS DEPENDING ON THE TYPE AND/OR SITE
Social Network Type Action Reaction
Social Network Sites
Facebook posts, photos comments, likes (⇡
up-votes), shares, mentions
LinkedIn posts, updates comments, likes (⇡
up-votes), shares
G+ posts, photos comments, +1 (⇡ upvotes),
shares Content-sharing
Microblogging
Twitter tweets (⇡ posts) replies (⇡ comments), likes
(⇡ upvotes), retweets (⇡ shares), mentions
Weibo posts replies (⇡ comments), likes
(⇡ upvotes), retweets (⇡ shares), mentions
Blogging
Medium posts comments, claps (⇡
upvotes), shares to outside platform, e.g. twitter/fb, bookmark
Politico posts comments, shares to outside
platform, e.g. twitter/fb/g+ Creative content
Youtube videos comments, likes (⇡
upvotes), dislikes, shares, views
Instagram photos, stories comments, hearts (⇡
up-votes) Collaborative sites
Yelp reviews upvote review, upvote
pro-file
about. This means that when we see content that is highly impacting we are more willing to share it. This phenomenon is much different to the ”casual” upvoting. It was also observed that receiving more complex reactions from acquaintances is corresponding to increase of relationship strength and close-ness, as opposed to getting upvotes where no such association was noticed [2].
Taking all the above into consideration, we assumed the hierarchy of the reactions, in which the reaction of sharing is regarded as better descriptor of influence than comments and comments implying higher influence than upvotes. To illustrate, let us consider the following example: user u1
created the post. User u2 liked the post, while user u3
commented on the post. The hierarchy aims to evaluate influence according to the importance of the reactions, in this case evaluating the influence of user u3 higher than user
u2. Moreover, for each generated influencer content, we can
specify several combinations of reactions of the influencee – user can only upvote, comment or share the content, can upvote and comment, upvote and share, comment and share, and obviously, all three at the same time, meaning user is upvoting, commenting and sharing the same content.
We do notice that one might argue that the importance of combinations could be modeled by using the linear combina-tion of weights and vector of reaccombina-tions. However, we aim to put different importance to each of the reactions (and their
possible combinations) by not only using weights vector but also by utilizing non-linear multiplications corresponding to reaction combination, so that the importance of existence of two or three reactions at the same time can be stressed, and have greater value on final score. In order to achieve this, we need to model reactions with the use of a non-linear function. C. Spread and engagement
The reaction schema presented in Fig. 1 is a simple, but important generalization of interactions on social networks sites. However, further consideration involves the case of multiple reactions to the same user’s content.
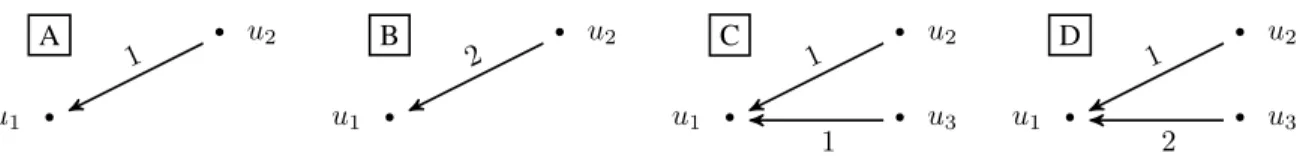
Let us imagine a user u1performs an action – creates a post.
The users u2, u3can react differently, as pictured in Figure 2.
In two cases (Fig. 2 A and Fig. 2 B), only user u2 reacted
to the post. Intuitively, the comparison of these two situations leads to the conclusion that the influence of user u1should be
higher in the Fig. 2 B, as the user u2 has stronger response
in this case. In other two cases (Fig. 2 C and Fig. 2 D), both users u2, u3 reacted. We can say that the overall influence
of user u1 in Fig. 2 D should be higher, because of more
reactions obtained. While it is fairly easy to compare these pairs of situations, the a and b or c and d, the issue starts to be complicated when we want to order influence from highest to lowest in all the presented situations. Intuitively, without any particular model we can state that influence in case a will be the lowest, while influence in case d the highest. However, it is not that obvious in case of b and c. Is the fact that user ugets reaction from two separate users important enough to evaluate influence of u in situation b higher? Or is the strength of particular reaction more important than the spread of the audience?
In order to tackle this problem, we propose to differentiate two components of influence, namely influence spread and audience engagement. Intuitively, in the example above, the user u1 in situation c would have higher spread, while in
situation b would obtain higher audience engagement value. Definition 6: Spread: property of influence which de-termines how many users were actually affected with the generated content.
The idea behind the spread is to calculate the active audience (meaning the one that is reacting to the initial activity), in order to determine the actual overall broadcast range. We define spread as a number of users that made reaction at least once, i.e. general audience cardinality.
Definition 7: Audience engagement: property of influence determining the strength of the reactions obtained from the reached audience.
The audience engagement notion aims to conceptualize how powerful is the user’s influence, therefore evaluates the overall involvement of already active users reacting to the content. D. Time dependency
The third crucial factor we consider as an influence compo-nent is time. As it was mentioned in the influence definition, we acknowledge that influence is occurring in time, hence
• u1 • u2 • u1 • u2 • u1 • u2 • u3 u1 • • u2 • u3 A B C D 1 2 1 1 1 2
Fig. 2. Examples of different scenarios of users (u2, u3) reacting of the content generated by user u1. The arrow symbolizes the reaction (e.g. comment)
and the number signifies the number of reactions
it is necessary to examine and include different aspects of time in the influence estimation process. Here, we present the approach to include time dependency within ARIM.
Gaining the influence is a long-term and continuous process. Therefore, in many cases, considering the whole available dataset gives the best estimation of users influence to-date. However, while considering the whole data time period for calculation, including time aspects connected to actions oc-curring within this time is still valid.
To illustrate, let us consider two situations, in which users u1 and u2 are posting content for time period (t1, t10), and
content is visible to the same number of users (audience). In the first situation, user u1is posting in each of the time points
t1, ..., t10. In the second, user u2has posted only two times, in
t1and t10. Additionally, both users u1, u2received during this
time the same amount and type of reactions. While evaluating influence, the question is whether user u1 posting much more
(”constantly”) should have equal value of the influence (as we count only the reactions that both users received), or should user u2 indeed have higher influence? We propose to tackle
this issue by introducing the component that favors lower frequency of performing actions. This is in accordance with the fact that we tend to appreciate more users with less posts but with higher quality and possible maximum gain for reactions. The presented idea aims to incorporate time-dependency aspect into ARIM without the need to divide the data accord-ing to the time. However, we do acknowledge that temporal changes are also of importance. Therefore, in Section IV, we additionally show the second proposed model, basing on ARIM, that is especially dedicated only to examine the short-term influence trends.
III. SPECIFICATION OFARIMMODEL
In this section, we present the formulas used for the model that are combined for the final calculation of the influence. All the notions used in this section were previously described in Section II.
First, in order to deal with distinction of different types of reactions (see Section II-B), we propose a Reaction Strength Per Reacting User function that combines all reactions done by particular reacting user ru on particular action a for user uusing the following formula:
Strength(u, a, ru) = w1⇤ upvotes + w2⇤ comments+
w3⇤ shares + w4⇤ upvotes ⇤ comments+
w5⇤ upvotes ⇤ shares + w6⇤ comments ⇤ shares+
w7⇤ upvotes ⇤ comments ⇤ shares
(1)
where upvotes, comments, shares are the number of each of the reactions for each actor respectively and w1, ..., w6are the
weights that introduce additional hierarchy of the reactions. The weights should be tuned to the emphasize each reaction combination (lower weight – less emphasis). The number of possible reactions can obviously be higher or lower depending on the types of reactions the dataset includes. The function includes the multiplication of each pair of the reactions, so that in the case in which there is a combination of reactions the overall value of the measure increases. Inclusion of these combinations – cases when two or three reactions where done by one reacting user concurrently – reflects the fact, that Reaction Strength is considered per Reacting user.
Then, we measure the Post Reaction Intensity (PRI) metric, which specifies how much, on average, appraisal (in the form of reactions) a post received, formally defined as:
P RI(u, a) =
P|RU(a)|
ru=1 Strength(u, a, ru)
|RU(a)| (2) where Strength(u, a, ru) is the defined above (Reaction Strength Per Reacting User)e, and RU(a) is the set of Re-acting Users on the action a.
Next, the two influence components, Engagement and Spread, are defined (in accordance to their definition presented in Section II-C) as follows:
Engagement(u) = P|A|
i=1P RI(u, i)
|A| (3)
where A is the set of actions performed by user u.
Spread(u) =|RU|6= (4)
where RU is the set of Reacting Users from the whole considered data, and index 6= implicates the distinct set.
The component that favors lower frequency of performing actions (Section II-D), called fc (frequency component), is defined as:
f c(u) = e|A|1 (5)
where A is the set of actions performed by user u. Finally, the influence for user u can be described using the formula:
Inf luence(u) = Engagement(u)⇥ Spread(u) ⇥ fc(u) (6) The formula calculating the final value of influence is using the whole available data, in order to achieve the best estimate. Formula 6 binds all the measures presented before using the
multiplication. Thanks to this, the contribution of spread and engagement to the final influence score depends on their value. Therefore, the user with high engagement and low spread will have the same influence as the user with low engagement and high spread, assuming that they have equal amount of posts. This is important, as being the better spreader does not straightforwardly implies being more influential (as shown in e.g. [5]). Additionally, the fc component penalizes the users with bigger number of posts, which means that for two users with equal spread and engagement, we prefer user that posts less.
IV. INIC: INTERVALSPECIFICMODEL
As mentioned before, time is an important aspect of in-fluence. ARIM presented in the previous section is focused on the frequency problem for the whole dataset. However, we also want to examine the short-term, temporal changes in reactions, that would give us the possibility of observing the trends of users’ reactions in terms of potential influence. In order to be able to observe these trends, we propose a second sub-model, Interval Specific Model (Inic), that bases on ARIM model, however it is dedicated only to dealing with the influence trends within time windows. Inic uses constant time windows, i.e. it will consider each time period resulting from time window separately. As we utilize the same concepts as presented in previous sections, here we will only precisely present the way Inic is dealing with time.
First, it is important to notice that in many cases the length of the time window should be tuned to the specific portal characteristic, from which the data come. This is due to the fact that there are sites with a very rapid information exchange patterns, e.g. Twitter, where posts and reactions can be done in minutes and even couple of seconds, and there are those that have instant but more steady exchanges, e.g. Instagram. Moreover, the time window will also be highly dependent on the data granularity – data collected daily and aggregated into one snapshot will be by default unable to capture more rapid changes in the network.
It is crucial to notice that there are two time-lines of the data to consider: the action line and the reactions time-line. For instance, presented before ARIM model is basing on the Action-Reaction schema, hence it uses the information about the time of occurring reactions to estimate influence. Any influence model focused on time that utilizes quantities such as post engagement, spread or target audience has to determine a time period in which reactions targeted towards the post. For example, if a user posts some news (performs action) on social network portal, the impact of this post on the user’s audience is not immediate. Instead, the influence on the user’s audience is stretched in time, over the period from the post creation until the last audience reaction, e.g. last comment. Therefore, the question would be: is the post influential at the creation moment or when the reaction occurs? We propose to assign the influence value to time window, considering the reactions time-line (and not the time-line of
TABLE II
STATISTICS ABOUT USEDFACEBOOK[11]ANDPINTEREST[13]DATASETS Parameter Number
Number of users 1 067 026
Number of users that reacted 23 426 682 Number of posts 25 937 525 Number of comments 104 364 591
Time span of data 15/10/14 - 11/02/15
Pinter
est
Number of users 1 307 527 Number of users that reacted 8 314 067 Number of posts 2 362 006 Number of shares 37 087 685 Number of upvotes 19 332 254
Time span of data 03/01/13 - 21/01/13
action occurrence). In particular, we propose two alternative ways of assigning influence value to time window:
• Using only reaction time-line – We assess the influence
value for each window in which the reactions to particular action occurred. In that way, although we do ignore the moment when the post was created, we correctly find the particular time window for which the influence (coming from reactions) have surfaced. For instance, let us assume that the action (e.g. post creation) was performed in time window 1, and reactions (e.g. comments and share) occurred in respectively time window 2 and 3. In this case, Inic would associate time windows 2 and 3 with respective influence values (and none in time window 1).
• Using point in time resulting from median of Action and
Reaction times – The idea is to chose the time window according to both action time, and the time of receiving the reactions. In particular, we determine the time window according to the median of time series consisting of delay between publishing the post and publishing the reaction. The calculated influence value for this action and reactions is placed in the time window which includes this ”median” time. In that way, we bind influence value to the time window in which already half of all reactions towards the action have occurred.
The choice of one of these methods will depend on the time window length and the social network site characteristics2.
V. EVALUATION
This section describes experiments conducted in order to validate and check the proposed models, namely general ARIM and interval specific Inic showed in previous sections. A. Datasets
In order to evaluate our proposed approach, we performed the experiments using two real datasets. The first consists of data from Facebook [11] containing information about posts and their comments (without the text content) with precise information about the time of each of action/reaction.
2For example, the median method will be insufficient in the case in which
the average reaction time for the action will be short (minutes, some hours), and the time window will be longer (as we want to consider a big enough sample for the trends, e.g. couple of days), in which case the median will be included in the time window.
TABLE III
TOP10 INFLUENTIAL USERS FROMFACEBOOK[11]
# Engagement Spread #Actions Influence Score 1 1.039 66181 96 69478 2 1.216 19793 549 24116 3 1.208 18093 148 22012 4 1.204 17030 103 20701 5 1.071 17817 200 19183 6 1.097 17040 941 18717 7 1.092 16087 263 17637 8 1.413 11086 67 15899 9 1.053 14185 998 14953 10 1.066 12678 34 13924
Second dataset includes data from Pinterest [13], that contains repins (shares) and likes (upvotes). Table II presents the basic statistics about the both used datasets.
We conducted three sets of experiments: two resulting in general influence score using ARIM model, utilizing datasets of Facebook and Pinterest, and one involving trend examina-tion within time using Inic model, utilizing Facebook dataset, due to the fact that only this dataset includes precise time stamps for each action and reaction. The implementation was done using PostgreSQL ver 9.6 and R language ver 3.3.1. B. Results of ARIM
1) Facebook: The experiments performed on Facebook dataset, due to the nature of the data that contained one relation - comments, were done using all weights equal to 1. Table III shows the Top 10 ranking of the most influential users. It can be observed that the user in the first place, while having low (relatively to other top 10 users) engagement rate, is having exceptionally high spread. At the same time, this person has created 96 posts, which is also relatively low. Despite the fact that the audience is not very reactive, i.e. commenting only once, and not entering into discussions, the user is considered very influential due to the user’s huge spread for very few actions. Complementary to Table III, the Figure 3 presents a comparison of Top 3 users in terms of influence score, engagement and spread rate, and number of posts. The high spread rate of top 1 user relative to two other top users can be easily noticed.
Another interesting case can be observed on the 8thposition
in the ranking, with the person having the lowest spread rate in the ranking, significantly lower than both users on 9th and
10thposition. Interestingly though, this person engagement rate
is very high (highest value in the ranking), with additionally small number of posts. Therefore, this user higher place can be explained with the fact that ARIM is not only focused on both engagement and spread equally, but also it favors the low post number (see Section III). Hence, the user on the 8thposition in
the ranking surpasses the next user (9th position) that although
having high spread, he/she has also lower engagement and very high (998) number of posts (the biggest number of posts in the whole ranking).
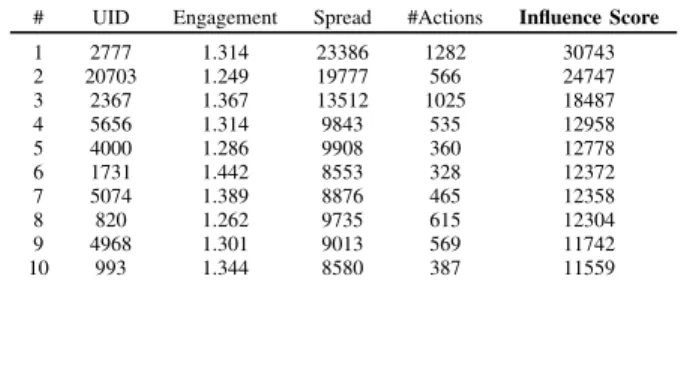
2) Pinterest: The second set of experiments was conducted on Pinterest database, containing two types of reactions, namely shares (called on the site ”repins”) and upvotes
Fig. 3. Detailed comparison of top three users from influence score using Facebook dataset
TABLE IV
TOP10 INFLUENTIAL USERS FROMPINTEREST DATASET OBTAINED USING
ARIMWITH EQUAL WEIGHTS(ALL REACTIONS CONSIDERED EQUAL) # UID Engagement Spread #Actions Influence Score 1 2777 1.314 23386 1282 30743 2 20703 1.249 19777 566 24747 3 2367 1.367 13512 1025 18487 4 5656 1.314 9843 535 12958 5 4000 1.286 9908 360 12778 6 1731 1.442 8553 328 12372 7 5074 1.389 8876 465 12358 8 820 1.262 9735 615 12304 9 4968 1.301 9013 569 11742 10 993 1.344 8580 387 11559 TABLE V
TOP10 INFLUENTIAL USERS FROMPINTEREST DATASET OBTAINED USING
ARIMWITH WEIGHT EMPHASIS ON SHARE REACTIONS # UID Engagement Spread #Actions Influence Score 1 2777 2.263 23386 1282 52961 2 20703 1.935 19777 566 38329 3 2367 2.283 13512 1025 30877 4 820 2.224 9735 615 21690 5 4000 2.133 9908 360 21196 6 5656 2.133 9843 535 21032 7 4968 2.262 9013 569 20422 8 1731 2.360 8553 328 20245 9 5074 2.256 8876 465 20067 10 993 2.258 8580 387 19427 TABLE VI
ADDITIONAL INFORMATION ABOUT USERS GAINED REACTIONS FROM TWO RANKS USINGPINTEREST DATASET
UID Shares Sum Upvotes Sum #Shares and UpvotesConcurrently 20703 15944 11467 1066 820 12617 4184 219 993 9251 4159 583 5074 8897 4816 694 2777 28920 10863 1358 1731 9242 4665 829 2367 19404 9028 1203 5656 10695 5786 885 4000 10729 5245 618 4968 10709 3621 466
Fig. 4. Detailed comparison of top three users: 2777 (u1 – red), 20703 (u2 – green), 2367 (u3 – blue) from both influence scores using Pinterest dataset
(”likes”). In order to show the results difference when con-sidering shares to be of more significant value than upvotes, we used ARIM model with: (1) equal weights for all reactions, w1= w2= w3= 1 (see Equation 1 in Section V-B), and (2)
higher weight for shares, w1= w3= 1, w2= 2. Tables IV and
V present the obtained results from both runs. Additionally, the complementary Table VI presents the detailed information about the users, containing the aggregated sums of upvotes and shares (2ndand 3rdcolumn) and the number of times that both
of the reactions occurred simultaneously (for the same post and from the same user). The information about the latter number (4th column) is important, as the Equation 1 (Section III) in
ARIM model includes an addition component in the formula regarding cases of simultaneous occurrence of the reactions (as was described in Section II-B).
Going back to the Top 10 rankings (Tables IV and V), it can be seen that for both experiment executions, the first three positions are unchanged. This can be explained by a very high spread value of each of the users, which is the predominant component for their high influence. Figure 4 shows in detail the ratios of spread, engagement and post number for each of the top 3 users. Moreover, from Table VI we can see that all of the top 3 users have a very high ”combination” number, which means that they were apprised by other users simultaneously using upvotes and shares.
The use of the emphasis on the shares can be clearly seen by the example of user 820. In the first rank with equal weights, this person position is low (8th). However, the stress by using
the higher weight for share reactions results in increase of the position of user 820 to 4th, jumping ahead of users like 5656
who, while having higher spread value, has less shares in total. Similarly, user 4968, who also has a high number of shares, is promoted from 9thto 7th position. Interestingly, in the case of
second rank (Table V), the emphasis on the shares also resulted in the top user 2777 having much higher influence score in comparison to all other users. Indeed, the gap between users 2777(1st) and 20703 (2nd) significantly rose (two fold), while the gap between users on second and third position (20703 and 2367) stayed similar. This is due to the fact that user 2777 has significantly higher share sum (28920 versus 15944 and 19404 for users 20703 and 2367 respectively), along with the high spread rate.
# user Engagement Spread #Posts Influence Score 6 u6 1.10 17040 941 18717
89 u89 1.19 3131 13318 3728
TABLE VII
INFORMATION ABOUT TWO SELECTED USERS FOR TREND ANALYSIS
C. Results of Inic
Experiments involving the trend analysis using Inic were done using Facebook dataset, due to the fact that only this data included time information for actions and reactions. Importantly, in Section IV, we presented two methods for assigning influence, using reaction time-line and using time resulted from median of time series of action and reaction. However, after initial analysis of the data, we noticed that for the majority of users, the time to obtain comment after posting is less than 200 minutes. Such a short time is not sufficient for observing the trends and obtaining conclusions about one’s influence. Therefore, in the experiments, we used only the first method, while using arbitrary chosen time window of 7 days. Due to the space limitation, we present the trend analysis for only two, interesting users, selected from the list of top 100 influentials, obtained from previous experiments with the dataset (see Section V-B1). The information about the two selected users can be seen in Table VII. The results in the form of trends are presented in Figure 5 for user u6 and Figure 6
for user u89, and include the trend of post count, engagement
and spread ratio trends and influence trend. The dotted line in an approximation of the trend done using Linear Regression. It can be seen that, in case of user u6, while the amount of
created posts varies, both spread and the engagement decrease in time. On the contrary, user u89 gains not only spread for
his/her posts, but also the users that are commenting are highly active - the engagement ratio equals at the beginning 4 and is rising with time. In the case of user u6, the possible
expla-nation for such trend is that independently from the number of posts that the user is generating, the audience is gradually loosing interest. Additionally, we can observe one significant peak in the spread and one time window, which suggests that the person was very popular (maybe controversial?) at one particular moment, which spiked the number of users reacting to the content. However, after that the user was not able to maintain such an audience. The case of user u89 shows
how the user is systematically gaining popularity (increasing the spread value). Moreover, observed increase of spread is simultaneous with the increase of audience engagement. This shows that Inic was able to determine influence evolution would be particularly helpful for campaigns in which the audience should be an active collaborator, for example giving feedbacks about the product.
VI. RELATED WORK
Much of the current research is focused on the problem of Influence Maximization, in which the aim is to find the group of nodes in the social network for which the information spread will be maximal. The systems, e.g. [3], [4], targeting influence maximization problem are focused on selecting a
0 5 10 15 50 70 90 Post count Window (timeline) #posts 0 5 10 15 1.25 1.35 1.45 1.55 Engagement Window (timeline) Engagement v alue 0 5 10 15 1000 3000 5000 Spread value Window (timeline)
Spread (unique audience)
0 5 10 15 1000 4000 7000 Influence value Window (timeline) Influence
Fig. 5. Falling trend of user u6
0 5 10 15 700 800 900 Post count Window (timeline) #posts 0 5 10 15 4.0 4.5 5.0 5.5 Engagement Window (timeline) Engagement v alue 0 5 10 15 450 550 650 Spread value Window (timeline)
Spread (unique audience)
0 5 10 15 2000 3000 Influence value Window (timeline) Influence
Fig. 6. Rising trend of user u89
subset of users basing on the graph, where users are already connected via influence relations. In comparison, in this work we target evaluating the influence between the users and establishing a rank for them.
There are several works proposing various influence metrics for ranking influential users in social networks. Many of them are platform specific, for example operating on Twitter [6], or job portals [8], as opposed to this work, which aims to propose the general approach that can be tuned to any social network site. Few of the well-known, well-established influence metrics base their model only on the typology of the network, i.e. PageRank [7], or centrality measures [12]. However, these methods do not consider deeper network characteristics, such as differences between types of reactions between the users, or the aspect of time dependency.
To the best of our knowledge, the work of Rao et al. [9], [11] is the closest to our approach. However, there are several key differences between the methods. Rao et al. system called Klout focuses on being multi-platform, while our ARIM is build for single platform, targeting a platform-specific influencers’ analysis. This means that ARIM not only
needs less data, but also it can be more helpful to use it in practice, i.e. for small advertiser companies. On top of that, probably due to the company privacy, none of the articles published by Klout reveals enough details about the metric to really have inside into their work, e.g. in their article they mention using both weights and more than 3 thousand features to calculate the final score, however, they do not include any details about them.
VII. CONCLUSION
In this paper, we presented the Action Reaction Influence Model that evaluates influence for each user basing on the proactive (actions) and reactive (reactions) behaviors of social network participants. The model targets three aspects of in-fluence, namely intensity of inin-fluence, spread and audience engagement in the context of influence value, and time. Importantly, the model is flexible in terms of features that may or may not be available for particular social network site. Moreover, it also embraces the fact that different reactions types should be differently considered and should have various significance for the final influence score of a particular user. Furthermore, we have proposed an additional model, Inic, that focuses solely on influence trends in time. We have performed experiments on two real-world datasets including data from two well-known social network sites, namely Facebook and Pinterest. The results present interesting discoveries about the users influence and indicate the adequacy of the proposed ARIM model. They also show how different emphasis on various types of reactions can change overall influence rank.
As future work, we intend to deepen further analysis of influence trends. In particular, we want to focus on users that, while being not at the highest positions in influence ranks, show the potential to gain the influence with time.
REFERENCES
[1] The psychology of sharing. why do people share online? https://www. bostonwebdesigners.net/wp-content/uploads/POS PUBLIC0819-1.pdf. The New York Times Customer Insight Group (2011), Accessed: 2018-05-18.
[2] Moira Burke and Robert E Kraut. Growing closer on facebook: changes in tie strength through social network site use. In Proceedings of the SIGCHI conference on human factors in computing systems, pages 4187–4196. ACM, 2014.
[3] Wei Chen, Tian Lin, Zihan Tan, Mingfei Zhao, and Xuren Zhou. Robust influence maximization. In Proceedings of the 22nd ACM SIGKDD International Conference on Knowledge Discovery and Data Mining, pages 795–804. ACM, 2016.
[4] David Kempe, Jon M Kleinberg, and ´Eva Tardos. Maximizing the spread of influence through a social network. Theory of Computing. [5] Maksim Kitsak, Lazaros K Gallos, Shlomo Havlin, Fredrik Liljeros,
Lev Muchnik, H Eugene Stanley, and Hern´an A Makse. Identifi-cation of influential spreaders in complex networks. arXiv preprint arXiv:1001.5285, 2010.
[6] Peter Laflin, Alexander V Mantzaris, Fiona Ainley, Amanda Otley, Peter Grindrod, and Desmond J Higham. Discovering and validating influence in a dynamic online social network. Social Network Analysis and Mining, 3(4):1311–1323, 2013.
[7] Lawrence Page, Sergey Brin, Rajeev Motwani, and Terry Winograd. The pagerank citation ranking: Bringing order to the web. Technical report, Stanford InfoLab, 1999.
[8] Arti Rames, Mario Rodriguez, and Lise Getoor. Multi-relational influ-ence models for online professional networks. In Proceedings of the International Conference on Web Intelligence.
[9] Adithya Rao, Nemanja Spasojevic, Zhisheng Li, and Trevor DSouza. Klout score: Measuring influence across multiple social networks. In Big Data (Big Data), 2015 IEEE International Conference on, pages 2282–2289. IEEE, 2015.
[10] Lauren Scissors, Moira Burke, and Steven Wengrovitz. What’s in a like?: Attitudes and behaviors around receiving likes on facebook. In Proceedings of the 19th ACM Conference on Computer-Supported Cooperative Work & Social Computing, pages 1501–1510. ACM, 2016. [11] Nemanja Spasojevic, Zhisheng Li, Adithya Rao, and Prantik Bhat-tacharyya. When-to-post on social networks. In Proceedings of the 21th ACM SIGKDD International Conference on Knowledge Discovery and Data Mining, pages 2127–2136. ACM, 2015.
[12] Reza Zafarani, Mohammad Ali Abbasi, and Huan Liu. Social media mining: an introduction. Cambridge University Press, 2014.
[13] Changtao Zhong, Sunil Shah, Karthik Sundaravadivelan, and Nishanth Sastry. Sharing the loves: Understanding the how and why of online content curation. In 7th International AAAI Conference on Weblogs and Social Media (ICWSM13), Boston, US, July 2013.