Titre:
Title
:
Follow the (Industry) Money: The Impact of Science Networks and
Industry-to-University Contracts on Academic Patenting in
Nanotechnology and Biotechnology
Auteurs:
Authors
: Catherine Beaudry et Ramine Kananian
Date: 2013
Référence:
Citation
:
Beaudry, Catherine et Kananian, Ramine (2013). Follow the (Industry) Money: The Impact of Science Networks and Industry -to-University Contracts on
Academic Patenting in Nanotechnology and Biotechnology. Industry & Innovation, 20(3), p. 241-260. doi:10.1080/13662716.2013.791125
Document en libre accès dans PolyPublie
Open Access document in PolyPublie
URL de PolyPublie:
PolyPublie URL: http://publications.polymtl.ca/2309/
Version: Version finale avant publication / Accepted versionRévisé par les pairs / Refereed Conditions d’utilisation:
Terms of Use: CC BY-NC-ND
Document publié chez l’éditeur commercial Document issued by the commercial publisher
Titre de la revue:
Journal Title: Industry & Innovation
Maison d’édition:
Publisher: Taylor & Francis
URL officiel:
Official URL: http://dx.doi.org/10.1080/13662716.2013.791125
Mention légale:
Legal notice:
This is an Accepted Manuscript of an article published by Taylor & Francis in Industry & Innovation on 2013, available online:
http://www.tandfonline.com/10.1080/13662716.2013.791125. Ce fichier a été téléchargé à partir de PolyPublie, le dépôt institutionnel de Polytechnique Montréal
Follow the (industry) money – the impact of science
networks and industry-to-university contracts on
academic patenting in nanotechnology and
biotechnology
2
Catherine Beaudry
c,b& Ramine Kananian
cc
Ecole Polytechnique of Montreal,
bCentre for Interuniversity Research on Science and
Technology (CIRST)
ABSTRACT
We investigate the factors influencing an academic’s propensity to patent and the quality of patenting in nanotechnology and biotechnology. We find that a university researcher is more likely to be listed as an inventor of a patented innovation, regardless of the assignee, if he receives private funding, has a fairly high level of cliquishness in the scientific network and has shown a prior capacity to successfully collaborate with industry, a concept that we name innovation loops. Furthermore, citation rate and number of claims, which are both used to represent patent quality, are influenced by factors similar to those explaining patent quantity. KEY WORDS: innovation networks, patents, university-industry collaboration, industrial contracts, nanotechnology, biotechnology2 Correspondence Address : Catherine Beaudry, Department of Mathematics and Industrial Engineering, Polytechnique Montreal, P.O. Box 6079, Downtown Station, Montreal, Quebec, H3C 3A7, Canada. Email: catherine.beaudry@polymtl.ca
1. Introduction
Worldwide, scientists have been encouraged to work within increasingly large networked teams, a phenomenon exemplified in Canada by the Networks of Centres of Excellence (NCE) initiative put in place more than 20 years ago (in 1989). Co-publication and co-invention networks have been studied extensively in the literature to measure the social and epistemic proximities between scientists and inventors (Balconi et al., 2004; Singh, 2005). While academic networks, or social capital, are important to science-based entrepreneurial firms (Murray, 2004), how these benefit individual scientists and their scientific and technological production have rarely been examined. The study of D’Este et al. (2012) is an exception but unfortunately they find no evidence that the size of the research network influences the propensity of an academic to patent. Generally, however, the productivity and performance points of view examined are that of the firm (Owen-Smith and Powell, 2004; Graf and Krüger, 2011) or of the capacity of academic inventors or entrepreneurs to start their own firms (see Rothaermel et al. 2007 for a review). In addition to encouraging cross-discipline collaboration, some of the main goals of the NCE program were to “increase industry investment in research and development partnerships” and to “accelerate the commercialization of technologies, products and services”. The links between university and industry however continue to be the object of a heated debate between the advocates of science as a public good and those in favour of the universities’ third mission or of the entrepreneurial university. In support of the latter, Governments are increasingly looking for ever more efficient mechanisms to transfer knowledge from university to industry. This paper contributes to this effort by aiming to disentangle the effect of scientific networks, public funding and private contracts on the patenting performance of academics. Our study hence stands out from the literature because of its triangular approach to academic patent performance. This study benefits from having built an extremely richdatabase on funding, both public and private, publications and patents of Quebec biotechnology and nanotechnology academics, hence providing a complete portrait of research inputs and outputs. Our theoretical framework thus stands at the confluent of the literatures on networks (Breschi and Catalini, 2010; Cowan & Jonard, 2003), academic patenting (Balconi et al., 2004; Breschi et al., 2005; Meyer, 2006) and university-industry linkages (Etzkowitz, 1998; D’Este & Patel, 2007). The involvement of academics in patented innovations may be due to a number of factors, i.e. technology push from publicly funded research or demand pull from industry-contracted research. The underlying theme of the article remains the fact that academics do not generally work alone, hence the importance of networks throughout the innovation process and of the position occupied by academic inventors within these scientific networks. We also introduce a novel concept which we call ‘innovation loops’ that aims to follow the money from the first investment of a firm towards an academic’s research and back to the firm as the assignee of a patented innovation in which the contracted academic is a named inventor. This study hence focuses on evaluating the innovative performance of academics in nanotechnology and biotechnology and our goal is twofold. First, we wish to examine the factors contributing to the patenting output of a university researcher. Second, we aim to measure the impact of these factors on the quality of patents as defined by claims and citation rates. Our focus is therefore on academic patenting rather that university patenting to ensure that all patents to which academics contributed are accounted for (Czarnitzki et al., 2011; Geuna & Nesta, 2006). The remainder of the article proceeds as follows. Section 2 examines the supporting literature and proposes hypotheses concerning networking, industry-university collaboration and funding. Section 3 provides a concise data and variables description, and explains the estimation methods used. Section 4 analyses our regression results. Finally, section 5 discusses the validation of our hypotheses and concludes with a brief synthesis outlining our contributions and directions for further research.
2. Theoretical Framework and Hypotheses
In science-based high technology fields such as nanotechnology and biotechnology, the distinction between basic and applied research is a very fine one (Robinson et al., 2007). Moreover, both fields can be considered Grilichesian breakthroughs, i.e. they are both inventions of methods of inventing (Darby & Zucker, 2003). This characteristic makes them scientifically and economically invaluable. Finally, these are fields for which patents are an important mechanism of intellectual property protection, hence facilitating the measure of innovation. Let us first briefly justify our use of patents, claims and citations as measures of innovation and quality. On the one hand, Rothaermel & Thursby (2007) remind us that the patent represents an instance in which a novel, non-trivial and useful invention comes to fruition, and Blackman (1995) shows that up to 80% of all technological knowledge is contained in them. On the other hand, firms collaborating with academics may however prefer secrecy as a means to protect the intellectual property developed (Cohen et al., 2000), while some academics may prefer to put their innovation in the public domain via publication in very applied journals. Patents are nevertheless used by many scholars for the study of innovation in nanotechnology (Meyer & Persson, 1998; Meyer, 2006) and biotechnology (Breschi & Catalini, 2010; Murray & Stern, 2007). Citations are useful in determining the invention’s capacity to enable further innovation and are used by a number of scholars (Lanjouw & Schankerman, 2004; Bonaccorsi & Thoma, 2007) as a reliable indicator of patent quality. Czarnitzki et al. (2011, pp. 1403) for instance show that “academic involvement in patenting results in a citation premium”. Claims can also be utilised as an indicator of patent quality (Tong & Frame, 2004). The idea here is that the more claims associated to a patent the broader the scope of the invention.Sociologists have a long tradition of using social network analysis to study the behaviour of individuals (see for instance Granovetter, 1973). More recently, Newman (2001) has shown that scientific networks form a “small world”, i.e. cliquish with relatively short paths. The redundancy of the links implied by higher cliquishness ensures the development of a common language and the establishment of trust among the team, which should enhance innovation. Highly cliquish networks generally enhance system performance and knowledge diffusion (Uzzi & Spiro, 2005; Schilling & Phelps, 2007). Transposing their argument to the realm of scientific networks implies that being surrounded by a more integrated clique should increase academic innovation performance. But only up to a point as Cowan and Jonard (2003) highlight the negative effects of redundancy stemming from a high cliquishness and Fleming et al. (2007) find a negative impact of higher cliquishness on innovation productivity. Breschi & Catalini (2010) find that even though they present different objectives and reward structures (Dasgupta & David, 1994), university and industry researchers are relatively well connected. In fact, they find that academic-inventors who link these two communities present a higher betweenness centrality measure in the scientific network and are essential to reducing the gap separating science and technology, i.e. they have a strong intermediary role in the network. Beaudry and Allaoui (2012) show that a more central intermediary position (higher betweenness centrality) in the scientific network has a positive impact on the number of articles published by academics. When studying the factors that contribute to a scientist’s innovative output, accounting for the position in the co-authorship network is therefore crucial if only for the great inter-connexion that exists between science and technology in high tech industries. This evidence hence brings us to propose our first hypothesis: H1: (a) A more central network position and (b) being surrounded by a more integrated clique are beneficial to both the quantity and the quality of patents of an academic-inventor.
University scientists do not solely collaborate with other university researchers, an increasing number of them also have links with industry, especially in high technology fields where the connexion between basic science and applied science is greatly significant, highlighting the importance of such partnerships (Meyer & Persson, 1998). Collaboration between firms and academics has been extensively studied (Brusoni et al., 2001; Meyer, 2006), generally concentrating on the benefits to firms (Bonaccorsi and Piccagula, 1994; Murray, 2004): lower R&D costs, building and maintaining a solid science base, higher innovation production, etc. Academics also greatly rely on this type of collaboration as the advantages are numerous: increased funding, exploration of research areas which were not originally intended, exposure to state of the art application of their technology, the possibility to enhance their professional network, exposure to new ideas, etc. (Agrawal & Henderson, 2002; Siegel et al., 2003). Czarnitzki et al. (2011, pp. 1429) further adds that “academic involvement in patenting results in greater knowledge externalities as measured by forward citations”. The underlying university-industry collaboration clearly benefits both the firm and the academics involved. A number of measures can be used to assess the extent of industry-academia collaboration. One such measure of faculty consulting is firm-assigned patents on which academics are named inventors (Jensen et al., 2010; Thursby and Thursby, 2011). In this article we are interested in the commercially driven academic consulting (Perkmann and Walsh, 2008), which is more likely to result in patenting. We therefore expect to validate the following hypothesis: H2: Academic scientists that contribute to patents of private organisations that have funded their research are more likely to patent innovations of a greater quality. University-industry collaboration may not however benefit both parties equally; patenting may have a negative effect on publishing. The possible trade-off (or substitution) between the production of patentable technology and of scientific knowledge has been explained by the anti-commons hypothesis
(Heller & Eisenberg, 1998; Murray & Stern, 2007), the clear distinction between science and technology reward structures (Dasgupta and David, 1994; Stephan, 1996), or the fact that patenting is time consuming (Azoulay et al., 2006). Lower publication rates can also be attributable to the fact that some academics are required to hold on to information relevant to a patent prior to its application in order to maintain the novelty of the innovation, i.e. the delay-of-publication clause (Breschi et al., 2007; Thursby & Thursby, 2002). Some degree of complementarity between patents and papers is also conceivable (Murray, 2002; Owen-Smith & Powell, 2003) because “patents can be a logical outcome of research activity” (Stephan et al., 2007, pp. 74) or “most patentable research is also publishable” (Agrawal & Henderson, 2002, pp. 58). Owen-Smith and Powell (2001) suggest that scientists patent because it increases their visibility and that of the novelty of their research. Because research in nanotechnology and biotechnology often overlaps both science and technology, complementarity could overcome the substitution effect between patent and papers. We have thus chosen to focus on inputs, i.e. funding, rather than potentially competing outputs, i.e. articles3. Funding is indeed essential to research in high tech fields, if only for the fact that infrastructure and equipment are expensive (Robinson et al., 2007). Two main sources of funding can be distinguished: grants, mostly provided by various public sources, and contracts, often awarded by private entities with the intent of fulfilling a specific set of applied goals generally set by the contractor. Receiving grants helps a scientist to concentrate on publishing activities. Not only will this increase the scientist’s prestige or reputation within the scientific community, it will in turn incite the institution of affiliation to 3 In light of the evidence presented, examining the possible reinforcing effect of publishing on patenting could in fact be seen as reverse causality. The issue of endogeneity between funding and articles is addressed later in the article.
financially reward that scientist (Stephan & Levin, 1992). Increasingly however, researchers are patenting the results of their publicly funded research. Contracts in contrast may also lead to inventions that are most often subsequently patented. It has recently been shown that accepting contracts not only does not hinder an academic’s publishing performance (Gulbrandsen & Smeby, 2002; Geuna & Nesta, 2006) it also increases the quantity and quality of publications which can in turn be beneficial for patenting. Our third hypothesis thus reads as follows: H3: (a) Grants and (b) contracts have a positive effect on patenting and on the quality of these patents.
3. Methodology
3.1 Data description
This research is based on the combination of three sources of data on patents, scientific articles and a detailed account of university funding received by academics in Quebec, Canada. Patent data was extracted from the United States Patent and Trademark Office (USPTO). Because of the proximity to the US and the fact that it is a much larger market, most firms that protect their intellectual property in Canada, also do so in the US. The Canadian Intellectual Property Office (CIPO) does not provide the addresses of inventors in a consistent manner, which is essential for the disambiguation of the merged data. Data extraction used the OECD’s (2005) list of biotechnology-related Industrial Patent Classification (IPC) codes and a combination of nanotechnology-related keywords taken from Barirani et al. (forthcoming). Although a classification highlighting nanotechnology IPC codes exists (Igami & Okazaki, 2007) it was not used because “[t|he lexical query of Porter et al. (2008) returns nearly 50,000 patents between 1990 and 2005, while the USPTO currently (as of June 2012) classifies only 4,193 patents in class 977 for thesame period” (Barirani et al. forthcoming)4. Selecting only the patents for which at least one inventor has an address in Canada; we have extracted 12 836 biotechnology patents and 5 934 nanotechnology patents between 1976 and 2005. For these patents, we extracted all the citations up to the end of 2009. Data relative to publishing was extracted from Elsevier’s SCOPUS which compiles all information pertaining to scientific article abstracts and citations. For nanotechnology, we used the same keywords that were utilised for the patent extraction while for biotechnology, we used the keyword search developed by Clerk-Lamalice (2009). Once again selecting only the scientific articles on which at least one author has an affiliation in Canada, we found 138 136 biotechnology articles and 42 543 nanotechnology articles between 1929 and 2009. Finally, the funding data is provided by the Système d’Information de la Recherche Universitaire5 (SIRU), a system managed by the Quebec Government which accounts for all public and private funding received by Quebec academics on a yearly basis, specifying the source and amounts obtained. The SIRU database has been ‘cleaned’ and verified by the Observatoire des Sciences et des Technologies and hence provides an excellent base for the merger of patent and article data. We can therefore track firms 4 We deliberately cast a wider net using keywords because we want to ensure that we get the complete set of articles and patents produced by Quebec biotechnology and nanotechnology academics. The funding database to which we have access only mentions the title of the grant and contracts, it is therefore very difficult to assess which grants and contracts would be dedicated to purely biotechnology or nanotechnology research. For this reason, we believe judicious to include more articles and patents to ensure that academics on the periphery of biotechnology and nanotechnology do not bias the results because, for instance, only half of their scientific and technological production is accounted for. We have verified for a small sample of scientists for which we have the CV that this method catches most of their production. It yields better results than say using the 977 USPTO nanotechnology classification. 5 Information System on University Research.
and other organisations that fund academics and that are subsequently the assignees of patents on which the funded researchers are named inventors. Merging these three databases required a considerable amount of work to overcome the traditional disambiguation of individuals. Addresses of inventors and affiliations of scientists (from both SIRU and Scopus) were checked manually to clearly identify the academic inventors, eliminate dual entries due to misspelling of names (synonymy) and add alter egos of individuals with similar names but clearly differing affiliations and addresses through time (homonymy). Selecting only the scientists that have published at least five articles in the domains (biotechnology or nanotechnology) during the course of their career, our final sample comprises of 1460 scientists from 1996 to 2005, with on average 6 years of ‘presence’ for a sample of 9068 observations. The reason for selecting only these scientists stems from the fact that we want to limit the number of scientists that sporadically publish or patent in these two fields for which we would not be able to distinguish the funding that relates to nanotechnology or biotechnology from that of chemistry, biology or material science, for instance. We are relatively confident that the selected individuals are active nanotechnology and biotechnology scientists. In addition to matching individuals, we also had to correctly identify the assignees (from USPTO) that had contributed to research contracts (from SIRU) of Quebec academics. This exercise was performed manually to account for corporate restructuring, name variations (including French to English) and known horizontal mergers. Having identified the scientists that have performed contracted work with an organisation prior to being a named inventors on a patent assigned to that particular organisation, we constructed what we referred to earlier as ‘innovation loops’. The identification of these loop is an extensive process that also takes into account previous work by Calero et al. (2006) to reduce homonymy and synonymy of actors’ names and Daim et al. (2007) for time-framing.
3.2 Variables
From the patents, three dependant variables are constructed for each inventor for any given year: the number of patents on which a university researcher is listed as an inventor [nbPatents], the number of claims contained in this patent [nbClaims] and the number of citations received after 5 years [nbCitations]. The citations are compiled over a fixed interval of 5 years6 in order to eliminate the bias that would occur with older patents receiving a disproportionate amount of citations compared to more recent ones. These are the three dependent variables of the models described below. The basic statistics of the variables along with the correlation table are presented in Table 2 in Appendix A. Using co-publication data, we characterise the co-publishing network to calculate various network indicators of a researcher’s position within the scientific community. In this paper we focus on two of these measures to determine the network position: individual cliquishness [Cliquishness] and betweenness centrality [Betweenness], which are calculated over a 3-year7 period to account for extended collaboration8. Turning now to our measure of university-industry collaboration, [nbLoops] essentially represents the number of instances in which an academic is listed as an inventor on a patent owned by the firm (assignee) that originally funded the academic’s research up to year t. We believe this variable to be a good indicator of successful collaboration between industry and university. 6 Citations were also compiled over periods of 3 and 7 years but regressions using 5-year citation intervals yielded the best results. 7 5-year networks were also investigated but the results were better for 3-year networks. 8 We have investigated other network indicators, such as degree centrality and closeness centrality. They did not consistently yield statistically significant results and they present too strong a correlation with betweenness centrality to be included in the regressions as well.Funding data takes into account both grants and contracts. Because the amounts received may not reflect the annual spending, we calculate the average total funding over a 3-year period for contracts [Contracts] and for grants [Grants]. In addition, we add a number of control variables to the models presented below. To account for the fact that scientists might be surrounded by a large critical mass of researchers compared to relatively isolated groups, we add the proportion of individuals that the component to which they belong represents [propComponent]. We also control for the fragmentation of the network in the measure of the number of components necessary to account for 80% of the scientists [nbComponent]. To control for the cumulative nature of applied science, we build an ordinal variable that takes the value 0 if a researcher has never patented in the past, 1 if he has patented once, and 2 if he patented more than two patents in the past [PastPatenting] relative to the application year. In examining the effects of publishing on patenting we calculate the mean9 degree of application [BasicResearch] of the knowledge associated with the articles published by a researcher over the 3-year period leading to patent application. This degree of application is a concept we borrow from Hamilton (2003) and is based upon an ordinal classification of the journals, in which articles are published, from applied to basic research on a scale ranging from 1 to 4. We postulate that academics that patent in more basic journals are less likely to patent. Finally, the years [d1996-d2005] and institutional affiliations (university dummy variables) are also compiled as they may help explain why certain researchers are more prolific inventors than others and why their patents are of better quality than others. 9 We have explored using the median, minimum and maximum value of the degree of application. Only the mean
3.3 Estimation methods
The data are set up longitudinally in a panel, taking into account each researcher’s yearly performance from 199610 to 2005. All three dependent variables are non-negative discrete variables, i.e. count data. The preferred method in this case is generally the Poisson regression, however its main structural requirement, i.e. having equidispersion, is not satisfied in any of our cases, we therefore use the negative binomial regression and its variants. Three alternative methods are used: (1) negative binomial regression with the panel option (xtnbreg), (2) negative binomial regression (nbreg) and (3) zero-inflated negative binomial regression (zinb) taking into consideration repeated observations for individuals. It is preferable to estimate the regressions in a panel format (xtnbreg) since our database is constructed longitudinally, i.e. modelling both identity and time dimensions. The zero-inflated model proves useful when there are an excess of zeros in the dependent variable. In our case, this is due to the fact that there are several years in which academics do not patent. For instance a researcher may have had the opportunity to patent an invention but opted not to do so or he may not have had the opportunity to patent due to the lack of an invention, resources, funding, and so on. The negative binomial regression model to be estimated is therefore the following for the three dependent variables: !"#$%&!%'( !")*$+,'( !")+%$%+-!'( = / ln 23$!%(45 , ln 23$!%'(45 7, ln )-!%3$8%'(45 ,93-9)-,9-!&!%(, !")-,9-!&!%80(, <&%=&&!!&''(47, )*+>?+'ℎ!&''(47, )*+>?+'ℎ!&''(47 7, !"A--9
(45, <$'+8(45,
#$'%#$%&!%+!B(45, CD$!-, C<+-, CE!+F, CG&$3
The first part of the zero-inflated regression model estimates the propensity of a researcher ‘not’ to patent using a logit or a probit regression. This propensity is modelled as:
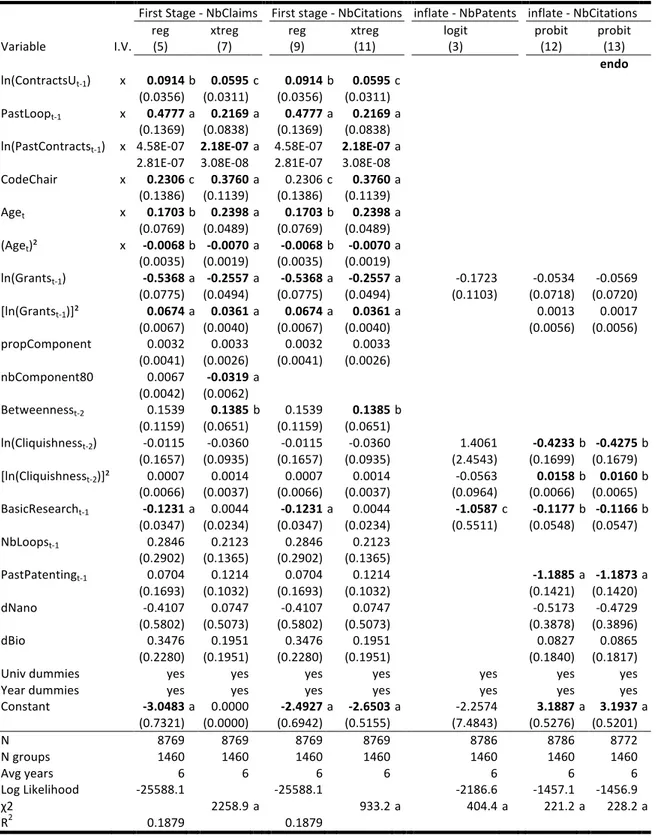
C#$%&!%'( = / ln 23$!%'(45 , ln 23$!%'(45 7, )*+>?+'ℎ!&''(47, )*+>?+'ℎ!&''(47 7, !"A--9(45, <$'+8(45, #$'%#$%&!%+!B(45, CD$!-, C<+- One element of paramount importance that we have not yet discussed is the inherent problem of endogeneity when dealing with such types of data. Contracts may be easier to obtain when a researcher leads a well (publicly) funded lab. The amount of funds necessary to finance this research is influenced by the publication record of the individual scientist and of his team and vice versa (Beaudry and Allaoui, 2012). These publications may however be delayed because of patenting activities, and so on and so forth. Accounting for potential endogeneity is therefore key to mitigating potential bias in our regressions. As described here, this endogeneity is mostly due to the simultaneity of one or more dependant variables. Hence this situation is dealt with by performing two-stage residual inclusion (2SRI) on the negative binomial regressions11 (Terza et al., 2008) and two-stage least squares (2SLS) on the zero-inflated negative binomial regressions (Stephan et al., 2007). During the course of our research, we have examined three potentially endogenous variables, the number of articles, the amount of grants and the amount of contracts. Only one, the latter, proved to be endogenous and will be presented in this article. The first-stage regression to be estimated using ordinary least squares (OLS) is therefore the following, taking into account the endogenous variable relative to the contracts.
ln )-!%3$8%'(45 = B #$'%A--9IB&(47, ln #$'%)-!%3$8%'(47 , )-C&)ℎ$+3, (, IB&( 7, ln )-!%3$8%'E(45 When instrumenting for contracts, we use other variables pertaining to funding such as the cumulative amount of contracts received in the past ten years [PastContracts] and the average amount of contracts 11 Terza et al. (2008) did not use their 2SRI method on panel data. As a robustness check of the use of this method in a panel data format, we therefore include both the non-panel (nbreg), accounting for the clustering of
awarded to colleagues in the same field at the researcher’s institution of affiliation with [ContractsU] to consider the importance of funding at the university level. To account for personal characteristics we add a proxy for the age of a scientist [Age] (Stephan et al., 2007) measured by the number of years since the publication of the academic’s first article, which we assume to correspond to the start of an academic career, from 1985 onwards. This attribute may play a role in the sense that older academics, being less worried about ‘perishing’ if they don’t publish, are better positioned to allocate resources to more financially rewarding tasks (Dasgupta & David, 1994; Thursby & Thursby, 2005). Finally, we add a measure of intrinsic quality of a researcher in the type of chair that she occupies. The variable [CodeChair] is an ordinal indicator of the type of chair that the scientist holds, with 0 representing no chair, 1 being an industrial chair, 2 being a chair from two of the Canadian federal granting councils and 3 being a Canada research chair. For each individual, the highest rank achieved over a career is given to an academic, regardless of the year at which she achieved this status12. Finally, we also calculate the cumulative number of loops to which a researcher has contributed in his career [PastLoop].
4. Regression results
The results of the regressions (second stage when relevant) are presented in Table 1. We could find no endogeneity in the [nbPatents] regressions from either three potentially endogenous variables, thus regressions 1 to 3 present the results for the number of patents without accounting for potential endogeneity. Regressions 4 to 7 show the results for the number of claims [nbClaims]; as there is no ambiguity about the type of zeros, there are no patents with 0 claims, the zero-inflated negative binomial regression model is not appropriate here. Finally, regressions 8 to 13 present the results for the number of citations 5 years after the patent is granted [nbCitations]. Table 3 in appendix B presents the first stage of the negative binomial regressions with 2SRI as well as the logit and probit regression parts 12 We have tested an evolving version of this chair variable in the regressions, but the results were not significant.of the zero-inflated negative binomial regression using OLS regressions. The results of the first stage regressions show that [Contracts] are properly instrumented. [Insert Table 1 about here] Let us now go through the regression results starting with the factors influencing the propensity to patent a number of inventions for any given year. We find that there is a positive effect of contracts on patenting13. The same can be said for an academic’s cliquishness, however it presents a non-linear effect that indicates that having too much of an integrated network can be unfavourable for patenting. As far as industry-university collaboration is concerned, having participated in a larger number of ‘fruitful’ collaborations (nbLoops) in the past, i.e. one that has led to an industrial patent, is found to be very beneficial. A history of patenting (PastPatenting) also has a positive effect on future patent output. These two variables are neither correlated nor do they have a moderating effect on one another when we interact them in the model (by adding an interactive term). Turning now to the quality of these patents, we find very similar results for the impact of past patenting activities within innovation loops or not (nbLoops and PastPatenting), for both the number of claims and the number of citations. Hence a both a history of patenting and patenting collaboratively lead to inventions that are not only of greater scope but that also enable future inventions. As far as network effects are concerned, cliquishness, which was important for the number of patents, has a slightly less robust impact on the number of claims and citations. In general, the inverted-U relationship is maintained. Betweenness has however become of interest; it seems that having a more central position in the scientific community is beneficial for both quality indicators, the effect is however not consistently significant.
When accounting for funding, we notice that contracts generally contribute to better quality patents but that results on grants are mixed. When controlling for possible endogeneity of the contract variable, we find endogeneity only in two of the models examined (regressions 7 and 9). While we find that a greater amount of grants has some effect on the number of claims, there is no observable effect on the number of citations. The inverted-U relationship between grants and claims implies that the most funded scientists produce patents of lesser ‘quality’, i.e. too much funding hence eventually becomes detrimental to a greater patent scope.
5. Discussion and conclusion
At the start of this article, we set to investigate three hypotheses regarding the impact of various factors on the patenting output of academic scientists. While we are conscious of the limitations of our study – data on small science-based domains, biotechnology and nanotechnology, specific Canadian context, Canadian networks as opposed to world network – we are nevertheless confident to our approach following the money through innovation loops while accounting for network positions and funding availability brings novelty to the literature. Let us address each of these hypotheses in turn. The first hypothesis (H1) postulated that a better network position in the co-publication network would have a positive influence on both the quantity and the quality of the patents generated. While we found no evidence that a better intermediary position is valuable to patenting taken alone, it is important for the quality of patenting (consistently for claims and partly for citations), hence supporting the findings of Owen-Smith and Powell (2004) for firms, and of Beaudry and Allaoui (2012) for scientists. More centrally located individuals in the scientific network contribute to patents of wider scope (more claims) in terms of potential uses, and which are potentially more highly cited. The most interesting finding of this research is probably the non-linear effect of the cliquishness (similar to the left-hand leg of an inverted-U relationship) for both quantity and quality of patenting, which weinterpret as the importance, for researchers, of belonging to a fairly integrated community of collaborators. Too little cliquishness is not beneficial but too much cliquishness eventually has a decreasing returns effect. In other words, academic inventors increase the likelihood of patenting innovations of greater quality by being surrounded by a more integrated clique (supporting the findings of Uzzi & Spiro, 2005 as well as that of Schilling & Phelps, 2007), but eventually the increased benefits of integration start to diminish, hence suggesting a negative effect associated with too much redundancy as highlighted by Cowan and Jonard (2003). We do not observe a truly negative effect of higher cliquishness, as do Fleming et al. (2007)14. This highlights the importance of the diversity of links with distinct epistemic communities. Academic inventors would therefore be better off investing their efforts in a slightly less integrated, or more diversified, scientific clique, if a great deal of effort is required to do so. For instance, the type of efforts required could be related to setting up a very large research network, or investing a great deal of time in building an international network. H1 is therefore only partially supported. Somewhat related, the second hypothesis (H2) aimed at identifying the influence of university-industry collaboration, which we modelled as being part of an innovation loop, on patenting productivity and quality. We found that participation to innovation loops currently and in the past, i.e. the number of instances for which a researcher contracted by a particular firm is a named inventor on a patent of this particular firm, has a strong positive influence on the propensity to patent more and to generate patents of higher quality, in terms of claims and of citations, hence validating H2. A closer implication of academics into private innovation does have a positive impact on the propensity to patent of academics, but also on the quality of these innovations, a result somewhat akin with Czarnitzki et al.’s (2011) findings that patents involving academics are more cited. 14 When we omit the square term of Cliquishness, we do however obtain a negative coefficient. We nevertheless
The third hypothesis (H3) proposed that both grants and contracts have a positive effect on the propensity to patent and on the quality of these patents. Not surprisingly, we find a positive and significant relationship between contracts and patents. Grants have been shown to have little to no effect on patenting and citations. Contracts do however have an impact on the number of claims. The relationship between public funding and the number of claims follows an inverted-U relationship, in other words, the relationship is positive up to a certain threshold beyond which a larger amount of funding becomes detrimental to more numerous claims, hence suggesting a substitution effect between grants and contracts. Academics less successful at obtaining public funds may compensate this lack of funding by raising funds from private contracts. It is also possible that researchers well provided in contracts feel a lesser need to compete for public funds. While our research cannot disentangle these two effects15 for the left-hand leg of the inverted-U shaped curve, the negative effect (although not always significant) of grants on the number of claims associated with greater amounts of public funds suggests a more important focus on basic research. Consequently, hypothesis H3a is refuted but H3b is generally validated. Canada has no Bayh-Dole Act equivalent and all universities have different intellectual property (IP) protection policies, which could explain why public funding has no consistent effect on patents and their quality and contracts dominate the patenting scene. Because Canadian granting councils strongly encourage university-industry partnerships in a number of funding programs, an important mechanism to ensure that university generated innovations end up in industry, their effect on innovation may therefore be indirect, and hence not picked up by our analysis. 15 We have examined various models to try to account for these two effects, including interactive variables between grants and contracts, but none yielded significant results.
To sum up, what does our research tell us about the collaborative communities of academic-inventors? First, researchers should collaborate with a number of research communities that are not perfectly interrelated, hence maintaining some level of diversity, as it may eventually lead to decreasing returns in terms of quantity and quality of patents. Second, our results thus support the commercially driven academic consulting argument of Perkmann and Walsh (2008), exemplified by private contracts and by what we have coined ‘innovation loops’. In other words, scientists closely involved in research that lead to patents owned, and possibly instigated, by their private partners produce more and better patents than other academic-inventors.
Acknowledgements
Beaudry acknowledges financial support from the Social Science and Humanities Research Council of Canada (grant # 421-2007-1021) and the Canadian Institutes of Health Research (grant # KRS-94306). We are grateful to Carl St-Pierre for his advice on statistical analysis, to Ahmad Barirani for the data extraction program used in the data collection, to Maxime Clerk-Lamalice for the construction of the data consolidation program and for the exploratory statistical work, and to Sedki Allaoui and Ricard-Olivier Moreau for their contribution to the long and painful database matching process. We would like to thank the editors of this special issue and two anonymous referees for their helpful comments. None of these, however, are responsible for any remaining errors.References
Agrawal, A. Henderson, R. (2002) Putting Patents in Context: Exploring Knowledge Transfer from MIT. Management Science, 48(1): 44-60. Azoulay, P., Ding, W., Stuart, T. (2006) The Impact of Academic Patenting on the Rate, Quality and Direction of (Public) Research Output, NBER Working Paper No. 11917.Balconi, M., Breschi, S., Lissoni, F., (2004) Networks of inventors and the role of academia: an exploration of Italian patent data. Research Policy, 33(1):127–145. Barirani, A., Agard, B., Beaudry, C. (forthcoming). Discovering core Canadian fields of expertise from nanomedicine patents: A co-citation network perspective. Scientometrics. Beaudry, C., Allaoui, S. (2012) Impact of public and private research funding on scientific production: The case of nanotechnology. Research Policy, 41(9):1589-1606. Blackman, M. (1995) Provision of patent information: A National Patent Office Perspective. World Patent Information, 17(2):115-123. Bonaccorsi, A., Piccaluga, A. (1994). A theoretical framework for the evaluation of university-industry relationships. R&D Management, 24(3):229-247. Bonaccorsi, A., Thoma, G. (2007) Institutional complementarity and inventive performance in nano science and technology. Research Policy, 36:813–831. Breschi, S., Catalini, C. (2010). Tracing the links between science and technology: An exploratory analysis of scientists’ and inventors’ networks. Research Policy, 39(1):14-26. Breschi, S., Lissoni, F., Montobbio, F. (2005). From publishing to patenting: do productive scientists turn into academic inventors? Revue Économique Industrielle, 110(2):1-28. Breschi, S., F. Lissoni, Montobbio, F. (2007). The scientific productivity of academic inventors: New evidence from Italian data. Economics of Innovation and New Technology, 16(2):101-118. Brusoni, S., Prencipe A., Pavitt K. (2001). Knowledge specialization, organizational coupling, and the boundaries of the firm: why do firms know more than they make? Administrative Science Quarterly, 46(4):597–621.
Calero, C., Buter, R., Valdés, C. C., Noyons, E. (2006). How to identify research groups using publication analysis: an example in the field of nanotechnology. Scientometrics, 66(2):365-376. Clerk-Lamalice, M. (2009). Évaluation de l’incidence du financement public de la recherche universitaire québécoise dans le domaine de la biotechnologie. Mémoire de maîtrise, École Polytechnique de Montréal. Cohen, W. M., Nelson, R. R., Walsh, J. P. (2000). Protecting Their Intellectual Assets: Appropriability Conditions and Why U.S. Manufacturing Firms Patent (or Not). NBER Working Paper No. 7552. Cowan, R., Jonard, N. (2003). The dynamics of collective invention. Journal of Economic Behaviour and Organization, 52(4):513-532. Czarnitzki, D., Hussinger, K., Schneider, C. (2011). Commercializing academic research: the quality of faculty patenting. Industrial and Corporate Change, 20(5):1403-1437. D’Este, P., Patel, P. (2007). University–industry linkages in the UK: What are the factors underlying the variety of interactions with industry. Research Policy, 36(9):1295-1313. Daim, T., Monalisa, M., Dash, P., Brown, N. (2007). Time lag assessment between research funding and output in emerging technologies. Foresight, 9(4):33-44. Darby, M. R., Zucker, L. G. (2003). Grilichesian breakthroughs: inventions of methods of inventing and firm entry in nanotechnology. NBER Working Paper No. 9825. Dasgupta, P., David, P. A. (1994). Towards a New Economics of science. Research Policy 23(5):487-521. Etzkowitz, H. (1998). The norms of entrepreneurial science: cognitive effects of the new University– industry linkages. Research Policy, 27(8):823-833. Fleming, L., King III, C., Juda, A. I. (2007). Small world and regional innovation. Organization Science,
Geuna, A., Nesta, L. (2006). University patenting and its effects on academic research. The emerging European evidence. Research Policy, 35(6):790-807. Graf, H., Krüger, J. J. (2011). The Performance of Gatekeepers in Innovator Networks. Industry & Innovation, 18(1):69-88. Granovetter, M. S. (1973). The strength of weak ties. American Journal of Sociology, 78:1360–1380. Gulbrandsen, M., Smeby, J.-C. (2005). Industry Funding and university professors’ research performance. Research Policy, 34:932-950. Hamilton, K. (2003). Subfield and level classification of journals (CHI Report No. 2012-R). Cherry Hill, NJ: CHI Research. Heller, M. A., Eisenberg, R. S. (1998). Can patents deter innovation? The anticommons in biomedical research. Science, 280(May): 698–701. Igami, M., Okazaki, T. (2007). Capturing nanotechnology’s current state of development via analysis of patents. OECD Science, Technology and Industry Working Papers, 2007/04, OECD Publishing. Jensen, R., Thursby, J., Thursby, M. (2010). University-Industry Spillovers, Government Funding, and Industrial Consulting. NBER Working Paper No. 15732. Lanjouw, J. O., Schankerman, M. (2004). Patent quality and research productivity: Measuring innovation with multiple indicators. The Economic Journal, 114:441–465. Meyer, M., Persson, O. (1998). Nanotechnology – Interdisciplinarity, patterns of collaboration and differences in application. Scientometrics, 42(2):195-205. Meyer, M. (2006). Are patenting scientists the better scholars? An exploratory comparison of inventor- authors with their non-inventing peers in nano-science and technology. Research Policy, 35:1646-1662.
Murray, F. (2002). Innovation as co-evolution of scientific and technological networks: exploring tissue engineering, Research Policy, 31:1389-1403. Murray, F. (2004). The role of academic inventors in entrepreneurial firms: sharing the laboratory life. Research Policy. 33(4):643–659. Murray, F., Stern, S. (2007). Do formal intellectual property rights hinder the free flow of scientific knowledge? An empirical test of the anti-commons hypothesis. Journal of Economic Behavior & Organization, 63(4):648-687. Newman, M. E. J. (2001). Scientific collaboration networks. II. Shortest path, weighted networks, and centrality. Physical Review, 64:016132. OECD (2005). A Framework for Biotechnology Statistics. OECD, Paris. Owen-Smith, J., Powell, W. W. (2001). To Patent or Not: Faculty Decisions and Institutional Success at Technology Transfer. The Journal of Technology Transfer, 26(1): 99-114. Owen-Smith, J., Powell, W. W. (2003). The Expanding Role of University Patenting in the Life Sciences: Assessing the Importance of Experience and Connectivity. Research Policy, 32:1695–1711. Owen-Smith, J., Powell, W. W. (2004). Knowledge networks as channels and conduits: The effects of spillovers in the Boston biotechnology community. Organization Science, 15(1):5–21. Perkmann, M., Walsh, K. (2008). Engaging the scholar: Three types of academic consulting and their impact on universities and industry. Research Policy, 37(10):1884-1891. Porter, A. L., Youtie, J., Shapira, P., Shoeneck, D. J. (2008). Refining Search terms for nanotechnology. Journal of Nanoparticle Research, 10(5):715-728. Robinson, D. K. R., Rip, A., Mangematin, V. (2007). Technological agglomeration and the emergence of
Rothaermel, F. T., Agung, S. D., Jiang, L. (2007). University entrepreneurship: a taxonomy of the literature. Industrial and Corporate Change, 16(4):691-791. Rothaermel, F. T., Thursby, M. (2007). The nanotech versus the biotech revolution: Sources of productivity in incumbent firm research. Research Policy, 36(6):832-849. Schilling, M. A., Phelps, C. C. (2007). The impact of large-scale network structure on firm innovation. Management Science, 53(7):1113-1126. Siegel, D. S., Waldman, D., Link, A. (2003). Assessing the Impact of Organizational Practices on the Relative Productivity of University Technology Transfer Offices: An Exploratory Study. Research Policy, 32:27-48. Singh, J. (2005). Collaborative networks as determinants of knowledge diffusion. Management Science, 51(5):756-770. Stephan, P. E. (1996). The Economics of Science. Journal of Economic Literature, 34(3):1199-1235. Stephan, P. E., Gurmu, S., Sumell, A. J., Black, G. (2007). Who’s patenting in the university? Evidence from the survey of doctorate recipients. Economics of Innovation and New Technology, 16(2):71-99. Stephan, P. E., Levin, S. G. (1992). Striking the Mother Lode in Science: the importance of age, place, and time. Oxford, Oxford University Press. Terza, J. V., Basu, A., Rathouz P. J. (2008). Two-stage residual inclusion estimation: Addressing endogeneity in health econometric modelling. Journal of Health Economics, 27(3):531-543. Thursby, J., Thursby, M. (2002). Who is Selling the Ivory Tower? Sources of Growth in University Licensing. Management Science, 48:90–104.
Thursby, M., Thursby, J. (2005). Has patent licensing changed academic research? NBER Working Paper No. 11497. Thursby, J., Thursby, M. (2011). University-industry linkages in nanotechnology and biotechnology: evidence on collaborative patterns for new methods of inventing. The Journal of Technology Transfer, 36(6):605-623. Tong, X., Frame, J. D. (1994). Measuring national technological performance with patent claims data. Research Policy, 23:133–41. Uzzi, B., Spiro, J. (2005). Collaboration and creativity: the small world problem. American Journal of Sociology, 111(2):447-504.
Table 1: Second stage negative binomial regressions and zero-inflated negative binomial regressions on the number of patents, claims and citations
nbPatents nbClaims nbCitations
nbreg xtnbreg zinb nbreg xtnbreg nbreg xtnbreg zinb Variable (1) (2) (3) (4) (5) (6) (7) (8) (9) (10) (11) (12) (13)
endo endo endo endo endo
ln(Grantst-1) -0.0061 -0.0167 -0.0308 0.2364 b 0.2065 c 0.0169 0.0520 0.0467 -0.0577 0.0148 -0.0308 -0.1266 -0.1876 (0.0172) (0.0166) (0.0238) (0.1096) (0.1157) (0.0506) (0.0547) (0.1301) (0.1555) (0.0731) (0.0790) (0.1427) (0.1547) [ln(Grantst-1)]² -0.0207 b -0.0174 c -0.0025 -0.0040 0.0088 -0.0034 0.0027 0.0036 0.0104 (0.0082) (0.0091) (0.0036) (0.0094) (0.0132) (0.0054) (0.0070) (0.0100) (0.0118) ln(Contractst-1) 0.0301 b 0.0404 a 0.0313 a 0.0512 b 0.0157 0.0504 a 0.1376 a 0.0613 b -0.0981 0.0498 a -0.0835 0.0133 (0.0117) (0.0102) (0.0121) (0.0225) (0.0380) (0.0091) (0.0421) (0.0254) (0.1023) (0.0137) (0.1045) (0.0220) propComponent 0.0092 c 0.0066 0.0094 c 0.0028 0.0030 0.0055 0.0054 0.0065 0.0067 0.0042 0.0045 0.0034 0.0020 (0.0049) (0.0048) (0.0049) (0.0068) (0.0068) (0.0048) (0.0048) (0.0090) (0.0089) (0.0061) (0.0061) (0.0082) (0.0082) nbComponent80 0.0183 a 0.0205 a 0.0179 a 0.0100 0.0100 0.0176 a 0.0181 a (0.0044) (0.0034) (0.0044) (0.0070) (0.0070) (0.0034) (0.0034) Betweennesst-2 0.0755 0.0826 0.0473 0.2690 b 0.2806 b 0.1816 a 0.1627 a -0.0456 -0.0064 0.2293 a 0.2592 a 0.0468 0.0638 (0.0656) (0.0604) (0.0692) (0.1152) (0.1175) (0.0547) (0.0557) (0.1220) (0.1241) (0.0795) (0.0822) (0.1117) (0.1079) ln(Cliquishnesst-2) 0.4486 a 0.2601 b 0.6310 b 0.3016 0.3026 0.1901 c 0.1884 c 0.6177 b 0.5906 b 0.2971 c 0.2889 c 0.0188 -0.0006 (0.1357) (0.1117) (0.3130) (0.2236) (0.2233) (0.1029) (0.1032) (0.2629) (0.2581) (0.1574) (0.1572) (0.3578) (0.3529) [ln(Cliquishnesst-2)]² -0.0174 a -0.0099 b -0.0247 b -0.0103 -0.0103 -0.0069 c -0.0069 c -0.0228 b -0.0217 b -0.0103 c -0.0100 -0.0009 -0.0002 (0.0054) (0.0044) (0.0122) (0.0089) (0.0089) (0.0041) (0.0041) (0.0103) (0.0101) (0.0062) (0.0062) (0.0138) (0.0136) BasicResearcht 0.0391 0.0770 b -0.0693 0.0615 0.0575 0.0394 0.0385 0.0127 -0.0071 -0.0697 -0.0670 -0.2801 a -0.2875 a (0.0471) (0.0329) (0.1727) (0.0621) (0.0628) (0.0321) (0.0321) (0.0734) (0.0754) (0.0461) (0.0461) (0.1083) (0.1081) NbLoopst-1 0.4463 a 0.0593 b 0.4294 a 2.5210 a 2.5289 a 0.3071 a 0.2903 a 1.9390 a 1.9881 a 0.2866 a 0.3121 a 0.9005 a 0.9386 a (0.0791) (0.0292) (0.0827) (0.2576) (0.2561) (0.0180) (0.0197) (0.2988) (0.2815) (0.0284) (0.0346) (0.2256) (0.2327) PastPatentingt-1 1.1049 a 0.8025 a 1.0932 a 1.4193 a 1.4283 a 0.9560 a 0.9261 a 1.2651 a 1.3062 a 1.0687 a 1.1105 a -0.0642 -0.0662 (0.0840) (0.0754) (0.0839) (0.1227) (0.1254) (0.0542) (0.0558) (0.1321) (0.1354) (0.0849) (0.0916) (0.1554) (0.1609) dNano -0.5255 -0.3027 -0.5549 -1.9439 a -1.9667 a -0.3079 -0.2944 -2.0197 a -2.1411 a -0.0058 -0.0308 -2.2236 a -2.1787 a (0.4256) (0.4241) (0.4531) (0.6305) (0.6284) (0.3871) (0.3870) (0.5778) (0.5527) (0.4734) (0.4739) (0.5330) (0.5415) dBio -0.3543 b -0.3716 a -0.3509 b -0.5001 b -0.4861 b -0.2021 c -0.2137 c -1.4029 a -1.3504 a -0.5075 a -0.4963 a -1.0040 a -0.9720 a (0.1647) (0.1356) (0.1620) (0.2302) (0.2314) (0.1138) (0.1140) (0.2761) (0.2786) (0.1856) (0.1858) (0.3600) (0.3531) ln(Contractst-1)Res 0.0360 -0.0899 b 0.1648 c 0.1373 (0.0350) (0.0425) (0.0997) (0.1065) ln(Contractt-1)Pred -0.0559 (0.0550) Univ dummies yes
yes yes yes yes yes yes yes yes yes yes yes yes Year dummies yes yes yes yes yes yes yes yes yes yes yes yes yes Constant -6.0681 a -4.1363 a -5.7661 a -3.5668 a -3.6130 a -7.3309 a -7.2433 a -5.4273 a -5.5903 a -5.2251 a -5.3479 a 0.6604 0.7670 (0.6429) (0.5697) (1.3011) (0.8637) (0.8601) (0.5228) (0.5244) (1.0488) (1.0343) (0.7252) (0.7344) (1.4147) (1.4104)
nbPatents nbClaims nbCitations nbreg xtnbreg zinb nbreg xtnbreg nbreg xtnbreg zinb Variable (1) (2) (3) (4) (5) (6) (7) (8) (9) (10) (11) (12) (13) endo endo
endo endo endo
ln(α) 1.4167 a 1.2542 a 4.0003 a 3.9980 a 3.4262 a 3.4201 a 2.1135 a 2.1024 a (0.1818) (0.1986) (0.0767) (0.0767) (0.1519) (0.1539) (0.1879) (0.1882) ln(r) 1.6178 a 2.0179 a 2.0190 a 0.5877 c 0.5889 c (0.1411) (0.6072) (0.6062) (0.3090) (0.3086) ln(s) -0.0589 6.5817 a 6.5803 a 1.6016 b 1.5986 b (0.1975) (0.6955) (0.6936) (0.6645) (0.6648) N 8786 8786 8786 8786 8769 8786 8769 8786 8769 8786 8769 8786 8772 N groups 1460 1460 1460 1460 1460 1460 1460 1460 1460 1460 1460 1460 1460 Avg years 6 6 6 6 6 6 6 6 6 6 6 6 6 Log Likelihood -2197.9 -2119.9 -2188.4 -4274.1 -4273.0 -4053.6 -4051.0 -1542.2 -1541.0 -1459.5 -1458.1 -1457.1 -1456.9 χ2 458.6 a 300.7 a 404.8 a 292.3 a 294.3 a 1194.4 a 1200.1 a 435.0 a 460.5 a 483.1 a 481.1 a 221.2 a 228.2 a Notes: a, b, and c represent a degree of significance at the 1%, 5% and 10% levels respectively. endo implies that the model tested includes the estimation of an endogenous
variable (Contracts) in a first stage regression presented in appendix B, in bold are identified the regressions for which there is endogeneity. Betweenness and Cliquishness are both multiplied by 104 to improve the uniformity of the order of the variables. dNano and dBio exclude nanobiotechnology, which is the omitted dummy variable.
6. Appendix A
Table 2: Elementary statistics and correlation table Variable N Mean S.D. nbP at ent st nbCl ai m st nbCi ta tions t ln (G ra nt st-1 ) ([ln (G ra nt st-1 )] ² ln (C on tr ac tst-1 ) ([ln (C on tr ac tts-1 )] ² pr opCom pone nt nbCom pone nt 80 Be tw ee nne ss t-2 ln (C liq uis hn es st-2 ) [ln (C liq uis hn es st-2 )] ² Ba si cRe se ar cht Nb Lo op st-1 Pas tPat en tin gt-1 Cum Loop t-2 Cum Cont 10t-2 dN ano dBi o Ag et (A get ) 2 Code Cha ir ln (C on tr ac ts Ut-1 ) nbPatentst 9068 0.096 (0.608) 1.00 nbClaimst 9068 1.743 (12.028) 0.82 1.00 nbCitationst 9068 0.127 (1.212) 0.62 0.60 1.00 ln(Grantst-1) 9062 10.375 (3.269) 0.01 0.01 0.00 1.00 [ln(Grantst-1)]² 9062 118.321 (44.668) 0.02 0.01 0.00 0.96 1.00 ln(Contractst-1) 9065 3.680 (4.959) 0.04 0.06 0.03 0.28 0.32 1.00 [ln(Contractst-1)]² 9065 38.131 (54.312) 0.05 0.07 0.03 0.27 0.33 0.98 1.00 propComponent 9068 73.690 (15.726) 0.02 0.01 0.01 0.03 0.04 0.03 0.03 1.00 nbComponent80 9068 55.866 (28.195) 0.06 0.05 0.06 -0.09 -0.12 0.01 0.01 -0.17 1.00 Betweennesst-2 8795 0.828 (0.907) 0.10 0.09 0.05 0.10 0.15 0.08 0.10 0.13 0.06 1.00 ln(Cliquishnesst-2) 8795 4.456 (6.057) -0.01 -0.01 0.00 -0.06 -0.08 -0.03 -0.03 -0.13 0.04 -0.25 1.00 [ln(Cliquishnesst-2)]² 8795 56.533 (153.377) -0.02 -0.02 0.00 -0.05 -0.07 -0.03 -0.03 -0.13 0.01 -0.29 1.00 1.00 BasicResearcht 9068 2.202 (1.643) 0.04 0.03 0.02 0.07 0.10 0.00 0.01 0.14 0.01 0.29 -0.09 -0.10 1.00 NbLoopst-1 9068 0.030 (0.306) 0.62 0.52 0.46 0.02 0.02 0.04 0.05 0.01 0.04 0.02 -0.02 -0.02 0.03 1.00 PastPatentingt-1 9068 0.326 (0.659) 0.21 0.20 0.13 0.11 0.15 0.12 0.13 0.08 -0.08 0.24 -0.10 -0.10 0.11 0.13 1.00 PastLoopt-2 9068 0.132 (0.648) 0.12 0.12 0.06 0.08 0.10 0.11 0.12 0.03 -0.06 0.09 -0.06 -0.05 0.06 0.18 0.45 1.00 PastContractst-2 9068 2.0E05 (1.6E06) 0.06 0.05 0.01 0.08 0.13 0.21 0.28 0.02 -0.05 0.09 -0.02 -0.02 0.02 0.01 0.12 0.05 1.00 dNano 9068 0.034 (0.182) -0.01 0.01 0.00 0.00 -0.01 -0.03 -0.03 -0.11 -0.01 -0.10 0.03 0.04 -0.08 0.02 -0.06 0.00 -0.01 1.00 dBio 9068 0.347 (0.476) -0.06 -0.06 -0.06 -0.06 -0.08 -0.01 -0.01 0.00 0.00 -0.22 0.05 0.06 -0.13 -0.04 -0.16 -0.09 -0.02 -0.14 1.00 Aget 9068 12.346 (4.458) 0.02 0.02 -0.01 0.29 0.33 0.13 0.13 0.09 -0.35 0.19 -0.07 -0.05 0.11 -0.01 0.24 0.12 0.11 -0.08 -0.12 1.00 (Aget)2 9068 172.289 (109.021) 0.01 0.01 -0.02 0.27 0.31 0.12 0.12 0.09 -0.39 0.17 -0.07 -0.05 0.10 -0.01 0.24 0.13 0.12 -0.07 -0.11 0.98 1.00 CodeChair 9068 0.590 (0.855) 0.01 0.00 0.02 0.18 0.22 0.15 0.15 0.00 0.03 0.08 -0.02 -0.02 0.06 0.00 0.08 0.03 0.01 -0.03 -0.10 0.09 0.09 1.00 ln(ContractsUt-1) 9051 9.984 (1.779) 0.00 0.00 -0.01 0.45 0.41 0.20 0.19 0.02 -0.03 -0.04 -0.02 0.00 -0.02 0.01 0.07 0.05 0.05 -0.01 0.00 0.14 0.13 0.10 1.00 Notes: Betweenness and Cliquishness are both multiplied by 104 to improve the uniformity of the order of the variables.7. Appendix B
Table 3: First stage and inflate (zinb) regressions on the natural log of the average amount of contracts First Stage - NbClaims First stage - NbCitations inflate - NbPatents inflate - NbCitations reg xtreg reg xtreg logit probit probit Variable I.V. (5) (7) (9) (11) (3) (12) (13) endo ln(ContractsUt-1) x 0.0914 b 0.0595 c 0.0914 b 0.0595 c (0.0356) (0.0311) (0.0356) (0.0311)PastLoopt-1 x 0.4777 a 0.2169 a
0.4777 a 0.2169 a (0.1369) (0.0838) (0.1369) (0.0838)
ln(PastContractst-1) x 4.58E-07 2.18E-07 a
4.58E-07 2.18E-07 a 2.81E-07 3.08E-08 2.81E-07 3.08E-08 CodeChair x 0.2306 c 0.3760 a 0.2306 c 0.3760 a (0.1386) (0.1139) (0.1386) (0.1139) Aget x 0.1703 b 0.2398 a 0.1703 b 0.2398 a (0.0769) (0.0489) (0.0769) (0.0489) (Aget)² x -0.0068 b -0.0070 a -0.0068 b -0.0070 a (0.0035) (0.0019) (0.0035) (0.0019)
ln(Grantst-1) -0.5368 a -0.2557 a -0.5368 a -0.2557 a -0.1723 -0.0534 -0.0569
(0.0775) (0.0494) (0.0775) (0.0494) (0.1103) (0.0718) (0.0720) [ln(Grantst-1)]² 0.0674 a 0.0361 a 0.0674 a 0.0361 a 0.0013 0.0017 (0.0067) (0.0040) (0.0067) (0.0040) (0.0056) (0.0056) propComponent 0.0032 0.0033 0.0032 0.0033 (0.0041) (0.0026) (0.0041) (0.0026) nbComponent80 0.0067 -0.0319 a (0.0042) (0.0062) Betweennesst-2 0.1539 0.1385 b 0.1539 0.1385 b (0.1159) (0.0651) (0.1159) (0.0651) ln(Cliquishnesst-2) -0.0115 -0.0360 -0.0115 -0.0360 1.4061 -0.4233 b -0.4275 b (0.1657) (0.0935) (0.1657) (0.0935) (2.4543) (0.1699) (0.1679) [ln(Cliquishnesst-2)]² 0.0007 0.0014 0.0007 0.0014 -0.0563 0.0158 b 0.0160 b (0.0066) (0.0037) (0.0066) (0.0037) (0.0964) (0.0066) (0.0065) BasicResearcht-1 -0.1231 a 0.0044 -0.1231 a 0.0044 -1.0587 c -0.1177 b -0.1166 b (0.0347) (0.0234) (0.0347) (0.0234) (0.5511) (0.0548) (0.0547) NbLoopst-1 0.2846 0.2123 0.2846 0.2123
(0.2902) (0.1365) (0.2902) (0.1365) PastPatentingt-1 0.0704 0.1214 0.0704 0.1214 -1.1885 a -1.1873 a (0.1693) (0.1032) (0.1693) (0.1032) (0.1421) (0.1420) dNano -0.4107 0.0747 -0.4107 0.0747 -0.5173 -0.4729 (0.5802) (0.5073) (0.5802) (0.5073) (0.3878) (0.3896) dBio 0.3476 0.1951 0.3476 0.1951 0.0827 0.0865 (0.2280) (0.1951) (0.2280) (0.1951) (0.1840) (0.1817)
Univ dummies yes yes yes yes yes yes yes
Year dummies yes yes yes yes yes yes yes
Constant
-3.0483 a 0.0000 -2.4927 a -2.6503 a -2.2574 3.1887 a 3.1937 a
(0.7321) (0.0000) (0.6942) (0.5155) (7.4843) (0.5276) (0.5201) N 8769 8769 8769 8769 8786 8786 8772 N groups 1460 1460 1460 1460 1460 1460 1460 Avg years 6 6 6 6 6 6 6 Log Likelihood -25588.1 -25588.1 -2186.6 -1457.1 -1456.9 χ2
2258.9 a 933.2 a 404.4 a 221.2 a 228.2 a