HAL Id: hal-01300399
https://hal.archives-ouvertes.fr/hal-01300399v2
Submitted on 16 Nov 2016
HAL is a multi-disciplinary open access
archive for the deposit and dissemination of
sci-entific research documents, whether they are
pub-lished or not. The documents may come from
teaching and research institutions in France or
abroad, or from public or private research centers.
L’archive ouverte pluridisciplinaire HAL, est
destinée au dépôt et à la diffusion de documents
scientifiques de niveau recherche, publiés ou non,
émanant des établissements d’enseignement et de
recherche français ou étrangers, des laboratoires
publics ou privés.
To cite this version:
Grégoire Lafay, Nicolas Misdariis, Mathieu Lagrange, Mathias Rossignol. Semantic browsing of sound
databases without keywords. Journal of the Audio Engineering Society, Audio Engineering Society,
2016, 64 (9), pp.628-635. �hal-01300399v2�
Semantic browsing of sound databases
without keywords
Gr ´egoire Lafay1, Nicolas Misdariis2, Mathieu Lagrange1, Mathias Rossignol2
(gregoire.lafay@irccyn.ec-nantes.fr)
IRCCyN, Ecole Centrale de Nantes1 STMS Ircam-CNRS-UPMC2
In this paper, we study the relevance of a semantic or-ganization of sounds to ease the browsing of a sound database. For such a task, semantic access to data is tra-ditionally implemented by a keyword selection process. However, various limitations of written language, such as word polysemy, ambiguities, or translation issues, may bias the browsing process.
We present and study the efficiency of two sound pre-sentation strategies that organize sounds spatially so as to reflect an underlying semantic hierarchy. For the sake of comparison, we also consider a display whose spatial or-ganization is only based on acoustic cues. Those three dis-plays are evaluated in terms of search speed in a crowd-sourcing experiment using two different corpora: the first is composed of environmental sounds from urban envi-ronments and the second of sounds produced by musical instruments. Coherent results achieved by considering the two different corpora demonstrate the usefulness of using an implicit semantic organization to display sounds, both in terms of search speed and of learning efficiency. Audio content management and display, Semantic sound data mining
0 Introduction
With the growing capability of recording and storage devices, the problem of indexing large audio databases has recently been the object of much attention [22]. Most of that effort is dedicated to the automatic inference of indexing metadata from the actual audio recording [23, 21]; in contrast, the ability to browse such databases in an effective manner has been less considered.
Thus, most media asset management systems are based on keyword-driven queries. The user enters a word which best characterizes the desired item, and the interface presents him with items related to this word. The effectiveness of this principle is primarily based on the
typological structure and nomenclature of the database. However, for sound databases, several issues arise: 1. Sounds, as many others things, can be described in
many ways. Environmental sounds in particular may be designated by their source (a car door), the action of that source (the slamming of a car door) or their en-vironment (slamming a car door in a garage) [8, 13, 2]. Designing an effective keyword-based search system re-quires an accurate description of each sound, which has to be suited to the sound representation of the user to be effective.
2. Pre-defined verbal descriptions of the sounds made available to the users may potentially bias their brows-ing and final selection.
3. Localization of the query interface is made difficult as the translation of some words referring to qualitative as-pects of the sound, such as its ambiance, is notoriously ambiguous and subject to cultural specificities.
4. Unless considerable time and resources are invested into developing a multilingual interface, any system based on verbal descriptions can only be used with re-duced performance by non-native speakers of the cho-sen language.
To circumvent those issues, not relying on keywords is desirable. However, conveying semantics remains a necessity for ease of browsing, which raises the question of what alternate means, other than written language, can be used to that end.
We thus consider in this paper three means of displaying sounds without relying on any textual representation, all based on a spatial organization of sounds. The first one, considered as a reference baseline, does not rely on any semantic information and positions sounds according to their acoustical properties (time averaged spectral features). The second and third displays exhibit a spatial organization based on a predefined
Their effectiveness is studied through a search-based task whose aim is to find a given target sound by browsing the database using the display under evaluation. Two corpora are considered for this study: the first one is composed of sounds recorded in a urban environment, and the second of sounds produced by musical instruments.
The paper is organized as follows: in Section 1, previous work on the topic of sound database browsing is reviewed. The two corpora used in this study are then introduced in Section 2. The three displays under evaluation are next described in Section 3, and the crowdsourcing test used to compare them using the two different corpora is presented in Section 4. The outcomes of those experiments are discussed in Sections 5 and 6. 1 Previous work
Most of the research effort in the sound design and Music Information Retrieval (MIR) communities is focused on acoustical based indexing and browsing [20, 19, 7, 16]. Typically, the items (sound effects or pieces of music) are modeled by processing the digital audio waveform through some signal processing pipeline in order to get a compact description of each item [5], with sometimes additional textual features. Then, statistical projections or embedding techniques, like Principal Components Analysis (PCA) [12], Multi Dimensional Scaling (MDS) [17, 4], Self Organizing Maps (SOM) [14, 15, 9] and the like are used to project the items in a two or three dimensional space while preserving as much as possible the distances among them. One of the advantages of such an approach is its ability to scale to very large databases [18] as it does not need any kind of manual annotation and allows the user to search by similarity efficiently according to acoustical properties.
However, acoustical models are inherently subject to observation noise and biases. Selecting the most relevant features to achieve the correct projection of the data may only be performed by an expert user, taking into account the specifities of the data. If done a priori by an expert or by some above cited dimensionality reduction technique, the induced bias can strongly limit the users’ ability to access what they search for. In that respect, semantic tags, if available, have the advantage of implicitly structuring the similarity space, thus possibly easing the browsing process even if the actual tags are not – as in this study – explicitly exposed to the user.
2 Datasets
The datasets considered in this study are respectively composed of 149 urban environmental sound events and 137 sounds produced by musical instruments.
In the first corpus, a sound is characterized by a tag describing the physical source of the sound (man-yelling, car-passing). Sounds are then hierarchically grouped into classes according to their tags (car > car-passing; car >
Traffic Truck passingTruck
Truck starting car
Human voice
Fig. 1. Semantic hierarchical structure of the dataset of urban environmental sounds.
Traffic
Truck
Truck starting
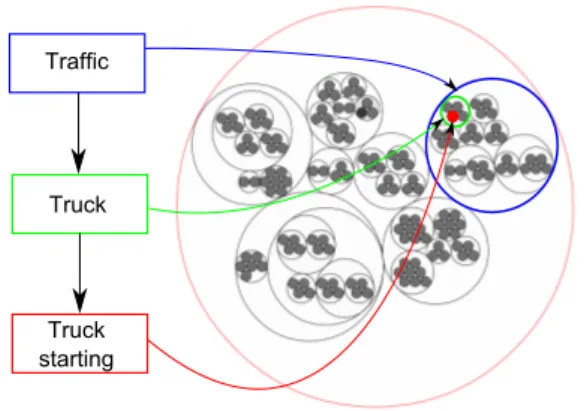
Fig. 2. Semantic displays are based on the semantic hierarchical structure of the dataset.
car-starting). Those classes are in turn packed into classes until high level classes describing broader concepts are reached (traffic > car > car-passing). The sound dataset is thus organized into a hierarchical structure of semantic classes as described in Figure 1, where the sound samples of the dataset are the leaf semantic levels. All the other classes are represented by a prototype sound that best characterizes the sounds belonging to the class.
In order for the semantic hierarchical structure to be perceptually valid, the tags that describe the classes are chosen from sound categories presented in studies addressing environmental auditory scenes perception [13, 2, 6]. In cognitive psychology, sound categories may be regarded as intermediaries between collective sound representations and individual sensory experiences [6]. It is our belief that using such category names to build the hierarchical structure makes it perceptually motivated, and can thus help the users to efficiently browse the dataset.
Similarly, the second corpus also has a semantic organization: high and mid level classes categorize musical instruments according to the means by which sound is produced, while leaf level classes are related to specific instruments (string > plucked-string > viola;
Fig. 3. Acoustical Display for the urban sound dataset (AD). Colors and legend are removed during the experiment.
3 Displays
The aim of the displays described in this section is to allow the user to efficiently browse the sound datasets without any written textual help. In all displays, each sound is graphically represented by a filled circle which, once clicked, plays the actual sound. The spatial organization of circles is specific to each display.
As a reference, an Acoustic Display (AD) provides a spatial representation based on acoustic descriptors. Each sound is described by time-averaged Mel-Frequency Cepstrum Coefficients (MFCCs) computed with standard parameter settings (13 lowest quefrency coefficients are kept out of 40). The Euclidean distance between time averaged features is then computed for each sound pair. A non metric multidimensional scaling (MDS) with
Kruskal’s normalized stress [11] is then employed to project the data into two dimensions according to this distance, as shown on Figures 3 and 4. The latter exhibit a clear distinction between percussive (left) and sustained sounds (right).
Among the several alternatives that exists, MFCCs features are chosen as they are widely used in the audio processing community. MDS is selected for 2D projection as it has a lower sensitivity to outliers than the PCA and do not relyi on any parameter optimization, unlike the SOM approach.
Two semantically oriented displays are then proposed, called Full Semantic Display (FSD) and Progressive Semantic Display (PSD). Both display consider the hierarchical structure of the dataset to organize sounds. Each sound class is represented by a filled circle. Circles are then packed together according to the hierarchical semantic organization of the dataset, as shown in Figure 2.
Fig. 4. Acoustical Display for the musical sound dataset (AD). Colors and legend are removed during the experiment.
Thus, subclasses belonging to the same class are close to each others. Circle packing functions of the D3.js
(Data-Driven Documents) javascript library [1] are used to distribute the sound classes in the space. Depending on the display, the user can either access each leaf class directly (FSD), or has to click through intermediate levels of the hierarchy (PSD).
More precisely, with the FSD display, users can directly visualize the whole hierarchy, down to the leaf classes, while with the PSD display, users only have access, at first, to the intermediate semantic levels of the hierarchy. Upon first using PSD, they observe circles representing the top classes of the semantic hierarchical structure of the dataset. When users click on a circle, they hear the sound prototype of the class and the subclasses are progressively revealed, represented by white circles contained in the circle that has just been clicked. The same action is repeated until the user reaches the leaf classes of the hierarchy. The leaf classes are represented with small gray circles, indicating that there is no subclass to uncover. Thus the PSD has a constrained exploration system. Each time a sub-circle is automatically revealed, its sound prototype is played. Users may stop the discovery process by clicking on an other circle. In this display, the leaf classes are distributed in the same manner as FSD. Thus, the spatial configuration of the unfolded version of PSD, which may be obtained after discovering all the classes and subclasses, is identical to the one of FSD.
4.1 Objective
During this experiment, the three displays are compared using two corpora: the urban sound corpus and the musical sound corpus. By comparing AD and xSD (the two semantic displays), the goal is to evaluate the relative efficiencies of semantic based and acoustic based spatial configurations. By comparing FSD and PSD, we study the impact of an enforced hierarchical exploration of the corpus by the user. The goal is to check if constraining the user to first browse the high levels of the hierarchy helps him to grasp and memorize the spatial configuration and the organization of the sound classes.
4.2 Experimental protocol
We evaluate and compare those three displays with a
crowdsourcing web-based experiment1for which we
adopt a between subject approach, i.e. a subject can only test one display. In this experiment, subjects are asked to successively retrieve 13 target sounds among the whole dataset. The target sounds are selected such that there are at least two target sounds in each top-level class of the semantic hierarchical structure of the dataset. To reduce order effects, target sounds are presented to each subject in a random order.
First, the subject clicks a button to listen to the target sound. They may then replay the target sound as many times as they like, even while browsing. A timer starts when the subject clicks on a circle for the first time. When the target sound is found, the subject puts an end to the search by clicking on the Click if found button. This action 1) stops the timer and 2) loads a new target sound. If the subject designates an incorrect sound, an error message appears, and the experiment goes on with the same target sound.
The experiment ends when all the target sounds have been found. An important feature of the PSD display is that it is not reinitialized at each change of target sound. Thus, when a circle is unfolded, its content remains visible during the whole experiment.
4.3 Data Collection
Four types of data are collected during the experiment: r the absolute duration, which is the total duration of the
entire experiment, including breaks between two target sound searches;
r the duration of each search. The sum of the 13 search du-rations, which is the absolute duration minus the break times between two target sound searches, is called the total search duration;
1The tests are available at http://soundthings.
org/research/speedSoundFinding/index.html and http://soundthings.org/research/ speedSoundFindingMusic/index.html, each of the 3 displays is also available by appending a digit from 1 to 3 to index in the above cited url.
r the time at which each sound has been heard. 4.4 Apparatus
A crowdsourcing approach is adopted. Subjects are recruited using research mailing list and are only allowed to perform the experiment once, and on one interface only. All sounds of the dataset are normalized to the same root mean square (RMS) level.
4.5 Participants
60 subjects have completed the experiment for the urban sound dataset, 20 for each interface. 48 subjects have completed the experiment for the urban sound dataset: 17 for the PSD interface, 16 for the FSD interface and 15 for the AD interface.
4.6 Outliers Detection
Outlier detection is an important step of any crowdsourcing experiment as experimenters do not control the environment in which the subjects perform the experiment [10, 3]. A commonly used method to detect outliers in human-computer interaction studies is to consider as outlier an observation which deviates of at least ±2 standard deviation from the average [10]. However, as this latter method is not robust to the presence of isolated extreme observations (as it is often the case for crowdsourcing experiment), we follow the method proposed by [10] and use the Inter-Quartile Range (IQR). With this approach, an observation is considered to be an outlier if its value is more than 3 ∗ IQR higher than the third quartile or more than 3 ∗ IQR less than the first quartile. This methods is applied in this study to the four following criteria :
1. the absolute duration: to detect subjects who took ab-normally long breaks between searches;
2. the total search duration: to detect subjects who spent an abnormally long time to complete the experiment; 3. number of heard sounds: to detect subjects who had to
hear an abnormally high number of sounds to complete the experiment;
4. the maximum number of times a target sound had to be heard before being found: to detect subjects who had difficulty to recognize the target sounds.
4.7 Statistical analysis
We use one-way ANOVA to test for statistical significance. Post hoc analyses are done using two samples t tests with Bonferroni correction. All statistical analyses are performed at the 5% significance level. 5 Results on Urban Sounds
5.1 Outliers
Using the IQR method, 5 subjects are detected as outliers for the urban experiment, and removed from the
AD FSD PSD Duration (sec) 200 400 600 800 1000 1200 a AD FSD PSD Duration (sec) 200 400 600 800 1000 1200 d AD FSD PSD Heard sounds 200 300 400 500 600 700 800 b AD FSD PSD Heard sounds 200 300 400 500 600 700 800 e AD FSD PSD
Unique heard sounds
100 110 120 130 140 150 c AD FSD PSD
Unique heard sounds
100 110 120 130 140 150 f
Fig. 5. Average and standard deviation for (a,d) the total search durations, (b,e) the number of heard sounds and (c,f) the num-ber of unique heard sounds; considering respectively the urban dataset (a,b,c) and the music dataset (d,e,f).
analysis. 2 of those subjects used PSD and 3 used AD. 3 subjects are detected by considering the absolute duration; they spent respectively 50 minutes, 5 hours and 17.5 hours to complete the experiment. One subject is detected by considering the total search duration (46 minutes), and another by observing the total number of
heard sounds(1800 heard sounds, roughly 12 times the
total size of the corpus). Lastly, 2 subjects are detected by observing the maximum number of times they had to hear a target sound before finding it (4 and 8 times). It should be noted that some subjects met several of the criteria.
1 2 3 4 5 6 7 8 9 10 11 12 13 Duration (sec) 0 25 50 75 100 125 150 a AD FSD PSD 1 2 3 4 5 6 7 8 9 10 11 12 13 Heard sounds 0 20 40 60 80 b search index 1 2 3 4 5 6 7 8 9 10 11 12 13
Unique heard sounds WD
0 20 40 60
c
Fig. 6. Evolution of (a) the average search durations, (b) the av-erage numbers of heard sounds, and (c) the avav-erage numbers of unique heard sounds at each target sound search, considering the urban dataset. Lines are linear regression fits.
5.2 Efficiency
To study the relative efficiency of the three displays, three metrics are considered:
r the total search duration,
r the number of heard sounds during the whole experi-ment,
r the number of unique sounds heard during the whole ex-periment. By ”unique” we mean that, if a same sound is heard 10 times during the 13 searches of the experiment, it counts only for one.
The first two metrics quantify the notion of efficiency by considering the time and the number of clicks needed to achieve the task, ie. reach the target. The goal for those values is to be as low as possible. The third data allows us to measure the selectivity of the interfaces. A low number
1 2 3 4 5 6 7 8 9 10 11 12 13 Duration (sec) 0 25 50 75 100 125 FSD PSD 1 2 3 4 5 6 7 8 9 10 11 12 13 Heard sounds 0 20 40 60 80 b search index 1 2 3 4 5 6 7 8 9 10 11 12 13
Unique heard sounds WD
0 20 40 60
c
Fig. 7. Evolution of (a) the average search durations, (b) the av-erage numbers of heard sounds, and (c) the avav-erage numbers of unique heard sounds at each target sound search, considering the music dataset. Lines are linear regression fits.
of unique heard sounds indicates that subjects understood the spatial organisation of the dataset, and used this knowledge to improve their searches. On the contrary, a high number of heard sounds without duplication suggests that the subject did not understand the way sounds are organized in space, and tended to play all the sounds at each search. The maximum number of unique heard sounds is the corpus size: 149 sounds.
The averages and standard deviations for the three metrics are presented in Figure 5. The type of display has a significant effect on the the total search duration (F[2, 52] = 4; p < 0.05), the number of heard sounds (F[2, 52] = 6; p < 0.01) and the number of unique heard sounds (F[2, 52] = 9; p < 0.01).
Post hoc analysis on the total search duration
(Figure 5.a) shows no significant differences between the three interfaces (PSD-FSD: p = 0.09; PSD-AD: p = 1;
Concerning the numbers of heard sounds (Figure 5.b), FSD significantly outperforms the AD interface
(FSD-AD: p < 0.01), whereas PSD and FSD as well as PSD and AD show similar outcomes (PSD-FSD:
p= 0.06; PSD-AD: p = 1).
Figure 5.c shows the results for the number of unique heard sounds. This time the results of AD are significantly higher (indicating an inferior performance) than those of both PSD and FSD (PSD-AD: p < 0.01; FSD-AD:
p< 0.01). For AD, 75% of the subjects heard more than
140 sounds, and 25% heard at least 148 sounds, that is almost the entire database. Considering PSD, 75% of the subjects heard less than 134 sounds, versus 143 for FSD. This time PSD and FSD perform equivalently (PSD-FSD:
p= 1).
According to those results, a spatial display following a hierarchical organization of the dataset based on semantic values (PSD and FSD) is more efficient than an
organization based on acoustic descriptors (AD) as it allows the users to quickly apprehend the dataset range and thus to specify their search. Furthermore the FSD interface allows the users to retrieve the 13 target sounds by listening to a smaller amount of sounds than the AD. However, those two effects are significantly compromised when users have to parse the entire hierarchy to reach the first target sound, as in the PSD display. It seems that enforcing an explicit exploration of the hierarchy disturbs or confuses the user instead of allowing him to learn the semantically motivated spatial organization of the classes.
5.3 Learning
We now study if and how users progressively acquire knowledge about the spatial organization of the classes. To do that, the evolution of the above described metrics with respect to the search indexes is considered. Three sets of collected data are used:
r the duration of each target sound search,
r the number of heard sounds for each target sound search, r the number of unique heard sounds for each target sound
search.
Figure 6.a shows the evolution of the average duration of each target sound search observed for AD, FSD and PSD. As shown by a linear regression of the data, there is an overall increase of efficiency with respect to the index of the search. For the duration and the number of heard sounds (Figure 6.b), AD and PSD perform equivalently, whereas FSD exhibits better performance. In the case of the number of unique heard sounds (Figure 6.c), the two semantic displays are equivalent. This latter result
suggests that for both semantic displays, users have parsed the same range of the dataset, although users of FSD have done so by listening to fewer sounds and more quickly.
6 Results on Musical Sounds 6.1 Outliers
2 subjects are detected as outliers for the music experiment and removed from the analysis. 1 subject used PSD and 1 subject used FSD. The first outlier is detected by considering the absolute duration (5 hours to complete the experiment) and the second by looking at the absolute
duration(1 hour and 30 minutes) as well as the total
search duration(1 hour and 15 minutes) and the total
number of heard sounds(901).
6.2 Efficiency
The averages and standard deviations for the three metrics are presented in Figure 5. The type of display has a significant effect on the the total search duration (F[2, 43] = 13; p < 0.01), the number of heard sounds (F[2, 43] = 14; p < 0.01) and the number of unique heard sounds (F[2, 43] = 5; p < 0.05).
Considering the total search duration (Figure 5.d), post hoc analyses shows that PSD and FSD perform better than the AD interfaces (PSD-AD: p < 0.01; FSD-AD:
p< 0.01;). No significant difference is found between
PSD and FSD (PSD-FSD: p = 0.20).
Figure 5.e shows the results for the numbers of heard sounds. This time AD and PSD exhibit similar results (PSD-AD: p = 0.19), while being both outperformed by FSD (FSD-PSD: p < 0.01; FSD-AD: p < 0.01).
Considering the numbers of unique heard sounds (Figure 5.f), FSD significantly outperforms the AD interface (FSD-AD: p < 0.05), while both PSD vs. FSD and PSD vs. AD show similar outcomes (PSD-FSD:
p= 0.06; PSD-AD: p = 1). Those results confirms the
trends observed for the urban sounds (see Section 5): r A semantic organization of the dataset significantly
re-duces the number of heard sounds needed to find a target sound.
r Forcing the users to parse the entire hierarchical organi-zation of the dataset seems to diminish the interface effi-ciency by increasing the number of sounds to be listened to.
PSD and FSD significantly reduce the search durations compared to an acoustic organization (AD), which was not the case for the urban sound dataset. This may be explained by the fact that the musical corpus has perhaps a more obvious semantic organization.
6.3 Learning
Figure 7 shows the evolution of the metrics with respect to the target sound index. Results for the music dataset are similar to those observed for the urban dataset. An overall increase of efficiency with respect to the index of the search is observed for the tree interfaces. For the duration and the number of heard sounds (Figure 7.a and .b) the FSD interface exhibits better performance. Considering the number of unique heard sounds (Figure 7.c), the
learning of the dataset range seems to be quicker for the FSD interface than for the PSD interface. Once again, results show that enforcing the parsing of the hierarchy is not beneficial.
7 Conclusion
In this paper, two displays allowing users to explore a semantically organized sound dataset without written textual help are presented. The interfaces distribute sounds represented by circles on a 2D space, following an underlying hierarchical semantic organization. Those two semantic displays are assessed and compared to a third display in which the spatial configuration depends upon acoustic features. The tests consists in data retrieval tasks done using two different corpora. The Full Semantic Display (FSD), that allows users to directly visualize the leaf classes of the semantic hierarchical structure, proves to be the most effective interface for the task. This display has been integrated as a sound selector into a acoustic scene simulator that benefit from the advantages of such an approach: no need of localization and reduction of the
potential bias of using description tags2.
Two main conclusions may be derived from this experiment. First, a spatial configuration based on semantic features is more effective to retrieve target sounds than a spatial configuration based on acoustic features. Second, imposing the exploration of the semantic hierarchical structure by constraining its visibility does not help the user understand and learn the spatial configuration of the semantic class, but instead disturbs the navigation.
In the datasets considered in this study, there are as many leaf classes as sounds in the dataset, which would be unrealistic for larger datasets. In that case, the
organization can easily be adapted by considering the leaf classes as collections of semantically similar sound samples. Thus, two sounds of male-yelling would be grouped into a single leaf class with the tag male-yelling. The leaf class would then also have a prototype sound being the most representative item of the different
male-yellingsounds belonging to the leaf class.
8 Acknowledgements
Research project partly funded by ANR-11-JS03-005-01.
9 REFERENCES
[1] M. Bostock, V. Ogievetsky, and J. Heer. D3: Data-driven documents. IEEE Trans. Visualization & Comp. Graphics (Proc. InfoVis), 2011.
[2] A. Brown, J. Kang, and T. Gjestland. Towards stan-dardization in soundscape preference assessment. Applied Acoustics, 72(6):387–392, 2011.
2http://soundthings.org/research/
pages 3053–3056, 2011.
[4] P. Cano, M. Kaltenbrunner, F. Gouyon, and E. Batlle. On the Use of FastMap for Audio Retrieval and Browsing. ISMIR, 2002.
[5] G. Coleman. Mused: Navigating the personal sample library. Proc. ICMC, Copenhagen, Denmark, 2007.
[6] D. Dubois, C. Guastavino, and M. Raimbault. A cog-nitive approach to urban soundscapes: Using verbal data to access everyday life auditory categories. Acta Acustica united with Acustica, 92(6):865–874, 2006.
[7] M. Goto and T. Goto. Musicream: New music play-back interface for streaming, sticking, sorting, and recall-ing musical pieces. In ISMIR, pages 404–411, 2005.
[8] O. Houix, G. Lemaitre, N. Misdariis, P. Susini, and I. Urdapilleta. A lexical analysis of environmental sound categories. Journal of Experimental Psychology: Applied, 18(1):52, 2012.
[9] P. Knees, M. Schedl, T. Pohle, and G. Widmer. An innovative three-dimensional user interface for exploring music collections enriched. In Proceedings of the 14th an-nual ACM international conference on Multimedia, pages 17–24. ACM, 2006.
[10] S. Komarov, K. Reinecke, and K. Z. Gajos. Crowd-sourcing performance evaluations of user interfaces. In Proceedings of the SIGCHI Conference on Human Factors in Computing Systems, pages 207–216. ACM, 2013.
[11] J. B. Kruskal. Multidimensional scaling by opti-mizing goodness of fit to a nonmetric hypothesis. Psy-chometrika, 29(1):1–27, 1964.
[12] A. S. Lillie. MusicBox: Navigating the space of your music. Master’s thesis, Massachusetts Institute of Technology, MA, 2008.
[13] M. Niessen, C. Cance, and D. Dubois. Categories for soundscape: toward a hybrid classification. In
INTER-Noise Control Engineering, 2010.
[14] E. Pampalk, S. Dixon, and G. Widmer. Exploring music collections by browsing different views. Computer Music Journal, 28(2):49–62, 2004.
[15] E. Pampalk and M. Goto. Musicrainbow: A new user interface to discover artists using audio-based simi-larity and web-based labeling. In ISMIR, pages 367–370. Citeseer, 2006.
[16] E. Pampalk and M. Goto. Musicsun: A new ap-proach to artist recommendation. In ISMIR, pages 101– 104, 2007.
[17] D. Schwarz and N. Schnell. Sound search by content-based navigation in large databases. In Sound and Music Computing (SMC), pages 1–1, 2009.
[18] D. Schwarz, N. Schnell, and S. Gulluni. Scalability in content-based navigation of sound databases. In Inter-national Computer Music Conference (ICMC), pages 1–1, 2009.
[19] S. Streich and B. S. Ong. A music loop explorer system. In Proceedings of the International Computer Mu-sic Conference (ICMC), Belfast, Northern Ireland, 2008.
[20] G. Tzanetakis. Musescape: An interactive content-aware music browser. In Proc. Conference on Digital Au-dio Effects (DAFX), 2003.
[21] G. Tzanetakis and P. Cook. Musical genre classi-fication of audio signals. Speech and Audio Processing, IEEE transactions on, 10(5):293–302, 2002.
[22] E. Wold, T. Blum, D. Keislar, and J. Wheaten. Con-tent based retrieval of audio. IEEE Multimedia, 1996.
[23] T. Zhang and C. Kuo. Hierarchical classification of audio data for archiving and retrieving. IEEE Transactions on Acoustics, Speech, and Signal Processing, pages 1–4, 1999.