1. Panel discussion: “Postoperative pain management” 20 minutes presentation + 30 minutes discussion
Goals, practice, and audit of Postoperative pain management Introduction
Goals and practice: Assure safety to all patients, audit and monitor results and implementation of improvement
- Safety: APS inception , postoperative pain management for all patients
o Assessment of pain intensity, side effects, complication and satisfaction o Basic regimen for all patients: paracetamol + NSAIDs + Morphine if
VAS>3cm
o Specific analgesic techniques for selected patients (PCA, epidural, nerve blocs) o Development of non pharmacological techniques such as cold, warmth, TENS,
relaxation, music…
- Audit: APS supervision, collect and analyse data of basic regimens
- Improvement: development of analgesic techniques in surgical units in a safety manner
Method
- APS inception and CQI implementation
- A step by step intervention: 3 phases of measure and actions - Audit of analgesic techniques
Results
- 3 surveys : An interventional study
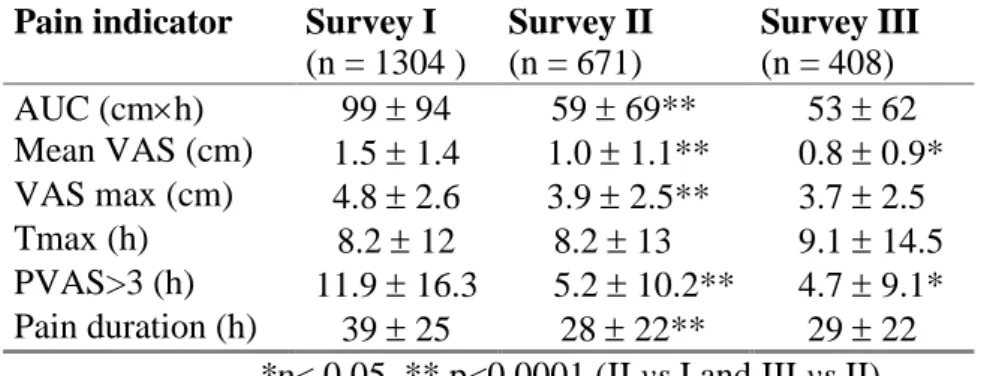
1. Table 1: Comparison of pain indicators between surveys I, II, III
Pain indicator Survey I (n = 1304 ) Survey II (n = 671) Survey III (n = 408) AUC (cmh) 99 94 59 69** 53 62 Mean VAS (cm) 1.5 1.4 1.0 1.1** 0.8 0.9* VAS max (cm) 4.8 2.6 3.9 2.5** 3.7 2.5 Tmax (h) 8.2 12 8.2 13 9.1 14.5 PVAS>3 (h) 11.9 16.3 5.2 10.2** 4.7 9.1* Pain duration (h) 39 25 28 22** 29 22
*p< 0.05, ** p<0.0001 (II vs I and III vs II)
Table 2. Comparison of analgesic consumption between surveys I, II, III
Drug Survey I Survey II Survey III Paracetamol (g) 5.34.0 9.76.2** 15.37.4**
Morphine (mg) 1423 1123* 1331
NSAIDs (%) 20 % 64 %** 99%**
p< 0.05, ** p<0.0001 (II vs I and II vs III)
- comparison of results 2002 versus results 2003 for analgesic techniques in abdominal surgery: VAS, side effects, complications and satisfaction
2002 (n/%) 2003 (n/%)
n 134 (100) 137 (100)
Female 69 (51.9) 76
Male 64 (48.1) 61
Age 5817 yrs 6015 yrs
PCA 46 (34.3) 33 (24.1) peri 42 (31.3) 75(54.7) Rachi M+ 13 (9.7) 25(18.3) PCA + Rachi M+ 6 (4.5) 4 (2.9) PCA + peri 27 (20.1) 0 VAS <3 cm 22 (91.7) 129 (94.2) VAS 3 cm 2 (8.3) 8 (5.8) PONV <4 cm 105 (93.7) 94 (89.5) PONV 4 cm 7 (6.3) 11 (10.5) Vomiting episode 5 (4.5) 10 (9.6)
None vomiting episode 106 (95.5) 94 (90.4)
Prurit yes 8 (7.1) 9 (8.6)
Prurit no 104 (92.9) 70 (91.4)
Respiratory depression 10/min 2 (1.8) 5 (4.8)
No sedation 65 (58) 70 (66.7)
Light 42 (37.5) 32(30.5)
Moderate 5 (4.5) 3 (2.8)
Urinary retention yes 2 (1.8) 4 (3.8)
Haemorrhage 0 0 Headache 0 0 Very dissatisfied 0 1 (0.8) Dissatisfied 3 (2.6) 11 (9.3) Satisfied 36 (31) 50(42) Very satisfied 77(66.4) 57(47.9) Discussion
1: assess pain and make pain visible 2: organise an APS
3: provide safe analgesia to all patients
4: develop analgesic techniques in surgical units 5: audit results