J. Mater. Environ. Sci., 2018, Volume 9, Issue 3, Page 879-886 https://doi.org/10.26872/jmes.2018.9.3.97 !
http://www.jmaterenvironsci.com
!
Journal(of(Materials(and(( Environmental(Sciences( ISSN(:(2028;2508( CODEN(:(JMESCN( Copyright(©(2018,( University(of(Mohammed(Premier(((((( (Oujda(MoroccoPhysicochemical Properties of some Honeys Produced from Different Flora of
Eastern Morocco
A. Abselami
1*, A. Tahani
1, M. Sindic
2, M.L. Fauconnier
3, E. Bruneau
4, A. Elbachiri
11. Laboratory of physical chemistry of the natural resources and environment,!Department of Chemistry, Faculty of Science, University Mohammed I,!BP 717, Avenue Mohamed VI, Oujda,!60000, Morocco.
2. Laboratory of Agro-food Quality and Safety, Faculty of the Agronomic Sciences, University Liege of Gembloux Agro-Bio Tech,!Passage of the Prisoners 2, Gembloux,,!B-5030, Belgium.
3. Unity of General and Organic Chemistry, Faculty of the Agronomic Sciences,!University Liege of Gembloux Agro-Bio Tech, Passage of the Prisoners 2, Gembloux,!B-5030, Belgium.
4. Beekeeping Research and Information Centre, Louvain-la-Neuve, Belgium.
1.( Introduction
Honey is defined as the natural sweet substance produced by honey bees from nectar of blossoms or from secretions of living parts of plants or excretions of plant sucking insects on the living part of plants, which honey bees collect, transform and combine with specific substances of their own, store and leave in the honey comb to ripen and mature [1]. Honey is a very important energy food and is used as an ingredient in hundreds of manufactured foods, mainly in cereal based products, for its sweetness, color, flavor, caramelization and viscosity [2].
Honey contains approximately 80% carbohydrates (35% glucose, 40% fructose, and 5% sucrose) and 20% water, serving as an excellent source of energy. Also, it contains more than 180 substances including amino acids, vitamins, minerals, enzymes, organic acids phenol compounds. Its pH is approximately 4.0 [3].The composition depends highly on the type of flowers utilized by the bee as well as climatic conditions [4]. Many scientists [1-3-5-6-7, 8] have published the physical properties and chemical composition of honey from different sources. Ihtisham-ul-haq [9] reported that the soil type and climatic conditions varied from one region to the other, thus influencing the physicochemical characteristics of honey. In Morocco, honey is widely used in traditional medicine, unfortunately, there are not enough investigations regarding its quality and characterization, and Euphorbia echinus, Ziziphus lotus and lavender honeys were never studied.
The eastern region has a rich and varied honey flora: the plantations of eucalyptus and citrus fruits, rich in honey-producing species. Modern farms constitute two-thirds of the national total; the honey flora is diversified and it allows in many regions of the oriental to obtain specific products of the territory, like the honey of "rosemary of the Debdou". The Moroccan honey productions regard many types of floral origin [10-11-12, 13]; many researchers have published studies about their parameters especially in Northwest of Morocco [14-15-16-17-11-12, 13].
Abstract
The principal aim of this study was to contribute more to the knowledge of the eastern Moroccan honey by means of the analysis of physicochemical characteristics with different flora of eastern Morocco. Thirty one honey samples were collected from beekeepers in different regions of eastern Morocco. In this study, pH, free acidity, electrical conductivity (EC), water content, diastase, hydroxymethylfurfural (HMF) and Protein content were all determined in different types of eight flora honey jujube, Multifloral, Citrus, Eucalyptus, thyme, carob, lavender and Rosemary. The moisture shows values of 15.39% and 19.37%, pH between 3.53 and 4.94, the free acidity ranges between 5.77 and 19.47 meq/kg, hydroxymethylfurfural (HMF) content shows values between 3.98 and 56.14mg/kg; diastase values were between 6.98 and 21.17 Gothe; electrical conductivity between 108 and 626 µs/cm and Saccharase content values range between 1.16-11.91 U.E/kg. A statistical analysis was carried out to classify eight types of honeys, and identified the most significant parameters, using analysis of variance, principal component analysis (PCA). PCA showed that the cumulative variance was 71.91%. The present study revealed that eastern Morocco honey is a good quality. Received 23 Mar 2016, Revised 06 May 2017, Accepted 12 May 2017
Keywords
!! Honey Physicochemical parameters !! Eastern Moroccan; !! Flora; !! Principal Component Analysis A Abeslami abeslami.azzedine@gmail.com +212677881771We are interested in Study of Physicochemical properties of some honeys produced from different Flora of eastern Morocco and see Compliance with international standards, also see the quality of these honeys. Statistical analysis was used to classify types of honeys, and identify the most important parameters.
!
2. Experimental
2.1. Honey samples
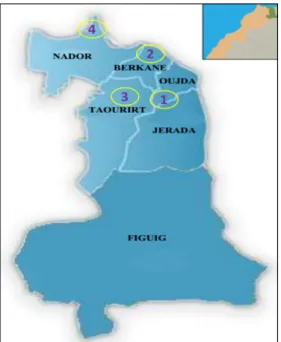
Thirty-one samples of honey were harvested from beehives located in different regions of Eastern Morocco (site 1 :Oujda region , site2 : Berkane region , site3 : Taourirt region , site 4 : Nador region) (Figure 1) during different seasons of the year depending on floral sources (Jujube , Citrus, eucalyptus, carob, thyme, lavender, Multiflora and rosemary) . The samples were homogenised and kept in glass flasks of 250 mL. After honeys’ harvest, the samples were delivered to the laboratory, where they were stored in a dark place at room temperature (±20 °C) until analysis, which occurred in no more than one month after the extraction from the hives by beekeepers. All the samples showed no sign of fermentation or spoilage.
Figure 1: Location of honey sampling in Eastern Morocco.
2.2. pH and free acidity
A Titrateur Kyoto was used to measure the pH and free acidity. pH is measured on an aqueous solution of a 10% (w/v) (2.5 g of honey in a 50 ml beaker, 25 ml of Milli-Q water, dissolved with stirring) of honey prepared in milli-Q water [18]. Free acidity is determined by the inflection of the curve of the neutralizing solution of honey with sodium hydroxide (NaOH) 0.05N.
!
2.3. Moisture content
The water content of the samples was determined by measuring the refractive index at 20 °C according to the harmonized method for honey developed by the International Honey Commission, IHC [19].This determination, performed in duplicate, was conducted using an Abbe Refractometer ATAGO RX-5000.
!
2.4. Electrical conductivity (EC)
EC was measured at 20.0 °C in solutions of honey samples in Milli-Q water using a conductimeter WTW inolab leve1; sufficient to prepare a 20% solution of honey with distilled water, then immersed the tip of the electrical conductivity of the electrode according to the IHC method for honey [19].
!
2.5. Proteins
Proteins were determined using Kjeldahl method. Nitrogenous matter contained in the test sample is mineralized by the action of concentrated sulfuric acid in the presence of a catalyst under the action of heat. The nitrogen is released in the form of ammonia, in the presence of sulfuric acid can be found in the form of ammonium sulfate. An excess of sodium hydroxide neutralized the sulfuric acid and liberates ammonia which is distilled into a solution of boric acid. The ammonia content in the distillate is determined with H2SO4 in presence of a color indicator. The
2.6. Hydroxymethylfurfural (HMF)
A honey sample (5 g) was dissolved in approximately 25 ml Milli-Q water and transferred quantitatively to a 50-ml volumetric flask. To clarify the honey samples and to stop HMF breakdown, 0.5 ml Carrez I (potassium hexacyanoferrate) solution and 0.5 ml Carrez II (zinc acetate dehydrate) solution were added and made up to 50 ml with Milli-Q water, then centrifuged for 10 minutes at 3500 rpm before injection on the HPLC for HMF analysis [11].
HPLC Agilent 1200 system with LC-20AT quaternary pump, Degasser DGU-20A5, SIL-20AC auto sampler, SPD-M20A diode array detector, CTO-20AC Column Oven, software Shimadzu Client/Server, Version 7.3 from Shimadzu Corporation (Tokyo, Japan).
The column used was a ZORBAX Eclipse XDB-C18, reverse phase (Supelco, Bellefonte, PA) stainless steel column (150mm *4.6 mm i.d.; film thickness 5 µm), and operated at 30 C along with a C18 guard column.
The mobile phase was water: methanol (90:10, v/v), and the flow rate was 0.7 ml/min with an injection volume of 10 µl. Injection with Needle Wash .Serial standard solutions of HMF (1–50 mg/l) were made in Milli-Q water.
!
2.7. Diastase activity
1g of honey was dissolved in 15 ml Milli-Q water and 5 ml acetate buffer solution (pH 5.2), transferred to a 100 ml volumetric flask and diluted to volume. To measure the reaction we follow these steps:
1.At time T = 0 min: 5 ml solution White / Honey is taken: transferring them in a test tube and place it in a Bain-married at 40 ° C for at least 5 minutes, the white is prepared taking 5 ml of acetate buffer, and treated in the same way as the sample honey.
2. At time T = 5 min: Using fine forceps, add a PHADEBAS tablet in the tube and vortex until the total disintegration tablet
3. Replace in a water bath (40 ° C) for 30 minutes
4. At time t = 35 minutes: add 1 ml of 0.5M NaOH and vortex. The reaction is then stopped 5. The solution was filtered
6. Transfer the supernatant of each tube in a bowl and make the reading spectrophotometer ULTROSPEC at 620 nm using the white reference.
The diastase activity is expressed in Gothe units (or Schade). The formula is: DA = - 4.37 * Abs+31.38 * Abs+0.03
(DA: diastase activity; Abs: Absorbance of final solution at 620 nm)
2.8. Saccharase content
The method used to measure the activity of saccharase enzymatic units per kilogram of honey. This is the quantity of substrate consumed by the enzyme per minute honey reduced to one kilo of honey that is determined.
When the substrate is lysed, the compound released in the reaction medium, which has a yellow color intensity measured at 400 nm, may be reduced to the concentration of substrate consumed by means of a calibration line [20].
2.9. Statistical analysis
Statistical Package for Social Science (SPSS) version 20.0 was used to establish the difference between the 8 honey types by mean of their physicochemical parameters. The results are expressed as mean values, range of values and standard deviation (SD) using analysis of variance (ANOVA) assuming there were significant differences among them when the statistical comparison gave P < 0.05. In order to check if the correlation matrix can be presumed to be the identity; Bartlett test of sphericity and the KMO test (Kaiser–Meyer– Olkin measure of sampling adequacy) were performed. We proceeded to carry out a study of the bivariate correlations between all the variables, detecting which of them were significant. With the aim of evaluating which of the main factors identified will explain most of the variability, the data matrix was submitted to principal component analysis (PCA), using the covariance matrix. !
2.( Results and discussion
3.1. pH
Honey is naturally acidic irrespective of its geographical origin, which may be due to the presence of organic acids that contribute to its flavor and its stability against microbial spoilage. The pH of honey samples is important during the extraction process because it affects the texture of honey as well as its stability and shelf life [17].
The pH values of our honey samples honey varies between 3.53 and 4.94 with an average of 4.13. Therefore, wholes honeys studied are acidic, so our results is consistent with international standards.
These averages were similar to those previously reported for other honey samples from Brazil [21], Burkinabe [22],
Algerian [23] and Italy [24]. ,
The investigations reveal a significant variation in pH among different floral sources of honey. The result shows the highest mean pH of 4.94 ± 0.68 in jujube, that high pH value was still below the highest value reported for
Australian honey of pH 6.32 , whereas lowest pH of 3.53 ± 0.02 in lavender honey (Table 1). This is mainly due to the variation of different acids and minerals present in the honey. The pH values of honey are of great importance during extraction and storage, since acidity can influence the texture, stability, and shelf life of honey [13].
Table 1: Physicochemical parameters of honey from different flora of eastern Morocco
Flora pH Mean±SD F. acidity (meq/kg) Mean±SD Moisture content (%) Mean±SD EC (µs/cm) Mean±SD Proteins (%) Mean±SD Mean±SD HMF Diastase (Gothe) Mean±SD Saccharase content (U.E/kg) Mean±SD Jujube 4.94±0.68 5.77±1.77 15.39±0.64 578±0.87 0.34±0.05 3.98±4.67 21.17±2.33 14.11±2.52 Multifloral 4.30±0.2 15.07±7.89 17.17±1.63 669±2.74 0.40±0.14 10±4.66 17.82±6.45 14.91±4.59 Citrus 3.79±0.10 14.97±2.89 17.76±1.43 338±0.64 0.31±0.02 27.15±8.73 12.71±1.60 7.59±0.95 Eucalyptus 4.22±0.59 13.68±4.93 19.37±2.17 629±3.90 0.30±0.01 38.55±50.60 11.96±9.20 8.8±6.96 Thyme 4.36±0.03 12.04±0.94 16.85±0.36 566±0.36 0.39±0.01 10.16±3.63 18.72±2.48 9,44±1.06 Carob 4.20± 0.44 14.10±1.71 15.59±1.23 626±2.45 0.42±0.1 3.34±3.36 15.28±8.37 4.48±2.56 Lavender 3.53±0.02 19.47±0.66 18.22±0.72 328±1.40 0.40±0.02 56.14 ±5.33 12.97±1.99 2.23±3.15 Rosemary 3.68±0.1 6 ±1.33 17.92± 1.98 108±2.64 0.22±0.01 15.14±4.86 6.98± 2.36 1.16±1.25 Range 3.53-4.94 5.77-19.47 15.39 -19.37 108-669 0.42-0.22 3.98-56.14 6.98-21.17 1.16 -14.91 Mean ± SD 4.13±0.45 17.17±4.673 17.17±1.31 480±1.99 0.34±0.06 20.55±17.72 14.82±4.43 7.84±5.07
Means were compared by using a one-way ANOVA with post hoc multiple comparisons. In each column, values with different letters (superscripts) indicate significant differences (p < 0.05).
HMF= Hydroxymethylfurfural; F. acidity= Free acidity; E.C= Electrical conductivity. 3.2. Free acidity
Free acidity of all eight samples fell within the permitted range proposed by Codex Alimentarius (1969) [25] of no more than 50 milliequiv acid/kg. The free acidity of honey samples in this study ranged from 5.77 ± 1.77 to 19.47± 0.66 milliequiv acid/kg in Jujube, Lavender, respectively (Table1).
The free acidity of honey may be explained by taking into account the presence of organic acids in equilibrium with their corresponding lactones, or internal esters, and some inorganic ions, such as phosphate [26]. High acidity can be indicative of the fermentation of sugars into organic acids. None of the samples exceeded the limit allowed, which may be taken as an index of freshness of all honey samples. In general, honey is naturally acid irrespective of its geographical origin. The low acidity of jujube honey may be considered as a factor for its preference over all other honey. The investigations further reveal that the variation of these factors is due to source of nectar and climatic conditions of the area.
Average Free acidity is found significant among each other in different honey.
3.3. Electrical conductivity
Electrical conductivity is one of the most important factors for determining the physical characteristics of honey [27]. It is also an important physicochemical measurement for the authentication of unifloral honeys [28]. None of the analyzed honey types showed electrical conductivity values superior to 800 µS /cm suggesting that all samples are from nectar honey (Table 1), which is corroborated by the content of total ashes inferior to 0.6% [29].
The values obtained in the electrical conductivity of between 3.38 and 6.69. However, our results are similar to the findings previously reported by Saxena et al (2010) [30] and Alvarez-Suarez et al (2010) [31].
One might infer the importance of conductivity based on the color, the more it is dark honey is more conductive for Lavender honey is the clearest honey, it has the lowest value of conductivity (108 µS / cm), it misbehaves current no Significant differences were found between the five types of honey under study.
3.4. Proteins
Relatively little is known about the nitrogen content of honey. According to to Anklam [32], the proteins in honey might originate from the plant nectar, from the honeybee, or from pollen. They have an important role in the formation of the honey. Thus, their reduction or absence in adulterated, overheated or excessively stored honeys serves as an indicator of freshness.
Iurlina & Fritz [33] refer that the protein content of honey is usually around 0.3%. A small portion of this fraction consists of enzymes, notably invertase, diastase, amylase, glucose oxidase, catalase, a-glucosidase and
b-glucosidase b-glucosidase [34].The brute protein content no showed statistical differences between the types of honey. As far as the highest protein content is concerned, it was found in carob honey (0.42 ± 0.1 %) while the lowest content was in rosemary honey (0.22 ± 0.01 %) (Table 1).
3.5. Moisture content
The moisture content in the investigated honey samples was between 15.39 and 19.37%, which are within the limit (≤20%) recommended by the international quality regulations [25] (Table 1). Water content is very important for the shelf life of honey during storage [26] and can lead to undesirable honey fermentation due to osmo-tolerant yeasts, which form ethyl alcohol and carbon dioxide [35].
Generally, all of the investigated the eastern of Morocco honey samples were of good quality, as indicated by the low moisture content.
Moisture values were within the values found in Algerian honeys (between 14.64% and 19.04%) [3] and less than those found in Northwest Moroccan honeys (between 14% and 24.1%) [13].Which confirm that the moisture content is also affected by climatic conditions [36].
Variations in moisture are significant among different types of floral honey (Table 1). The moisture content of the studied honey samples ranged from 19.37 % to 15.40 % (Table 1). The eight floral types of honey are found with the excellent moisture content. The water content except eucalyptus containing 19.37 % may be influenced by the time of extraction from the comb in relation to ripening process by the bees [37].
3.6. Hydroxymethylfurfural (HMF)
HMF formation results from the acid-catalyzed dehydration of hexose sugars with fructose being particularly susceptible. In addition, HMF is only present in trace amounts in fresh honey, and its concentration has been reported to increase with storage and the prolonged heating of the honey. HMF is thus an essential parameter used to indicate honey purity. With the exception of lavender honey that contained 56.14 mg/kg of HMF, the HMF concentrations of the remaining honey samples ranging from 3.98 to 38.55 mg/kg (Table 1). Notably, all HMF concentrations were within the recommended range set by the Codex Alimentarius (2000) [38] at 80 mg/kg. The values are also within the allowed maximum limit of 40 mg/kg, as recommended by the Turkish Alimentarus Codex (2003) [40] for honey samples from tropical countries. The exception lavender honey exceeded the recommended limit. The HMF Content, which is used as an index of heat treatment of honey, indicated that this honey with highest HMF. The accumulation of HMF was due to processing of honey at high temperature above 75 °C or storage above 27 °C for months [40].
Analysis of variance of HMF reveals that there is a significant difference among HMF of different honey (Table 1). The average hydroxymethylfurfural (HMF) content of eastern Morocco honey is found within the limits prescribed by the Codex Alimentarious Commission (1969) [25] of not more than 40 mg/ kg in normal honey. Jujube and carob honey indicated good quality with a low level of HMF which may be due to the different methods adopted by the farmers for the extraction and storage of honey. Overall, the low HMF concentrations of the tested the eastern of Morocco honey confirm that these samples are of good quality.
3.7. Diastase activity
Diastase is the common name of the enzyme alpha amylase, naturally present in honey, which is logically weakened and destroyed by heat [41]. In this context, diastase activity is an indicator of the freshness and is a useful tool to detect heat induced defects and improper storage of honey [42].The average diastase value of eastern Morocco honey is found within prescribed limits of Codex Alimentarious Commission [25] of 8 in normal honey and 3 in citrus honey except lavender honey and rosemary honey. This is mainly due to excessive heat treatment during processing of honey that lowers the diastase enzyme in honey. This factor is also considered to be a quality parameter and therefore nothing to do with floral type. There is significant difference found among diastase activity in different honey (Table 1). The most samples honey is found with good diastase activity. Honey is found with good diastase activity.
3.8. Saccharase content
This index is used in combination with other parameters to assess the freshness of honey or timeliness of honey. The Saccharase content values of our honey samples honey varies between 1.16 and 14.11with an average of 7.84 U.E/kg (Table 1). The values vary according to the type of honey, honey type jujube, Multifloral honey present significant values (14.11 U.E/kg / 14.91 U.E/kg), and other types of honey present values <10 U.E/kg. The lowest value is present in the rosemary honey, this value (1.16 U.E/kg) may indicate that honey has been heated. Analysis of variance of Saccharase content reveals that there is a significant differences among IS of different honey. We can say that most of our samples have normal enzyme content.
3.9. Statistical analysis
From the KMO (p= 0.714) and Bartlett (p< 0.001) tests it can be concluded that there is a significant inter correlation between the variables represented by the differently analysed parameters, and the data matrix can proceed for factorial analysis.
In order to classify the eight types of honeys by their physicochemical properties, a standardized PCA was used. From Table 2 it can be concluded that 71.91% of the variation existing in the data can be explained by two factors. Table 3 lists the percentage of the variance explained for each factor and variables which load highly to the first factor based on, pH, HMF, moisture content, diastase and index of Saccharase.
Table 2: Total variance explained
Component
Initial eigenvalues Extraction sums of squared loadings
Total %Of variance Cumulative (%) Total % Of variance Cumulative (%) 1 3.787 47.341 47.341 3.787 47.341 47.341 2 1.966 24.573 71.914 1.966 24.573 71.914 3 .697 8.715 80.629 4 .536 6.702 87.330 5 .385 4.814 92.144 6 .277 3.462 95.607 7 .212 2.650 98.256 8 .139 1.744 100.000
The variables which correlate highly on the second factor are, electrical conductivity , free acidity and proteins, the addition of the first and second one agree with the result of Sanz et al [43] who classified honeys based on their acidity, pH, electrical conductivity, ash, HMF and diastase; however, Terrab et al [17] established water content, and proline as classification factors on the other hand electrical conductivity, free acidity, proline and pH found by Krauze and Zalewski [44] as classification factors.
Figure 2: representation on the first principal plane of the PCA 8 variables that contribute most to the first two axes. From the study of Pena-Crecente and Herrero Latorre [45], we can conclude that water content and acidity were classification parameters (Figure 2).
In order to test the homogeneity of covariance matrices Box’s M Test was used, it was significant, it is concluded that the covariance matrices of the group differ (Table 3).
Table 3: Component matrix Component 1 2 Hydroxymethylfurfural -.844 .003 Diastase .830 -.015 pH .823 -.059 Sascharase content .776 .394 Water content -.709 .393 Proteine .116 .830 Free acidity -.542 .749 Electrical conductivity .544 .634
Conclusions
In conclusion, the result of this study indicated that honey samples from different region of eastern Morocco, were mostly of good quality. Honey samples are differing in quality on account of various factors like floral source. The cumulative variance is approximately 71.91%, showing that the 8 honey types are not well distinguished by their physicochemical parameters. Diastase number (amylase activity) varied between honey samples As regards to the basic parameters that warrant the honey quality, water content, HMF, diastase and Saccharase content previously complying with values proposed by some scientist’s. A deeper professional education would be necessary to promote Moroccan beekeeper vocational training. The knowledge of physicochemical properties of Moroccan honeys is very important in order to set up certification marks and improve the local beekeeping.
Acknowledgments-
We would like to acknowledge cooperation between Université Mohammed Premier and CUD BelgiumReferences
1. E. Mendes, P.E. Brojo, I.M.P.L.V.O. Ferreira, M.A. Ferreira, Carbohydr Polym. 37 (1998) 219. 2. G.O. Rodriguez, B.S. Ferrer, A. Ferrer, B. Rodriguez, Food Chem. 84 (2004) 499.
3. S. Ouchemoukh, H. Louaileche, P. Schweitzer, Food Control. 18 (2007) 52.
4. H.M. Abu-Tarboush, H.A. Al-Kahtani, M.S. El-Sarrage, Food Chem. 46 (1993) 13. 5. P. Przybylowski, A. Wilczynska, Food Chem. 74 (2001) 289.
6. N. Singh, P.K. Bath, Food Chem. 58 (1997) 129.
7. C. Unal, O. Kuplulu, Ankara Üniv Vet Fak Derg. 53 (2006) 1. 8. H. Yilmaz, O. Yavuz, Food Chem. 65 (1999) 475.
9. Ihtisham-ul-haq, Food Sci. Technol. (1997).
10. M.J. Diez, C. Rés, A.Terrab, Int. J. Food Sci. Tech. 36 (2004) 167. 11. A. Terrab, M.J. Diez, F.J. Heredia, Int. J. Food Sci. Tech. 38 (2003a) 379.
12. A. Terrab, M.J. Diez, F.J. Heredia, 2003b. Int. J. Food Sci. Tech. 38 (2003b) 387. 13. A. Terrab, M.J. Diez, F.J. Heredia, Int. J. Food Sci. Tech. 38 (2003c) 395.
14. H. Belouali, M. Bouaka, A. Hakkou, Apiacta. 43 (2008) 17. 15. M. Naman, M. Faid, C. El-Adlouni, Int J Agric Biol. 5 (2005) 773. 16. M. Naman., M. Faid, C. El-Adlouni,Int J Agric Biol. 2 (2004) 289. 17.A. Terrab, M.J. Dı́ez, F.J. Heredia, Food Chem. 79 (2002) 373. 18. J. Louveaux, Les abeilles et leur élevage. OPIDA (1985) 165.
19.S. Bogdanov, P. Martin, C. Lullmann, Harmonised methods of the international honey commission. Swiss Bee
Research Centre, FAM, Liebefeld. (2002).
20. Harmonised Methods of the International Honey Commission. (2009) 56. 17. A. Terrab, M.J. Dı́ez, F.J. Heredia, Food Chem. 79 (2002) 373.
21. L.C. Marchini, V.D.A. Reis, A.C.C.C. Moreti, Cienc. Rural. 36 (2006) 949.
22. A. Meda, C.E. Lamien, J. Millogo, M. Romito, O.G. Nacoulma, Acta vet .BRNO. 74 (2005) 147.
23. C. Makhloufi, P. Shweitzer, B. Azouzi, L. Persano Oddo, A. Choukri, G. Ricciardelli d’Albore, Apicta. 42 (2007) 73.
24. M.E. Conti, J. Stripeikis, L. Campanella, D. Cucina, M.B. Tudino, Chem. Cent. J. 7 (2007) 1.
25. Codex Alimentarious Commission .Honey Standards Legislation. In Eva Crane (ed). Honey: A Comprehensive Survey. Heinemann, London. (1969) 1979.
26. S. Gomes, L. Dias, L. Moreira, P. Rodrigues, L.M. Estevinho, Food Chem. Toxicol. 48 (2010) 544. 27. S. Serrano, M. Villarejo, R. Espejo, M. Jodral, Food Chem. 87(2004) 619.
28. R. Mateo, F. Bosch-Reig, J. Agric. Food Chem. 46. (1998) 393.
29. Council Directive of the European Union. Council directive 2001/110/ec of 20 december (2001) relating to honey. Off. J. Eur. Comm. (2002) 47.
30. S. Saxena, S. Gautam, A. Sharma, Food Chem. 118 (2010) 391.
31. J.M. Alvarez-Suarez, A.M. GonzaLez-Parma, C. Santos-Buelga, M. Battino, J. Agric. Food Chem. 58 (2010) 9817.
32. E. Anklam, Food Chem. 63 (1998) 549.
33. M.O. Iurlina, R. Fritz, Int. J. Food Microbiol. 105 (2005) 297.
34. S.R. Won, D.C. Lee, S.H. Ko, J.W. Kim, H.I. Rhee, Food Res Int. 41(2008) 952.
35. S. Bogdanov, P. Martin, C. Lu llmann , R. Lu llmann, Ch. Flamini, M. Morlot, J. Heretier , G. Vorwohl, H. Russmann, L. Persano-Oddo, A.G. Sabatini, G.L. Marcazzan, P. Marioleas, K. Tsigouri, J.Kerkvliet, A. Ortiz, T. Ivanov, Harmonisedmethods of the European honey commission. Apidologie (extra issue). (1997) 1. 36. V. Nanda, B.C. Sarkar, H.K. Sharma, A.S. Bawa, J. Food Compos. Anal. 16 (2003) 613.
37. W.C. Chung, M.W. Kim, K.J. Sing, Food. Sci. Technol. 16 (1984) 17.
38. Codex Alimentarius. Alinorm 501/25) Draft Revised Standard for Honey at Step 8 of the Codex Procedure; EU Directive /1/110/2001 of 02/12/2001 (L 10/47). (2000).
39. Anonymous, Honey rescript’s Turkish alimentarus codex (in Turkish). The Official Gazette of the Republic of Turkey, Hussein, Turkey. (2003), No. 25180.
40. P.E.W. Rodgers ,Honey Quality Control. In Eva Crane (ed). Honey: A Comprehensive Survey Heineman, London. (1979) 321.
41. J. White. Bee World 75 (1994) 104.
42. E.E. Ramalhosa, T.T. Gomes, A.P. Pereira, T.T. Dias, L.M. Estevinho, Adv ood Nutr. Res. 63 (2011) 101. 43. S. Sanz, C. Perez, A. Herrera, M. Sanz, T. Juan, J. Sci. Food Agric. 69 (1995) 135.
44. A. Krauze, R.I. Zalewski,Z. Lebensm. Unters. For. 1921 (1991) 19.
45. R. Pena-Crecente, C. Herrero Latorre, J. Agric. Food Chem. 414. (1993) 560.