Drying induced shrinkage of Boom Clay: an experimental
1investigation
2Noémie Prime
1 2Séverine Levasseur
1 3Laurent Miny
1 43
Robert Charlier
1Angélique Léonard
5Frédéric Collin
14
5
keywords : Drying, Boom Clay, shrinkage, hydro-mechanical coupling, tomography.
6
7
Drying induced shrinkage of geomaterials may have a strong effect on geostructure stability
8
and deformation. Settlement of foundations, fracture opening on slopes, roads, tunnel walls
9
may be due to drying shrinkage. However, there is still a lack of knowledge concerningshrinkage
10
evolution in time and shrinkage propagation within the material. In this study, the shrinkage
11
of a specific clayey rock, Boom Clay, under drying conditions is experimentally investigated.
12
This rock is a deep geological formation which is under study for high-level and long-life
13
radioactive waste storage in Belgium. Two experimental campaigns are here presented. The
14
first one, based on vapour equilibrium drying technique and completed by sample size manual 15
measurement, aims to characterize the material shrinkage in balanced states. The second one, 16
based on convective drying technique completed by shape monitoring using X-ray tomography, 17
aims to analyse how shrinkage develops before reaching a steady state. Both approaches put
18
1
Université de Liège, dept. ArGEnCo, Liège, Belgium
2
Now at Ecole Centrale Lyon, LTDS laboratory, Lyon, France; noemie.prime@gmail.com,noemie.prime@ec-lyon.fr
3
Now at Ondraf-Niras, Belgian Agency for Radioactive Waste and Enriched Fissile materials, Brussels, Belgium
4
Now at Greisch, Liège, Belgium
5
Université de Liège, dept. Applied Chemistry, Liège, Belgium
in evidence the shrinkage anisotropy of this structurally bedded rock, with a ratio around 2
19
between the direction of maximum strains and the direction of minimum strains. However, the
20
two drying techniques also provide complementary results, as the relation between the amount
21
of shrinkage and the retention curve (for the uniform drying imposed with saline solutions) and
22
the kinetics of shrinkage propagation inside the material (for the non-uniform drying imposed
23
with air convection).
24
1
Introduction
25Geomaterial drying is an important solicitation to deal with. On one hand, it is used as 26
an industrial process for the production of some building materials as clay tiles or gypsum 27
wallboards. In this context, it has to be controlled in order to be fast enough (for productivity 28
need) but, in the same time, sufficiently slow and regular to prevent from cracking. On the 29
other hand, drying also occurs under natural conditions for soils and rocks and, when followed 30
by a wide number of drying-imbibition cycles, may damage the material. This happens for 31
instance for building rock or concrete whose durability can be reduced due to cracks or to other 32
marks of alteration (Alves et al. 1996; Granger 1995). For soils having a high sensitivity to 33
water, drying induces shrinkage which can damage building structures by generating differential 34
settlements (Nowamooz and Masrouri 2010), or can damage the sealing host rock considered 35
for a potential underground nuclear waste storage (Gerard et al. 2008). Typically, expansive
36
clays are concerned, as montmorillonite or smectite, for which the suction developed for non
37
saturated state strains the solid matrix.
38
The interactions between the porous matrix, the liquid and the gaz phases being complex 39
(they are ruled by thermodynamic, mechanical, hydraulic equilibrium), this problem remains 40
a major scientific issue. Permanent strains induced in clay by drying are notably a wide and 41
complex domain of investigation. They are linked to the change of clay mechanical behaviour 42
under drying that becomes plastic and brittle, as experimentally highlighted by Musielak and 43
Mierzwa (2009) by digital recording of video. As cracking causes direct damage of the clay (loss 44
of mechanical resistance, increase of hydraulic conductivity), it is highly investigated with both 45
experimental (Prime et al. 2014; Hedan et al. 2012; Banaszak and Kowalski 2005) and numeri-46
cal approaches (Musielak and Sliwa 2013; Péron et al. 2009; Amarasiri et al. 2011). Shrinkage 47
has also important consequences: not only because it permanently changes the material ge-48
ometry and its mechanical properties, but also because a shrinkage gradient or a constrained 49
shrinkage can cause the onset of cracking, that is to say a severe damage of the material (Peron 50
et al. 2009). For this reason it has to be well characterized and predicted. In civil engineering 51
great effort is made to catch this behaviour which is linked to the loss of saturation. Many 52
experimental works thus aim to describe this soil volumetric response (Fleureau et al. 1993; 53
Tripathy et al. 2002) and many theoretical and numerical ones (Alonso et al. 1990; Loret and 54
Khalili 2002; Kodikara 2012) aim to develop suitable models of behaviour. However, most 55
of these approaches focus on the homogeneous and balanced response, in order to establish 56
coupled hydro-mechanical laws. But the experimental response to a simple boundary condi-57
tion applied, with both coupled behaviour and transient response is rarely presented, although 58
it represents most of the drying mechanisms. Some works can however be mentioned: those 59
by Léonard et al. (2002) which study sludges drying induced shrinkage by mean of X-ray to-60
mography analysis or those by (Peron et al. 2009) which study the drying shrinkage of a fine 61
grained soil and its associated cracking under non uniform mechanical and hydraulic condi-62
tions. Such experimental approaches can furnish important and complementary information 63
to homogeneous response to drying, and it could be useful to validate unsaturated model of 64
behaviour. 65
Within the scientific context above presented, this work aims to experimentally characterize 66
drying induced shrinkage of a natural rock not only for balanced and uniform successive states 67
but also for transient and non-uniform behaviour resulting from the set of a drying boundary 68
condition. The main originality of the present work lays in this last analysis. The rock chosen 69
for the study is Boom Clay, studied as a potential host rock for nuclear waste disposal into
70
deep geological formations in Belgium. This storage project under study is based on a
multi-71
barrier concept, in which the natural impermeable geological formation is the last confinement
72
layer (Bernier et al. 2007) and therefore is largely investigated (Ortiz et al. 2002; Mertens
73
et al. 2004; Bastiaens et al. 2007; Bernier et al. 2007; Chen et al. 2011). Drying is one of
74
the host rock solicitations to study because it is expected in case of contact with the ambient
75
atmosphere (during disposal drilling for instance) or during gallery ventilation (because of
76
damage in lining of the main galleries). This present work thus also represents a valuable
77
approach for the specific issue of nuclear waste underground storage. 78
This article is structured as follows. After a short description of Boom Clay particular
79
features, a first experimental drying test is led with the objective to characterize shrinkage
80
for uniform and equilibrated hydro-mechanical states obtained through vapour equilibrium 81
technique. The second campaign goes beyond the study of this homogeneous response and 82
aims to analyse Boom Clay shrinkage evolution while equilibrium is not yet reached and hydro-83
mechanical state not yet uniform. In this second campaign, drying is imposed by air convection 84
and deformations are determined by tomography analysis. The results are processed in order
85
to get valuable information about the kinetics, the direction and the amount of shrinkage.
86
Lastly, a conclusion gathers the main results for each of these two approaches, compares both
87
of them and suggests some further directions of investigation concerning soft material drying.
88
2
Material studied
89
As previously stated, Boom Clay is a formation which is studied for the disposal, in Belgium,
90
of high-level and long-life nuclear waste into deep geological formation. Researches have been
91
done with the support of HADES (High Activity Disposal Experimental Site) Underground
92
Research Laboratory (URL). It has been drilled in the 1980’s in the Oligocen formation of
93
Boom Clay at around 220 m below ground level. At such depth, the total pressure p is about
94
4.5 MPa while the water pressure u is about 2.25 MPa (the clay being saturated). Main
95
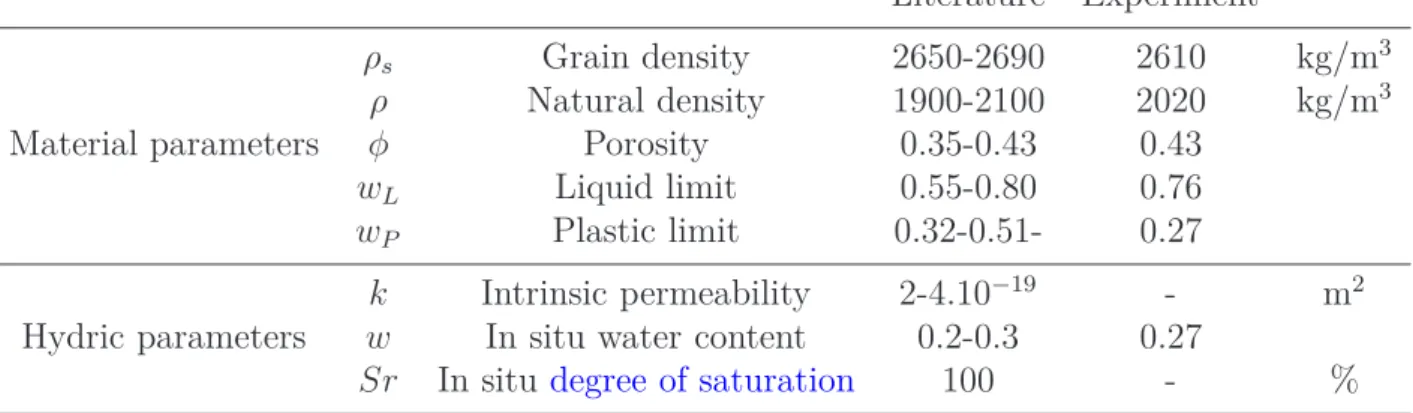
material and hydric properties of this rock are gathered in table 1. For each parameter, this
96
table presents the authors’ estimations compared to classical ranges of variation that can be
97
estimated from literature review. More specifically, all the clay samples analysed here originate
98
from the core drilled in 2007 in the borehole referred to as "2007-3/Connecting Gallery / Ring
99
66-67E/Intrados". In the present study, dry density is determined with helium pycnometer
100
technique, natural one is determined by paraffin covering and immersion, and porosity is
101
deduced from the previous data and from the water content. The Atterberg limits have also
102
been estimated here: the liquid limit equals 76% and the plastic limit equals 27%. It confirms
103
that in its natural state (w=0.2-0.3), Boom Clay may undergo plastic strains, included during
104
drying solicitations.
105
In addition, the layered structure of the formation, alternation of horizontal clay and silt
106
layers, is responsible of a high anisotropy within the material. This internal structure is visible
107
in figure 1 on a partially dried sample. Consequently, it exists a ratio closed to 2 between
108
horizontal and vertical intrinsic permeabilities (kh and kv respectively), with kv ≈ 2.10−19 m
2
109
and kh ≈ 4.10−19 m
2
, which can locally vary according to the nature of the layer (see Aertsens
110
et al. (2004)).
111
Table 1: Synthesis of material and hydraulic Boom Clay parameters. Literature data comes from Mertens et al. (2003); Dehandschutter et al. (2005); Bernier et al. (2007); Volckaert et al. (1996) Literature Experiment Material parameters ρs Grain density 2650-2690 2610 kg/m 3 ρ Natural density 1900-2100 2020 kg/m3 φ Porosity 0.35-0.43 0.43 wL Liquid limit 0.55-0.80 0.76 wP Plastic limit 0.32-0.51- 0.27 Hydric parameters k Intrinsic permeability 2-4.10−19 - m2
w In situ water content 0.2-0.3 0.27
Sr In situ degree of saturation 100 - %
3
Shrinkage analysis under vapour equilibrium drying
112
3.1
Experimental protocol
113
3.1.1 Principle of the experiment 114
In this approach, drying is applied by the transition of the material across successive hermetic
115
chambers having decreasing relative humidities. In each chamber the air relative humidity is
116
set by equilibrium with a specific over-saturated saline solution. It is the so called ’vapour 117
equilibrium technique’. 118
The chamber relative humidity indirectly applies a fixed total suction to the clay since
119
Kelvin equilibrium states that liquid water and water vapour in contact are in thermodynamical
120
equilibrium. Total suction s within the material and relative humidity RH of the air are thus
121 linked as follows: 122 RH = exp sMv RT ρw ! , (1)
with Mv the molar mass of water and R the universal gas constant. Decreasing the ambient
123
relative humidity thus increases the suction s within a porous medium, which corresponds to
124
drying. The physical state of a cell being fixed and constant, water transfers take place, under a
125
vapour form, between the atmosphere and the partially saturated clay samples. Water balance
126
into the clay can be obtained after a certain time, and this state is expressed by a constant
127
mass of the clay sample. More details about this technique, some of its developments and
128
major drawbacks can be found in Tang and Cui (2005); Blatz et al. (2009). 129
Two series of drying tests, denoted A and B, are performed. Strains are only measured for 130
series B. Series A contribute to check the Boom Clay retention curve along the drying path by 131
comparison with literature results. 132
3.1.2 Sampling 133
30 cylindrical samples are drilled in Boom Clay from HADES Belgian laboratory with bedding
134
planes being parallel to the cylinder axis. 15 of them are analysed through drying of series
135
A (retention curve validation) whereas the other 15 are analysed through drying of series B
136
(shrinkage analysis). All cylinders are approximately 30 mm high and 13 mm diameter. The
137
saturated clay being very soft, the wet drilling for series B has to be slow enough in order to 138
get a regular cylinder shape (more details on this procedure can be found in Miny 2013).
139
In the initial state, samples’ mass and water content are determined. For samples of series
140
B dimensions are also initially measured (with a slide caliper) and the bedding direction has
141
to be marked in order to characterize the eventual anisotropy of the response. However, these
142
planes are not visible when the clay is saturated but only appear during drying. Therefore,
143
arbitrary direction is marked in each saturated sample with a thin cut at the top of the cylinder.
144
Such marking is presented at figure 2. This arbitrary direction, along which the dimensions
145
will be measured, has to be compared with the bedding planes’ direction at the end of the test.
146
Clay samples aregrouped in threesin order to have mean values of measuring when placed
147
into a drying chamber. Sets A and B are thus divided into 5 groups of 3 samples, each group
148
being transferred from a chamber to another.
149
3.1.3 Relative humidity selection 150
Various hermetic chambers with fixed RH are used for applying given total suction to the
151
clay samples. These constant humidities, imposed by mean of over saturated saline solutions,
152
are chosen such that s values are relevant to validate the retention curve in the same range
153
as already known reference curves. After analysing the retention results from Volckaert et al.
154
(1996) and Lima et al. (2012), 7 values of RH have been chosen. The necessary salts and the
155
theoretical RH associated, at 20°C, are given in the second and third column of table 2. In a
156
concrete way, a container filled with the saturated saline solution is placed at the bottom of
157
each chamber.
158
In the laboratory conditions, notably with temperature of around 21°C and regular
open-159
ing/closing of the chambers, the real measured relative humidities are presented in fourth
160
Table 2: Relative humidity selection with saline solution (RH values at 20°C) (Volckaert et al.
1996), values of RH really measured and corresponding suction.
Chamber n° Salt used Theoretical RH Measured RH (%) Real s (MPa)
1 K2SO4 97 96 5 2 ZnSO4 90 92 11 3 KCl 86 90 14 4 NaCl 76 80 30 5 NH4NO3 65 69 50 6 Ca(NO3)2 55 60 69 7 MgCl2 33 38 131
column of table 2. The consequent total suctionapplied to the clay placed into the cell is given
161
in the last column of this same table.
162
In order to reduce the duration of the experiment, each group of three samples only transfers 163
across 2 or 3 chambers, the total suction range being covered by the whole set of samples. 164
3.1.4 Data acquisition 165
First of all, total suction s anddegree of saturationSr (or water content w) need to be known
166
to establish the retention curve (looked for both series A and B). On one hand, suction is
167
known because it is imposed in each chamber by the specific saline solution. On the other
168
hand, the current water content w is obtained by weighing the samples once equilibrium is
169
reached in the material (a constant mass after various days in the chamber means equilibrium
170
is achieved) on condition that the final dry mass is also recorded.
171
In addition, for series B, the clay cylinder shape is investigated for mechanical anisotropy
172
analysis. The diameters of interest are obviously the diameters perpendicular D⊥ and parallel
173
Dk to the bedding planes but, as previously stated, these directions are not visible in the initial
174
saturated state. Therefore, arbitrary directions of diameters, D1 and D2, are chosen according
175
to the mark initially made at the top of the cylinders (fig 2a). The height H, D1 and D2 are
176
thus determined at each equilibrated state by using a slide caliper. Diameters are measured at
177
the mid-height of the clay cylinders. At the end of the tests, D1 and D2 directions are finally
178
compared to the revealed bedding planes (fig 2b). Only the relevant measurements, those made
179
perpendicularly and parallel to the bedding planes, are conserved in the results (fig 3). For
180
series B only, degree of saturation can then be obtained thanks to the measured values of H, 181
Dk, and D⊥at each equilibrium state, from which is computed the current volume V (cylinder
182
with spherical or elliptical base). The current degree of saturation Sr is computed with the 183
expression given in equation 2.
184 Sr = w ρw ms V − ms ρs , (2)
(ms being the dry mass and V the total volume).
185
Lastly, in order to confirm the stability of experimental conditions, temperature and hy-186
grometer sensors are placed in each hermetic chamber. 187
3.2
Results and interpretation
188
3.2.1 Retention curve 189
Boom Clay retention curve has already been well investigated (Delage et al. 2007a; Lima 190
et al. 2012; Romero et al. 1999). However, as shrinkage is studied here along successive 191
hygro-mechanical balanced states, it is worth plotting the retention path corresponding to 192
the volumetric strains. 193
For both series, the evolution of w with suction has been plotted in figure 4. Values of
194
degrees of saturation determined for samples of series B are added on the graph.
195
We can see that the imposed suction in each chamber is globally constant, except for
196
chamber 1 (the most humid), where s varies between 1.5 and 5 MPa.
197
Experimental references concerning drying path of the retention curve have been added in 198
this graph. These literature results have been obtained using saline solutions (Delage et al. 199
2007a; Lima et al. 2012) and chilled-mirror dew-point psychrometer (Lima et al. 2012). 200
The present result slightly differs from Lima’s curve realised with chilled-mirror dew-point
201
psychrometer, but the change of saturation technique already makes appear a discrepancy in
202
the authors’ results. Besides, the retention curves from Lima et al. (2012) (for the salt solution
203
method) and Delage et al. (2007a) are well fitted, which validates the experimental method
204
here adopted.
205
Finally Van Genuchten (1980) retention model fitting our data is also plotted in figure 4.
206
The expression of this curve is given in equation 3 with fitting parameters N=2 and A=0.06
207 MPa−1. 208 Sr = (1 + (sA)N)1/N −1 (3) 3.2.2 Anisotropic shrinkage 209
For each chamber applying a specific suction, the resulting strains are computed along the
210
height H of the clay cylinders (direction which is parallel to the bedding planes) and along D⊥
211
and Dk. Moreover, volumetric strain is computed considering a cylindrical volume with elliptic
212
base defined by H,D⊥ and Dk. These four deformations are plotted in figure 5 according to
213
the suction applied.
214
First, it appears that shrinkage (volumetric strain) reaches between 12 and 25% depending
215
on the suction applied. Discrepancy for the same s can be explained by the heterogeneity of
216
the clay, and imprecisions of measurements. But the main point to notice is that strains are
217
significantly higher perpendicularly to the bedding planes than parallel to them, whatever the
218
suction. Indeed strains in parallel to the structural planes reach 3 to 9 % while they reach 6
219
to 16% in perpendicular to these planes. Figure 6 presents the evolution of the ratio λ = ε⊥
εk 220
with the suction applied. It appears that λ linearly increases with the drying but its whole
221
values are around 1.5 and 2.5. This value around 2 corresponds to the anisotropy ratio between
222
perpendicular and parallel moduli proposed by François et al. (2014) or Chen et al. (2011).
223
Boom Clay structural anisotropy thus influences mechanical anisotropy. The orientation of the
224
clay particles in parallel to the bedding planes, may be responsible for this behaviour since the 225
already orientated porosity facilitates the strains normally to these planes. 226
Considering a sample crossing successively all the chambers, it appears from the graph of
227
fig.5 that the main part of the strain is reached for a suction lower than 5 MPa. The strain
228
level still increases a little from s =5 to 11 MPa but, then, almost stabilizes beyond this value.
229
According to the retention curve (fig 4), thedegree of saturationis almost 100% for s< 5 MPa
230
and rapidly decreases between s=5 to 10 MPa. This means that the main amount of shrinkage
231
may corresponds to normal shrinkage (that is to say shrinkage without loss of saturation), 232
which appeared for s< 5 MPa. 233
234
Using a suction control method by (vapour equilibrium technique), this first campaign gives 235
access to valuable information concerning shrinkage, as its amount and its anisotropy in the 236
balanced state. However, this protocol does not analyse the evolution of shrinkage in time and 237
its propagation within the material under a fixed and unbalanced drying condition applied on 238
a boundary. Therefore, a second campaign is presented hereafter, in which convective drying 239
is imposed on one side of Boom clay samples and progressive strains are followed until the final 240
equilibrium. 241
4
Shrinkage analysis under convective drying
242
In this approach, shrinkage is not any more analysed for steady and uniform state of the clay. 243
The objective is to analyse in more details the transient response obtained under convective 244
drying solicitation. 245
4.1
Sample preparation
246
In order to accurately study the drying kinetics and its mechanical consequences, various
247
samples have to be prepared and dried. They are all cut from a unique clay sample whose
248
saturation has been realized with the following protocol.
249
4.1.1 Saturation phase 250
A cylindrical Boom clay sample, with diameter 36 mm, length 35 mm and bedding planes
251
parallel to the axis, is drilled into a core from the Belgian Underground Reasearch Laboratory.
252
To achieve a full saturation, it is submitted to water injection into a triaxial device with 253
a confinement of 3.25 MPa and an injection pressure of 1 MPa progressively applied. The
254
effective pressure applied on the granular skeleton thus equals 2.25 MPa at the end of the
255
loading, that is to say the in situ effective stress value (Delage et al. 2007b), which prevents
256
from non representative swelling during the wetting.
257
According to the hydraulic conductivity of this material, a water pressure gradient of 1 258
MPa applied in parallel to the bedding planes can theoretically lead to a full saturation after 259
40 days. Therefore, the degree of saturation only begins to be checked after 5 weeks within
260
the triaxial. This control is based on Skempton’s coefficient computation as detailed in the
261
following, illustrated by fig. 7.
262
First, the injection system is closed upstream and downstream of the triaxial cell (fig. 7a).
263
Then an increment of total pressure ∆p is applied to the clay sample, while the increase of
264
interstitial pressure ∆u is measured inside the material (fig. 7b). Finally the total pressure is
265
reduced to its initial value. The more the material is saturated, the more the ratio ∆u/∆p,
266
defining the theoretical Skempton’s coefficient B, is closed to 1. This is justified by a Biot
267
coefficient around one for Boom Clay (Bernier et al. 2007; Gens et al. 2007). Indeed by
268
assuming the quasi incompressibility of water and grains, if the injection is closed, a stress
269
increment applied on the grain-pore system leads to a skeleton strain only induced by empty
270
pore contraction. Therefore, if all pores are filled with water, no strain can take place, because
271
of water incompressibility, and the stress is entirely transferred to the water phase.
272
In fact, as grains and water are not totally incompressible, Skempton’s coefficient value
273
cannot be exactly equal to 1 but is restricted to a maximum value given by equation 4.
274 Bmax = 1 1 + nCw−Cs C−Cs , (4)
with Cw the real water compressibility, Cs the grains’ compressibility, and C the global
275
undrained compressibility of clay.
276
Notice that the system valves and tubes also add a fictive compressibility that could impact
277
the computed value of B (Bishop 1976). In consequences, in the present case, saturation is
278
assumed once B reaches 0.8. This is done after around 7 weeks, when a total stress increment
279
approximately equals 1 MPa provides a Skempton’s coefficient B=0.83.
280
4.1.2 Sampling 281
Once the Boom Clay cylinder is taken off from the triaxial device, a careful cutting is realized
282
in order to optimize the material whose saturation is so time-consuming. As the drying device
283
requires few grams samples, 12 samples with a size of the order of a centimetre could be cut
284
into the saturatedclay. It is planned that samples will be dried from a unique top surface. This
285
will guarantee a uniform direction of incidence of the air flow over the surface and will simplify
286
the result analysis because of the globally unidirectional transfers induced within the samples.
287
Therefore, in order to test different material depths under the drying surface, 3 sample sets
288
are prepared: 4 cylindrical samples are drilled with a height of 5 mm, 4 with a height of 10
289
mm, and 4 with a height of 15 mm. They all have a diameter of 15 mm. In addition, the
290
direction of the bedding planes, whose influence on drying is not focused on in this work, is
291
chosen parallel to the axis of the cylindrical samples. A scheme of the sampling is presented
292
in figure 8a.
293
The 12 samples are then immersed into hot liquid paraffin, the temperature being
suffi-294
ciently high to make the paraffin firmly stuck to the clay. That will prevent from the detachment 295
of the liner during drying and thus from the expansion of the drying surface area (see a dried 296
sample example in fig.8b). This covering also makes possible to hermetically store the samples
297
before performing the drying test, and to easily skin the top surface for a sample about to be
298
dried (figure 8b). Another preventive measure to avoid evaporation during the storage, is to
299
placed all sealed samples into the saturated atmosphere of a dessicator filled with water.
300
Finally, the samples are numbered as follows: the first part of the number corresponds to
301
the sample length while the second part distinguishes the 4 samples of the same dimensions.
302
For example 5-1 is the first sample of 5 mm depth.
303
4.2
Drying protocol
304
The protocol has been established by several previous tests from which the most relevant and
305
practical conditions have been determined.
306
4.2.1 Drying device 307
The device used for the present drying tests is a micro-convective-dryer, designed in the
Labo-308
ratory of Chemical Engineering few years ago for studying many different materialsas
wastew-309
ater sludges, mortar cement, fruits, etc. (see for instance Léonard (2002); Bennamoun et al.
310
(2013)). It is suited for drying samples of a few grams by a convective air flow with controlled
311
temperature and velocity.
312
A simplified scheme of the device is presented in figure 9. One part of the system is
313
dedicated to the air flow regulation with a pneumatic valve connected to a flowmeter (n°1 to
314
4 in fig.9). The other part of the system aims to heat the air up to the needed temperature,
315
with a regulation system (n°5 and 6). Air flows into a 4×4 cm section cell with 15 cm length
316
(n°9), where temperature and relative humidity are measured (n°7). The sample to be dried is
317
placed on a support hanged under an analytical balance (n°8), sensitive to 1 mg, and its mass 318
is registered at regular time intervals. It has been verified with an independent weighing, that 319
potential air turbulence in the drying cell has a negligible effect on this measure. 320
4.2.2 Drying conditions 321
The test conditions have been adopted to simulate a convective drying which could be likened
322
to the drying conditions in galleries excavated in Boom Clay. They respect:
323
• a vertical position of the cylinder (it is assumed that gravity has no effect on water
324
transfers for such fine pore size),
325
• an air flow as far as possible parallel to the drying surface, 326
• a temperaturebetween 23.6 and 24.1 °C,
327
• a velocity of the flow about 0.8 m/s.
328
Given this temperature, the ambient humidity in the laboratory during the tests and the 329
compressed air system, which is necessary to impose the air flow but dries the air, the resultant 330
relative humidity RH measured in the drying cell ranges between 3.2 and 3.4%. This value is
331
very low, meaning that the drying imposed in the present experiment is quite intense.
332
4.2.3 Data acquisition with X-ray micro-tomography 333
In addition to the samples’ weighing (every minute in the present case), the 3D geometry and
334
the internal organization of each drying sample are analysed at regular steps of the tests by
335
mean of micro-tomography method.
336
The technique used for that non-destructive investigation is based on X-ray radiations. It
337
lies on the property of each material to attenuate X-rays with a specific coefficient µ (in m−1)
338
which depends on the atomic number Z, the electronic density ρ and the photon energy E
339
according to Vinegar and Wellington (1987):
340 µ = ρ a + bZ 3.8 E3.2 ! , (5)
where a depends on the photon energy and b is a constant empirically determined (Vinegar
341
and Wellington 1987). The object under study is scanned with different angles of X-ray
radi-342
ation, each orientation leading to a global view of the resulting attenuation coefficient for the
343
whole matter crossed. The whole set of these images, called ’projections’, can be post-treated
344
to obtain views of the material cross section.
345
For this experimental campaign, the device used is a Skyscan-1172 scanner (Skyscan,
Bel-346
gium). The scanning frequency during the drying is initially fixed to 50 min but, after some
347
tests, it has been adapted to better fit the first part of the kinetics during which evaporation
348
goes fast. For samples 10-3, 10-4, 15-3 and 15-4, scanning is thus led at 15, 30, 45, 60, 90,
349
150 and 210 minutes. All samples are also scanned in the saturated and dry states. For each
350
scan, the samples are taken off the dryer, covered, and put into the tomography apparatus.
351
The chosen image pixel size is 34.63 µm or 31.86 µm. Such precision is accurate enough and,
352
in the same time, limits the scan duration to 7-8 min, which prevents evaporation while the
353
drying test is suspended. The samples weighing before and after the scan, indeed shows that
354
less than 1% of the mass is lost during this phase. This short disruption of the drying tests
355
also limits the redistribution of moisture within the samples. 356
4.3
Tomography post treatment
357
An example of scanning projection is visible in figure 10a for a 5 mm height sample (sample
358
5-2). It can be noticed that the paraffin cover has only a very light color, due to its low density.
359
The first treatment to lead is cross section reconstruction, which is done along the dotted line
360
direction indicated on the figure.
361
4.3.1 Reconstruction 362
’Reconstruction’ process consists in applying mathematical treatments to the projection images
363
for extracting the attenuation coefficient of each internal point and, by this way, getting cross
364
section images of the analysed sample. In the present case, the cross sections are obtained
365
along the axis of the cylinder (which corresponds to the global direction of the water transfer).
366
Examples of unprocessed reconstructions are presented infigures 10b.
367
4.3.2 Image analysis 368
The cross section images along the clay sample make possible to follow various geometrical
369
characteristics (volume, cracks, etc.), although only shrinkage is focused on in this paper. To
370
quantify this last, it is necessary to determine in each section the extent of the clay, without
371
considering the empty surface covered by cracks and the light layer of paraffin around the clay
372
cylinder. This requires to have a clear criterion to distinguish ’clay’ and ’non-clay’ surface.
373
Therefore, a series of morphological operations is applied to each cross section, with Matlab
374
image analysis toolbox. These operations, applied as an example to a given section of sample
375
5-2 (fig.10), are the following.
376
In a first stage, the image is binarized. Figure 10b presents the initial image where the
377
paraffin jacket is slightly visible. A first binary image (fig.10c) is obtained with Otsu
thresh-378
olding method (Otsu 1975), which is based on the minimization of the intra-class variance
379
between the two sets of pixels. Then, small inclusions (coming from acquisition imperfections
380
or from the binarization threshold) are filled (fig.10d). ’Small inclusions’ are here defined by
381
clusters made by less than 50 connected pixels 382
The main issue with this image processing is to both exclude irrelevant zones of the image 383
(scanning artefacts within the cross sections, paraffin layer around the sample) and conserve 384
as much as possible the pattern and the area covered by cracks. 385
This image analysis is automatically repeated for each cross section of each sample, and for
386
every scan.
387
4.4
Results and interpretation
388
Because 2 samples (5-3 and 10-2) were damaged when prepared, only 10 of them were dried
389
and analysed. The first point investigated here is the drying kinetics, necessary to later analyse
390
the shrinkage propagation.
391
4.4.1 Drying kinetics 392
The mass evolution in time presented in figure 11 for sample 5-2 shows that the dry state is
393
reached after 1 day with a strong evaporation during the first 2 or 3 hours of the test. This
394
has been confirmed for all other 5 mm height samples. For 10 mm and 15 mm samples, dry
395
state is attained after 2 to 3 days and 4 days respectively (not presented here).
396
The evaporation flux q related to the drying surface S can be computed from the mass loss
397 as follows: 398 q = −dm dt 1 S (6)
q plotted along the decrease of water content w (on a dry basis) is a classical curve in drying 399
field, called ’Krischer’s curve’. For sample 5-2, it gives the graph presented in figure 12a, when
400
considering,in a first assumption, a constant evaporation surface during the test. In this figure,
401
the rough curve presents heavy fluctuations which are due to the small time step between two
402
weighing, during which a variation of mass is not necessarily recorded. Consequently, the curve
403
has been smoothed with Lanczos filter (Lanczos 1956). In this method, the mass derivative at
404
a given time t is expressed from a given range of data defined from (t − n.dt) to (t + n.dt), n
405
being called the ’semi-length filter’ and dt being the time between two measures. More details
406
on this procedure are given for instance in Léonard (2002). The smoothed resulting curve with
407
a semi length filter (’SLF’) equal to 6 is visible in the same figure 12a.
408
Since clay may undergo shrinkage, the assumption of a constant drying area cannot be
409
conserved and a correction of the Krischer’s curve is necessary. Following Léonard et al. (2002)
410
and May and Perré (2002), tomography is used to get the real drying surface and to correct
411
the flux q. The top section area of the clay cylinders is then extracted from the image analysis,
412
assuming that internal surface of cracks does not contribute to increase the drying surface. 413
Indeed, given their very thin opening (less than 0.7 mm), it can reasonably be considered that 414
they are submitted to a relative humidity close to 100%. This computation provides, after
415
linear extrapolation, the surface evolution shown in fig. 12c. This plot gives a first idea of the
416
shrinkage evolution, which appears concentrated in the first stage of the test. The corrected
417
Krischer ’s curves (with and without smoothing) are finally presented in fig. 12b.
418
This process better reveals a first stage during which the evaporation rate slightly varies. 419
Indeed, plotting the tangent to the drying curves for the initial water content makes appear 420
a lower initial slope for the updated drying surface (fig.12b) than for the constant surface 421
(fig.12a). This quasi constant drying rate lasts up to a water content around 0.2. Afterwards, 422
q decreases more intensely. Such stages can be assimilated to classical ’Constant Rate Period’
423
(CRP) and ’Falling Rate Period’ (FRP) of drying kinetics (Sherwood 1929a,b). It isadmitted
424
that, during CRP, the evaporation flux is limited by external factors, being temperature and
425
relative humidity which remain constant along convective drying tests due to the air renewal.
426
Then, during FRP, evaporation at the drying surface becomes faster than the water transfer
427
within the material. The kinetics thus becomes controlled byinternal factorsbeing thetransfer
428
of water up to the drying surface.
429
Corrected Krischer’s curves for the 10 dried samples are plotted in fig. 13a, b, c. First of 430
all, the water contents pointed out for the scans of sample 5-2 (arrows in fig.13a) show that the 431
drying disruption has no visible effect on the drying rate. It means that no significant moisture 432
redistribution occurs during the scanning. Below each of these graphs is plotted the derivative
433
of the drying flux q with respect to the water content w during the first stage of the tests
434
(fig.13d, e, f). This makes possible to determine when the variation of the flux emphasizes,
435
that is to say when transition between CRP and FRP can be considered. This transition is
436
arbitrarily fixed for dq/dw equal to 2.10−3 kg/m2
/s, which makes possible to give w for sample
437
5-1, 5-2, 5-4, 10-3, 10-4. For Krischer’s curve of sample 10-1, the initial derived of q is not even
438
lower than 2.10−3 kg/m2
/s, but it starts to hardly increase at w close to 0.22. No transition
439
can be caught from fig.13 f concerning samples of 15 mm high. However, it could be estimated
440
for samples 15-1 and 15-3 from the rough curves. Finally, only samples 15-2 and 15-4 present
441
a decreasing flux. Overall, fig.13 makes appear that the longer the samples, the less visible
442
the CRP is (plots a, b and c) and the stronger the decrease of the flux along the loss of water 443
content is (plots d, e and f). This may be due to internal limitation increase when enlarging 444
the porous layer to be crossed by water before reaching the drying surface. Such influence of 445
the dimensions has been focused on for other kind of rocks (Prime et al. 2015). 446
The values of w at the CRP/FRP transition are gathered in table 3, together with the time
447
at which the transition occurred (deduced from the critical water content).
448
According to these data, it appears that the Constant Rate Period lasts a very short
449
time, which is consistent with the high internal limitations expected for such a low permeable
450
material. Beside, it can be noticed that the water content at this stage is about 0.18 whatever
451
the duration of the CRP. Although this value stands for the mean water content over each
452
sample, it can be related to the retention curve obtained in fig.4. It appears that w=0.18 453
corresponds to a degree of saturation not far from 100 % and to the range of suction from 454
which the shrinkage has been observed to stabilize (fig.5). 455
Table 3: Elapsed time and water content at the end of the CRP
5-1 5-2 5-4 10-1 10-3 10-4 15-1 15-2 15-3 15-4
t [min] 30 60 45 45 60 60 70 50
w [-] 0.17 0.18 0.19 0.22 0.18 0.18 0.20 0.19
From the CRP flux values, mass and heat convective transfer coefficients, α and β
respec-456
tively, can be computed. They give valuable information because they quantify the intensity
457
of convective transfers for each drying test. According to the limit layer model (illustrated
458
in figure 14), water and heat transfer fluxes during CRP are ruled by diffusion mechanism
459
at the drying surface. On one hand, water transfer is proportional to the difference of water
460
content between the wetted surface and the environment expressed, in this work, as a vapour
461
density potential (as proposed by Ben Nasrallah and Pere 1988) where α represents the
pro-462
portionality coefficient. On the other hand, one part of the heat transfer is proportional to
463
temperature driving potential with β proportionality coefficient, while the other part depends
464
on the amount of evaporated water. CRP water and heat fluxes, qcst and qh respectively, can
465
thus be expressed as follows (Ben Nasrallah and Pere 1988):
466 qcst = α(ρv,sat− ρv,air)(kg/m 2 /s) (7) qh = β(Tair− Th) − Lqcst, (W/m 2 ) (8)
where ρv,sat and ρv,air being respectively the vapour density on the surface of the porous
467
material and in the surrounding air, Th and Tair being respectively the temperature (in K) on
468
the surface and in the air, and L the latent heat of water. 469
During the CRP, water vapour is supposed to saturate the surface of the sample (ρv=ρv,sat),
470
and the surface temperature is assumed to correspond to the wet bulb temperature, that is to 471
say the temperature for a relative humidity equal to 100% (T = Th). Besides, it is supposed
472
that the heat supplied to the system is only consumed to evaporate the water film. In other 473
words, no heat is transferred to the sample itself. α and β can thus be obtained as follows: 474 475 α = qcst (ρv,sat− ρv,air) (m/s) (9) β = Lqcst (Tair− Th) , (W/m2 /K) (10) 476
In these expressions, the wet bulb temperature Th, is calculated thanks to its relation with
477
ambient vapour pressure Pv, saturated vapour pressure Pv,sat and Tair (Nadeau and Puigalli
478
1995). Pv,sat can be determined thanks to Garrels and Christ’s empirical expression (Garrels
479
et al. 1965) for temperature between 273 and 303 K and Pv thanks to the relative humidity
480
RH given that, by definition: RH=Pv/Pv,sat. Finally, densities ρv,air and ρv,sat can be deduced
481
from Pv and Pv,sat, with the ideal gas law.
482
Transfer coefficients for each test are presented in table 4. The values are quite
homoge-483
neous, with mean α equal to 0.051 m/s, mean β equal to 57 W/m2
/K and standard deviations
484
lower than 10 % for both coefficients. These results are consistent with those obtained by
485
Gerard et al. (2010). Indeed, for Boom Clay convective drying with air flow velocity equal to 486
1 m/s, temperature between 17 and 70°C and relative humidity between 1 and 50% , mass 487
and heat transfer coefficients were ranging between 0.035 – 0.050 m/s and 37 and 55 W/m2
/K 488
respectively. 489
Table 4: Water and heat transfer coefficients (α and β respectively)
5-1 5-2 5-4 10-1 10-3 10-4 15-1 15-2 15-3 15-4
α [m/s] 0.047 0.049 0.048 0.057 0.045 0.046 0.058 0.058 0.052 0.051
β [W/m2
/K] 52.2 55.2 53.3 64.2 50.3 51.7 63.7 64.8 57.7 56.6
4.4.2 Normal shrinkage of the whole samples
490
Integrating the area covered by clay over all cross sections at a given time gives the volume of
491
the scanned sample, as stated by equation 11.
492 493 V (t) = N X k=1 Sk(t).l, (11) 494
with V (t) the volume of a given sample at time t, N the number of reconstructions over the 495
sample height, Sk the area covered by the sample for the kth reconstruction and l the distance
496
between two reconstructions. Sk only takes into account the area occupied by clay without
497
considering the area occupied by cracks. 498
This makes possible to follow the shrinkage evolution along drying.
499
Figure 15 presents, for all samples, the evolution of the shrinkage volume (difference between 500
initial and current volumes) along the decreasing water content. This last variable is a mean 501
value for each sample, since moisture distribution is not uniform along the material. 502
In the same axes are represented the evaporated amount of water (equal to the mass loss
503
divided by water density) along the water content, this plot being naturally linear.
504
From the two superposed curves of each sample, it appears that the evaporated volume 505
equals the shrinkage volume in the first stage of the drying. Then, once the water content
506
reaches around 0.2, the shrinkage hardly evolves with regards to the volume evaporated. This
507
result means that early shrinkage, which represents the main part of the strain, takes place
508
without desaturation of the clay: the water loss is counterbalanced by pore contraction. Such
509
shrinkage is classically called ’normal shrinkage’.
510
To better understand this mechanism, and its link with the drying kinetics, this shrinkage 511
curve has been faced with Krischer’s curve for three samples, 5-2, 10-4 and 15-1 (fig.16). 512
Fig.16a makes appear the water content for which the desaturation starts and Fig.16b makes 513
appear the water content for CRP/ FRP transition. These values of water content globally 514
correspond one to another, which shows the synchronism between the mechanical and the 515
hydraulic transition of the clay response. 516
Indeed it is known that internal resistances greatly increase once saturation is lost, in such 517
a way that they can become the limiting factor with regard to the drying kinetics. 518
In this first analyse of the results, shrinkage evolution has been characterized in its whole,
519
without considering the non-uniform state induced by the drying condition. Thanks to
tomog-520
raphy, the shrinkage profile along the clay cylinders can also be investigated.
521
4.4.3 Shrinkage profile and propagation 522
In each cross section, the image analysis returns the area occupied by clay. The ratio between
523
this value and the initial area of the cross section gives the relative contraction of the section
524
which is a quantitative indicator of the shrinkage, although this ratio is only two-dimensional.
525
Such contraction is computed for all sections in order to make appear a shrinkage profile for
526
each time of the drying test. Moreover, plotting this profile throughout the test shows how
527
the strains develop with the chosen drying conditions. Figure 17 illustrates this evolution for
528
sample 10-3 (10 mm height), which has been scanned from the early stage of the drying test
529
(15, 30, 45 and 60 min). The top-drying surface is located at the left of the curves (0 mm
530
depth).
531
This figure confirms that, with the present conditions, most of the shrinkage takes place at
532
the very beginning of the drying (around 2/3 of the final strain has developed after 1 hour).
533
Furthermore, one can see that after 15 min, the shrinkage exhibits a globally linear repartition
534
along the depth of the clay, with a maximum amplitude located at the drying surface while,
535
afterwards, it progressively becomes uniform through the sample. For 5 and 10 mm depth
536
samples, the tendency is the same, with a strain gradient disappearing from 15 min. For 15
537
mm samples, the strain gradient is sustained longer, until 30 to 60 min.
538
According to the CRP end established in table 3, this gradient develops during the CRP,
539
and thus still corresponds to a saturated state of the clay. As the shrinkage is normal in this
540
period, the shrinkage amount corresponds to the decrease of water content. Therefore, it can
541
reasonably be assumed that the water content profile also follows a globally linear repartition
542
until 15 min for 5 and 10 mm depth samples or 30-60 min for 15 mm samples.
543
Such shrinkage and water content gradients correspond to conditions of ’constrained strains’
544
and ’moisture gradient’ which, according to Peron et al. (2009), are responsible for cracking.
545
That statement well fits our results since cracks indeed develop from the beginning of all
546
tests performed here, included during the CRP. More experimental results about Boom Clay
547
cracking under drying conditions can be found in Prime et al. (2014).
548
4.4.4 Shrinkage anisotropy at equilibrium
549
It appears that for many samples the dry cross sections are not circular but slightly elliptic.In 550
order to orientate this strain anisotropy with regard to the structural anisotropy of the clay, 551
it is necessary to locate the bedding planes in the final dry state. It must be reminded that 552
samples have been drilled such that bedding planes are parallel to the axis of the clay cylinders. 553
From the vertical cracking pattern shown as an example at fig.18 for four dried samples, it can 554
be reasonably assumed that crack global direction follows the bedding planes. This 3D view 555
has been obtained by assembling, for each sample, all the reconstructed cross sections. 556
It is thus possible to align each dry cross section with the bedding plane direction. In the
557
saturated state,there is less need for orientating the sections since the cylinder basis is almost
558
circular. However, the spotting of some small defaults in the clay makes possible to place the
559
section with regards to the dry one.
560
Fig.19a illustrates this positioning of the saturated and dry top sections (sample 5-2) thanks
561
to irregularities pointed out within the clay. On this figure the elliptic shape of the sample at
562
the end of the test also appears.
563
Top cross sections are arbitrarily chosen to quantify this anisotropy, assuming that, at the
564
end of the drying, strain anisotropy is homogeneous along the depth of the clay cylinder. For
565
each sample, dry and saturated dimensions are to compare, by distinguishing parallel and 566
perpendicular directions of diameters (denoted Dk and D⊥ respectively) with respect to the
567
bedding planes. To do so, a rectangular frame is placed around the section to analyse and it
568
is orientated toward the bedding planes (fig.19a). Length and width of the rectangle are then
569
determined by imaging tools for saturated and dry state. In addition, the vertical dimensions
570
of the sample (that is to say the second direction parallel to the bedding planes) is determined
571
before and after drying in the same way, from radio analysis. Figure 19b shows for instance the
572
saturated and dry radios for the same sample 5-2. The strains for the 3 directions are finally
573
reported in figure 20. The volumetric strain (that is to say the shrinkage), determined from
574
the cross section area integration along the depth, is also plotted there.
575
First, this graph highlights that the volumetric strain reachesa final value between 14.5 and
576
25.2% (mean value equal to 18%). Except for sample 5-2, characterized by a particularly high 577
initial water content and a consequent high shrinkage, this value does not vary a lot between 578
one sample to another, with a standard deviation of 1.3% (without considering sample 5.2). 579
This result well confirms the order of magnitude of volumetric strain found in section 3 with 580
vapour equilibrium technique, which was between 12 and 25% 581
This graph also puts in evidence a clear difference between the strains perpendicular to
582
the direction of bedding planes (denoted direction D⊥) with a mean value of ε⊥=7.5 %, and
583
the strains in the direction parallel to them (denoted Dk), with a mean value of εk=3.75 %.
584
Bedded structure, already responsible for permeability anisotropy, is thus also responsible for 585
strain anisotropy with a ratio ε⊥
εk equal to 2. This value is consistent with the anisotropy ratio
586
found in section 3 which ranged between 1.5 and 2.5 depending on the suction applied. 587
588
5
Conclusion
589The two experimental campaigns presented in this paper both aimed to characterize the Boom
590
clay shrinkage. Both simple measurements (as dimension measures, weighing, etc.) as well as
591
high tech methods (X-ray micro-tomography, automatic image processing) have been used to
592
this end.
593
The first proposed campaign refers to vapour equilibrium technique for which increasing
594
values of relative humidity are applied and total suction varies between 5 and 140 MPa. All
595
states analysed are steady states. On the contrary, the second proposed campaign refers to a
596
convective dryingduring which clay response is followed until reaching equilibrium. Because of
597
a low and constant ambient relative humidity (about 3%), suction in this case corresponds to a
598
value around 480 MPa, which means that drying conditions are stronger. Despite their strong
599
differences, these two experimental methods lead to very similar results concerning shrinkage
600
in the balanced state. First, the final shrinkage is about 18% with convective drying while 601
it reaches a mean value of 18.5% with vapour equilibrium technique for the higher values of 602
suction, which are the closest to the convective drying conditions (suction greater than 50 603
MPa). Besides, both campaign make possible to determine a ratio of 2 between the strains 604
in parallel and in perpendicular directions to the bedding planes. This is consistent with the 605
mechanical modulus ratio found in the literature. Finally, according to both of them, the 606
main amount of shrinkage is reached with a saturated state, which corresponds to a normal 607
shrinkage. Vapour equilibrium technique shows that this last occurs until suction about 5-10 608
MPa. In addition to these consistent results, convective drying campaign makes it possible 609
to get further information concerning the drying transient states. First of all, drying kinetics 610
could be characterized. Notably a phasing between a quasi constant drying rate period (CRP) 611
and a decreasing rate period (FRP) could be put in evidence, and transfer parameters could be 612
determined. Normal shrinkage was shown to take place during the CRP. This second campaign 613
also provides the pattern of strain propagation within the Boom Clay, which exhibits a gradient 614
along the depth during a very early period and then becomes uniform from the evaporation 615
surface to the core of the material. 616
Finally, the mechanism investigated in this study can be useful to better interpret the 617
transient behaviour of geomaterials under drying which is of interest in many cases (clay liner 618
for waste storage facilities, clay tiles and ceramic industry, etc.). In addition, it represents a 619
useful reference for future numerical studies aiming to model drying induced strains in Boom 620
Clay. Concerning the mechanical response of soft material under drying, many questions
621
remain open and still need to be further investigated. First of all, the water transfer pattern
622
within the material is particularly interesting since it would lead to a better understanding of
623
the physical mechanisms of water migration. Such an approach has been led for example by
624
Prime et al. (2015) on a rigid limestone by mean of micro-tomography. Another wide direction
625
to investigate concerns crack onset and development, its eventual preferential direction, its link
626
with shrinkage and with drying conditions.
627
References
628Aertsens, M., Wemaere, I., and Wouters, L. Spatial variability of transport parameters in the
629
boom clay. Applied Clay Science, 26(1):37–45, 2004.
630
Alonso, E. E., Gens, A., and Josa, A. A constitutive model for partially saturated soils.
631
Géotechnique, 40(3):405–430, 1990. 632
Alves, C., Sequeira Braga, M., and Hammecker, C. Water transfer and decay of granitic stones
633
in monuments. Comptes rendus de l’Académie des sciences. Série 2. Sciences de la terre et
634
des planètes, 323(5):397–402, 1996. 635
Amarasiri, A. L., Kodikara, J. K., and Costa, S. Numerical modelling of desiccation cracking.
636
International Journal for Numerical and Analytical Methods in Geomechanics, 35(1):82–96, 637
2011.
638
Banaszak, J. and Kowalski, S. Theoretical and experimental analysis of stresses and
frac-639
tures in clay like materials during drying. Chemical Engineering and Processing: Process
640
Intensification, 44(4):497–503, 2005. 641
Bastiaens, W., Bernier, F., and Li, X. L. Selfrac: experiments and conclusions on fracturing,
642
self-healing and self-sealing processes in clays. Physics and Chemistry of the Earth, Parts
643
A/B/C, 32(8):600–615, 2007. 644
Ben Nasrallah, S. and Pere, P. Detailed study of a model of heat and moass transfer durin
645
convective drying of porous media. International Journal of Heat and Mass Transfer, 31 (5):
646
957–967, 1988.
647
Bennamoun, L., Kahlerras, L., Michel, F., Courard, L., Salmon, T., Fraikin, L., Belhamri,
648
A., and Léonard, A. Determination of moisture diffusivity during drying of mortar cement:
649
Experimental and modeling study. International Journal of Energy Engineering, 3(1):1–6,
650
2013.
651
Bernier, F., Li, X. L., and Bastiaens, W. Twenty-five years’ geotechnical observation and
652
testing in the tertiary boom clay formation. Géotechnique, 57(2):229–237, 2007.
653
Bishop, A. The influence of system compressibility on the observed pore-pressure response to
654
an undrained change in stress in saturated rock. Géotechnique, 26(Analytic), 1976.
655
Blatz, J. A., Cui, Y.-J., and Oldecop, L. Vapour equilibrium and osmotic technique for suction
656
control. In Laboratory and Field Testing of Unsaturated Soils, pages 49–61. Springer, 2009.
657
Chen, G., Sillen, X., Verstricht, J., and Li, X. L. Atlas iii in situ heating test in boom clay: Field
658
data, observation and interpretation. Computers and Geotechnics, 38(5):683–696, 2011.
659
Dehandschutter, B., Vandycke, S., Sintubin, M., Vandenberghe, N., and Wouters, L. Brittle
660
fractures and ductile shear bands in argillaceous sediments: interferences from oligocene
661
boom clay (belgium). Journal of Structural Geology, 27, 2005.
662
Delage, P., Le, T. T., Tang, A.-M., Cui, Y.-J., and Li, X.-L. Suction effects in deep boom
663
clay block samples. Technical report, Ecole Nationale des Ponts et Chaussees (CERMES,
664
Institut Navier), Paris, France ; EURIDICE Group, Mol, Belgium, 2007a.
665
Delage, P., Le, T. T., Tang, A.-M., Cui, Y.-J., and Li, X.-L. Suction effects in deep boom clay
666
block samples. Géotechnique, 57 (1):239–244, 2007b.
667
Fleureau, J.-M., Kheirbek-Saoud, S., Soemitro, R., and Taibi, S. Behavior of clayey soils on
668
drying-wetting paths. Canadian geotechnical journal, 30(2):287–296, 1993.
669
François, B., Labiouse, V., Dizier, A., Marinelli, F., Charlier, R., and Collin, F. Hollow cylinder
670
tests on boom clay: Modelling of strain localization in the anisotropic excavation damaged
671
zone. Rock mechanics and rock engineering, 47(1):71–86, 2014.
672
Garrels, R., Christ, C., and Solutions, M. Equilibria. Editorial Harper & Row, New York,
673
pages 213–233, 1965.
674
Gens, A., Vaunat, J., Garitte, B., and Wileveau, Y. In situ behaviour of a stiff layered clay
675
subject to thermal loading: observations and interpretation. Géotechnique, 57(2):207–228,
676
2007.
677
Gerard, P., Charlier, R., Chambon, R., and Collin, F. Influence of evaporation and seepage on
678
the convergence of a ventilated cavity. Water resources research, 44(5):W00C02, 2008.
679
Gerard, P., Léonard, A., Masekanya, J., Charlier, R., and Collin, F. Study of the soil–
680
atmosphere moisture exchanges through convective drying tests in non-isothermal
condi-681
tions. International journal for numerical and analytical methods in geomechanics, 34(12):
682
1297–1320, 2010.
683
Granger, L. Comportement différé du béton dans les enceintes de centrales nucléaires: analyse
684
et modélisation. PhD thesis, Ecole Nationale des Ponts et Chaussées, 1995. 685
Hedan, S., Cosenza, P., Valle, V., Dudoignon, P., Fauchille, A.-L., and Cabrera, J. Investigation
686
of the damage induced by desiccation and heating of tournemire argillite using digital image
687
correlation. International Journal of Rock Mechanics and Mining Sciences, 51:64–75, 2012.
688
Kodikara, J. New framework for volumetric constitutive behaviour of compacted unsaturated
689
soils. Canadian Geotechnical Journal, 49(11):1227–1243, 2012.
690
Lanczos, C. Applied analysis. Prentice-Hall, 1956.
691
Léonard, A. Étude du séchage convectif de boues d’épuration-Suivi de la texture par
microto-692
mographie à rayons X. PhD thesis, Université de Liège, 2002. 693
Léonard, A., Blacher, S., Marchot, P., and Crine, M. Use of X-ray microtomography to follow
694
the convective heat drying of wastewater sludges. Drying Technology, 20(4-5):1053–1069,
695
2002.
696
Lima, A., Romero, E., Piña, Y., Gens, A., and Li, X.-L. Water retention properties of two deep
697
belgian clay formations. In Unsaturated Soils: Research and Applications, pages 179–184.
698
Springer, 2012.
699
Loret, B. and Khalili, N. An effective stress elastic–plastic model for unsaturated porous media.
700
Mechanics of Materials, 34(2):97–116, 2002. 701
May, B. and Perré, P. The importance of considering exchange surface area reduction to
702
exhibit a constant drying flux period in foodstuffs. Journal of Food Engineering, 54(4):
703
271–282, 2002.
704
Mertens, J., Vandenberghe, N., Wouters, L., and Sintubin, M. The origin and development of
705
joints in the boom clay formation (rupelian) in belgium. Geological Society, London, Special
706
Publications, 216(1):309–321, 2003. 707
Mertens, J., Bastiaens, W., and Dehandschutter, B. Characterisation of induced discontinuities
708
in the boom clay around the underground excavations (urf, mol, belgium). Applied Clay
709
Science, 26(1):413–428, 2004. 710
Musielak, G. and Mierzwa, D. Permanent strains in clay-like material during drying. Drying
711
Technology, 27(7-8):894–902, 2009. 712
Musielak, G. and Sliwa, T. Numerical simulation of clay cracking due to drying. In In
pro-713
ceedings of Eurodrying 2013, Paris, 2013. 714
Nadeau, J. and Puigalli, J. Detailed study of a model of heat and mass transfer during convective
715
drying of porous media. Lavoisier, 1995. 716
Nowamooz, H. and Masrouri, F. Mechanical behaviour of expansive soils after several drying
717
and wetting cycles. Geomechanics and Geoengineering: An International Journal, 5(4):
718
213–221, 2010.
719
Ortiz, L., Volckaert, G., and Mallants, D. Gas generation and migration in boom clay, a
720
potential host rock formation for nuclear waste storage. Engineering Geology, 64(2):287–
721
296, 2002.
722
Otsu, N. A threshold selection method from gray-level histograms. Automatica, 11(285-296):
723
23–27, 1975.
724
Péron, H., Delenne, J.-Y., Laloui, L., and El Youssoufi, M. S. Discrete element modelling of
725
drying shrinkage and cracking of soils. Computers and Geotechnics, 36(1):61–69, 2009.
726
Peron, H., Laloui, L., Hueckel, T., and Hu, L. B. Desiccation cracking of soils. European
727
Journal of Environmental and Civil Engineering, 13(7-8):869–888, 2009. 728