Science Arts & Métiers (SAM)
is an open access repository that collects the work of Arts et Métiers Institute of Technology researchers and makes it freely available over the web where possible.
This is an author-deposited version published in: https://sam.ensam.eu
Handle ID: .http://hdl.handle.net/10985/7399
To cite this version :
Marc REBILLAT, Rafik HAJRYA, Nazih MECHBAL - Detection of structural damage using the exponential sine sweep method - In: International Workshop on Structural Health Monitoring, United States, 2013-09-10 - International workshop on Structural Health Monitoring 2013 - 2013
Any correspondence concerning this service should be sent to the repository Administrator : [email protected]
Detection of structural damage using the exponential sine sweep
method
Marc Rébillat, PIMM UMR CNRS, Arts et Métiers ParisTech, Paris, France Rafik Hajrya , PIMM UMR CNRS, Arts et Métiers ParisTech, Paris, France Nazih Mechbal, ,PIMM UMR CNRS, Arts et Métiers ParisTech, Paris, France
ABSTRACT
Structural damages can result in nonlinear dynamical responses. Thus, estimating the nonlinearities generated by damages potentially allows detecting them. In this paper, an original approach called the ES2D (Exponential Sine Sweep Damage Detection) is proposed for nonlinear damage detection. This approach is based on a damage index that reflects the ratio of the energy contained in the nonlinear part of the output versus the energy contained in its linear part. For this, we suppose that the system under study can be modeled as a cascade of Hammerstein models, made of branches in parallel composed of an elevation to the th power followed by a linear
filter called the th order kernel. The Exponential Sine Sweep Method (ESSM) is then
used to identify the linear and nonlinear parts of the model. Exponential sine sweeps are a class of sine sweeps that allow estimating a system’s first kernels in a wide frequency band from only one measurement. The ES2D method is illustrated experimentally on two actual composite plates with surface-mounted PZT-elements: one healthy and one damaged (impact). A given propagation path between a sensor and an actuator in the system is here under investigation. Using the ESSM, the first kernels modeling this propagation path are estimated for both the damaged and undamaged states. On the basis of these estimated first Kernels, the damage index is built. Its detecting efficiency and its insensitivity to environmental noise are then assessed.
I) INTRODUCTION
Structural damages such as cracks or delaminations can result in nonlinear dynamical responses. Thus, estimating the potentially generated nonlinearities allows detecting such damages. By taking advantages of these nonlinear effects, one can furthermore expect to significantly enhance the damage detection process. This idea is not new in the structural health monitoring (SHM) community, and many researchers have already faced this problem [1, 2, 3, 4]. However, all these reviews conclude that using nonlinearities is, indeed, an efficient way to detect damages, but also that there is still a lot of room for improvement in that field of SHM.
In order to build a damage index (DI) that is sensitive to nonlinearities different approaches have been proposed [1, 2, 3]. Some DIs are based on a physical modeling of the damaged structure whereas some are computed without any physical assumption (black box models). Among these black-box approaches, some assume a parametric underlying signal processing model, whereas some are fully
non-parametric. To feed these models, random inputs as well as deterministic broadband or narrowband inputs are used. In this paper, we focus on a nonlinear damage detection approach based on a DI built using a non-parametric black box model estimated using a deterministic broadband signal.
There have been relatively few works in that direction. In a linear framework, Johnson et. al [5] have shown that a nonlinear damage will impact the transmissibility functions (i.e. the frequency domain ratio between two different outputs of the system) and they used such information to detect and locate the damage. Extending the notion of transmissibility functions to nonlinear systems that can be described by Volterra series, Lang et. al [6, 7] were able to quantify the decrease of linearity generated by a nonlinear damage and thus to effectively detect and locate it. However, both methods only check how much the system is not linear instead of properly modeling the nonlinearity. It thus seems difficult to perform damage classification on the basis of these approaches.
In this context, we propose here an original approach, called the ES2D (Exponential Sine sweep Damage detection)devoted to nonlinear damage detection. The approach is based on a damage index that reflects the ratio of the energy contained in the nonlinear part of the output versus the energy contained in its linear part. For this, we suppose that the system under study can be modeled as a cascade of Hammerstein models [8], made of branches in parallel composed of an elevation to the th power followed by a linear filter called the th order kernel (see Figure 1). The
Exponential Sine Sweep Method (ESSM) [9, 10] is then used to identify the linear and nonlinear parts of the model. Exponential sine sweeps are a class of sine sweeps that allow estimating a system’s first kernels in a wide frequency band from only one measurement.
The nonlinear information obtained through this method is qualitative by nature as a model of the nonlinear system is estimated and can thus potentially be used for classification purposes. As a first step toward its use for SHM, the ES2D is illustrated here experimentally on two actual composite plates with surface-mounted PZT-elements: one healthy and one damaged (impact). A given propagation path between a sensor and an actuator in the system is here under investigation. Using the ESSM, the first kernels modeling this propagation path are estimated for both the damaged and undamaged states. On the basis of these estimated first Kernels, the damage index is built. Its detecting efficiency and its insensitivity to environmental noise are then assessed.
The paper is organized as follows. In section II), the cascade of Hammerstein models as well as the mathematics behind it are described. Then, the experimental setup is presented in section III), and the damage index is defined and validated experimentally in section IV). A conclusion and a discussion about the potentialities offered by this method are drawn in section 0.
II) THE EXPONENTIAL SINE SWEEP METHOD (ESSM) 1) Cascade of Hammerstein models
In a cascade of Hammerstein system [8], each branch is composed of one nonlinear static polynomial element followed by a linear one as shown in
Figure 1. The relation between the input and the output of such a system is given by Eq. (1) where denotes the convolution operator.
Figure 1: A cascade of Hammerstein models Figure 2: Deconvolution result
∑
Eq. (1) It can easily be shown from Eq. (1) that cascades of Hammerstein models correspond to Volterra models having diagonal Kernels [9] in the temporal domain. With Volterra models, one can express the relationship between the system input and output as a series of multiple convolution integrals and they represent exactly any nonlinear “analytical” system [11]. Thus, cascades of Hammerstein models represent a subclass of all the nonlinear “analytical” systems described by Volterra models.
2) Exponential sine sweeps
To experimentally cover the frequency range over which the system under study has to be identified, cosines with time-varying frequencies are commonly used. Indeed, if is the input of the cascade of Hammerstein models, the output of the nonlinear block (see Figure 1) can be rewritten using Chebyshev polynomials as in Eq. (2). Details of the computation of the Chebyshev matrix are provided in [9].
∑
Eq. (2) When the instantaneous frequency of is increasing exponentially from to in a time interval , this signal is called an “Exponential Sine Sweep”. It can be shown in [9, 10], that by choosing ( ) ⁄ with , one obtains:
⁄ Eq. (3) Eq. (3) is another expression of the term in the linearization presented in Eq. (2).
In summary, for any exponential sine sweep of duration , multiplying the phase by a factor yields to the same signal, advanced in time by .
3) Kernel recovery in the temporal domain
If an exponential sine sweep is presented at the input of a cascade of Hammerstein models, we obtain by combining Eq. (3) and Eq. (1) the following relation: ∑ ∑ Eq. (4) where corresponds to the contribution of the different kernels to the
harmonic.
In order to separately identify each kernel of the cascade of Hammerstein models, a signal operating as the inverse of the input signal in the convolution sense, is needed. The Fourier transform of the inverse filter can be built by means of Eq. (5):
̅
Eq. (5)
where and ̅ are respectively the Fourier transform of and its complex conjugate, and is a frequency-dependent real parameter chosen to be in the bandwidth of interest and to have a large value outside, with a continuous transition between the two domains, see [9].
After convolving the output of the cascade of Hammerstein models given in Eq. (4) with , one obtains Eq. (6),(as shown in Figure 2):
∑
Eq. (6) Because and , the higher the order of non-linearity , the more advanced is the corresponding , see Figure 2. Thus, if is chosen long enough, the different do not overlap in time and can be separated by simply windowing them in the time domain. Using Eq. (7), the family { } of the
kernels of the cascade of Hammerstein models under study can then be fully extracted. ( ) ( ) Eq. (7)
In Eq. (7), the exponent stands for matrix transposition and represents the Chebyshev matrix , defined earlier, from which the first column and the first row have been removed.
III) EXPERIMENTAL TEST BENCH 1) Plate specimens
The two composite plates employed in this study consist of a piece of aircraft fuselage. The dimensions of these structures are . They are both made up of 16 layers Carbone epoxy material. The layer sequences are: (0°2,
45°2, -45°2, 90°2, 90°2, -45°2, 45°2, 0°2). An optimal placement of ten PZ29
piezoceramic patches with dimensions has been achieved on these two structures using the controllability and observability gramians [12]. The composite plate shown in Figure 3 was used as the baseline for damage detection. Figure 4shows the second composite plate, manufactured from the same material and layer sequences, having the same dimensions and PZT number and placement as the first one. However, in this plate, an impact damage with a diameter was produced by projecting on the center of the plate a steel ball at a high and controlled velocity. This composite plate will be used as a damaged plate example.
Figure 3: Healthy composite plate Figure 4: Damaged composite plate
2) Data acquisition and Hammerstein Kernels estimation
The input excitation and the data acquisition were performed using a voltage amplifier (TREK MODEL 601C) and charge amplifiers (type 5011B). This excitation was applied sequentially to nine PZT elements out of the ten available and consists of an exponential sine sweep signal with Hz, kHz, s and an amplitude of V (see section II). Using a real time prototype system dSPACE®,
temporal signals were acquired with a sampling frequency kHz from nine channels: one corresponding to the excitation applied to a given PZT actuator, and the eight others corresponding to the measurements collected by the PZT sensors.
A database has been built by collecting in each state (healthy or damaged) the signals for the paths existing between all pairs of PZT elements. The Hammerstein Kernels corresponding to each path for the healthy and damaged states recorded in this database have been estimated using the method described in section II) up to an order of nonlinearity . The objective of this database is to illustrate the ability of the method to detect damages whatever the path that is considered.
Another database has been built, by collecting times in the healthy state the signals for all the paths starting from the PZT element number , located near the center of the plate, close to the damage. Again, the Hammerstein Kernels corresponding to each path for the safe and damaged states recorded in this database have been estimated using the method described in section II) up to an order of nonlinearity .The aim
of this database is to quantify the environmental variability existing for a given path by computing the damage index mean and standard deviation over the trials. It can be noticed here that the proposed method is not fully nonparametric. Indeed, one parameter, the order of nonlinearity up to which the nonlinear model has to be estimated, is still to be chosen. Its choice mainly depends on the noise conditions and on the length of the input exponential sine sweep [9].
IV) Proposed damage index 1) Definition
Taking advantage of being able to separately identify the linear and nonlinear parts of the system, we propose a damage index (DI) that is defined as the ratio of the energy contained in the nonlinear part of the output of the cascade of Hammerstein models versus the energy contained in the linear part of the output of the cascade of Hammerstein models. By rephrasing Eq. (1) which expresses the output of the cascade of Hammerstein models as a function of the input signal and of the Hammerstein kernels { }
, it is possible to decompose the output of the
cascade of Hammerstein models as follows: ∑
Eq. (8)
As the input signal is known and as the Hammerstein kernels { }
have
been estimated previously for each path, the linear and nonlinear parts of the output signal and are easy to evaluate. Then, by denoting and the Fourier transform of and , we propose a damage index based on the ratio of the energy contained in the nonlinear part of the output versus its linear part . This damage index is defined as follow:
∫
∫ Eq. (9)
where and have been defined in section II).2). 2) Sensibility to the presence of the damage
To assess the sensibility of the DI defined in Eq. (9) to the presence of the damage, DI values have been computed for each of the paths measured on the healthy and damaged plates (as described in section III). For sake of brevity, DI values are presented here in a synthetic manner actuator by actuator. Figure 5 depicts the mean and standard deviation of the DI values computed for all the paths starting from each of the nine PZT elements used as actuators for both the healthy and damaged states. From this figure, we can see that even in the healthy state, the DI values for each actuator are around . This means that there is a non-negligible part of the energy in the nonlinear part of the output and thus that the system under study is nonlinear in its healthy state. This illustrates the fact that the ES2D method can handle systems that are nonlinear in their healthy state. From Figure 5, it is also clear that the damage introduced in the plate generates nonlinearities and that the DI defined in
Eq. (9) is sensitive to the presence of this damage. Indeed, for all the actuators, the mean DI values computed for all the paths starting from this actuator are higher for the damaged state than for the healthy one.
Figure 5: Mean and standard deviation of the DI values computed using Eq. (9) for all the paths starting
for each of the nine PZT elements used as actuators both the healthy and damaged states.
3) Sensibility to environmental noise
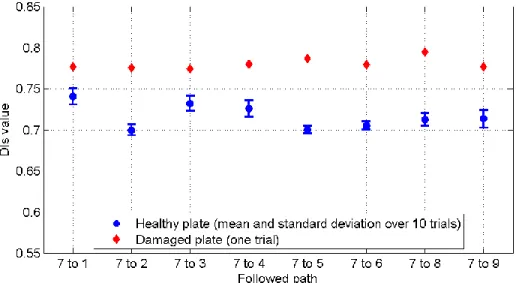
To assess the sensibility of the DI defined in Eq. (9) to the presence of environmental noise, DI values have been computed for repetitions of a subset of paths starting from PZT 7 for the healthy plate, as described in section III). In Figure 6, the mean and standard deviation of the DI values computed over the repetitions for each path are shown as well as the DI values obtained previously for the damaged plate. From that figure, it can be seen that the variations caused by environmental noise on DI values remains relatively low and that the DI values for the damaged case are well above the DI values for the healthy state. As such, we can conclude that the proposed DI is not much sensitive to environmental noise.
Figure 6: Mean and standard deviation of the DI values computed using Eq. (9) for all the paths starting
for the PZT element number 7 estimated times.
V) Conclusion
In this paper, we propose an original approach, called the ES2D (Exponential Sine sweep Damage detection) devoted to nonlinear damage detection. The approach is based on a damage index that reflects the ratio of the energy contained in the nonlinear part of the output versus the energy contained in its linear part. For this, we suppose that the system under study can be modeled as a cascade of Hammerstein models. The Exponential Sine Sweep Method is then used to identify the linear and nonlinear parts of the model. This method is illustrated experimentally on two actual composite plates with surface-mounted PZT-elements: one healthy and one damaged (impact). The damage index is shown to be sensitive to the presence of the damage and not so sensitive to environmental noise. The ES2D thus allows successfully for the detection of structural damages. As a short term perspective, the proposed methodology will be validated using finite-element numerical simulations of a damaged system where different kind of damages will be introduced. The a priori advantage that offers this method to classify damages could be then tested.
REFERENCES
[1] C. R. Farrar, K. Worden, M. D. Todd, G. Park, J. Nichols, D. E. Adams, M. T. Bement et K. Farinholt, «Nonlinear system identification for damage detection», Los Alamos National Laboratory, 2007.
[2] K. Worden, C. R. Farrar, J. Haywood et M. Todd, «A review of nonlinear dynamics applications to structural health monitoring», Structural Control and Health Monitoring, vol. 15, pp. 540-567, 2008.
[3] J. M. Nichols et M. D. Todd, «Nonlinear Features for SHM Applications,» in Encyclopedia of
Structural Health Monitoring, John Wiley & Sons, Ltd, 2009.
[4] G. Kerschen, K. Worden, A. F. Vakakis et J.-C. Golinval, «Past, present and future of nonlinear system identification in structural dynamics», Mechanical Systems and Signal Processing, vol. 20,
pp. 505 - 592, 2006.
[5] T. J. Johnson et D. E. Adams, «Transmissibility as a differential indicator of structural damage»,
Journal of vibration and acoustics, vol. 124, n° 14, pp. 634-641, 2002.
[6] Z. Lang, G. Park, C. Farrar, M. Todd, Z. Mao, L. Zhao et K. Worden, «Transmissibility of non-linear output frequency response functions with application in detection and location of damage in MDOF structural systems», International Journal of Non-Linear Mechanics, vol. 46, pp. 841 - 853, 2011.
[7] Z. Lang et Z. Peng, «A novel approach for nonlinearity detection in vibrating systems», Journal of
Sound and Vibration, vol. 314, pp. 603 - 615, 2008.
[8] H.-W. Chen, «Modeling and identification of parallel nonlinear systems: structural classification and parameter estimation methods», Proceedings of the IEEE, vol. 83, pp. 39-66, 1995.
[9] M. Rébillat, R. Hennequin, E. Corteel et B. F. G. Katz, «Identification of cascade of Hammerstein models for the description of nonlinearities in vibrating devices», Journal of Sound and Vibration, vol. 330, n° 15, pp. 1018--1038, 2011.
[10] A. Novak, L. Simon, F. Kadlec et P. Lotton, «Nonlinear System Identification Using Exponential Swept-Sine Signal», IEEE Transactions on Instrumentation and Measurement, pp. 2220--2229, 2010.
[11] G. Palm, «On representation and approximation of nonlinear systems», Biological Cybernetics, vol. 34, pp. 49-52, 1979.
[12] R. Hajrya, N. Mechbal et M. Vergé, «Active damage detection and localization applied to a composite structure using piezoceramic patches», in IEEE Conference on Control and Fault