TH `
ESE
TH `
ESE
En vue de l’obtention du
DOCTORAT DE L’UNIVERSIT´
E DE
TOULOUSE
D´elivr´e par : l’Universit´e Toulouse 3 Paul Sabatier (UT3 Paul Sabatier)
Pr´esent´ee et soutenue le 30/06/2017 par :
Dwiyoga NUGROHO
La mar´
ee dans un mod`
ele de circulation g´
en´
erale
dans les mers Indon´
esiennes
JURY
Isabelle Dadou Pr´esidente Professeur-Universit´e Paul
Sabatier,FRANCE
Eric Chassignet Rapporteur Professeur-Florida State
University,USA
Janet Sprintall Rapporteur Senior scientist-Scripps-UC
San Diego,USA
Brian Arbic Examinateur Professeur
associ´e-Michigan State University,USA
Agus Atmadipoera Examinateur Maˆıtre de conf´erence-Bogor
Agricultural University,INDONESIA
Ariane Koch-larrouy Directrice de Th´ese LEGOS-IRD,FRANCE
Florent Lyard Co-Directeur de Th´ese LEGOS-IRD,FRANCE
Philippe Gaspar Co-Directeur de Th´ese CLS,FRANCE
´
Ecole doctorale et sp´ecialit´e :
SDU2E : Oc´ean, Atmosph`ere, Climat
Alhamdulillahirabbil alamiin... The work presented in this thesis was a huge collaborative effort from Ministry of Marine Affairs and Fisheries-Indonesia (MMAF), Institut Fran¸cais In-donesia, Collecte Localisation Satellites(CLS)-France, Laboratoire d’Etudes en G´eophysique et Oc´eanographie Spatiales(LEGOS)-France, MERCATOR Ocean-France and University of Paul Sabatier-France. As a result of the large number of contributing parties, I apologize for to those whose names may be unintentionally omitted.
My sincerest gratitude goes to my advisors, first to my major advisor Dr.Ariane Koch-Larrouy for her patience and encouragement to achieve my best and for guiding me through the research presented in this thesis. Secondly, thanks to Dr.Florent Lyard as my second advisor, his insight, his beyond text book numerical skills have continuously inspired me. Thirdly thanks to Dr.Philippe Gaspar for his encouragement and support throughout my PhD study.
I would like to express the deepest appreciation to Mr. Berny Achmad Subki, Dr.Aryo Hang-gono, Dr.Aulia Riza, Mrs.Yenung Secasari, Prof Dietrich Bengen(IPB), Prof Ita Widowati(UNDIP), Dr.Vincent Siregar(IPB) for all their support during the INDESO scholarship program. Ap-preciation is further extended to my colleagues at Agency for Marine Research and Fisheries (BALITBANG-KP) specially to Teja Arief, Elvan Ampou, Marza Ihsan, Nurazmi Ratna, Rinny Rahmania, Niken Gusmawati, Budi Gunadharma, Romy Adrianto, Indra Hermawan, Iis Triyu-lianti, Dendy Mahabror, Falia Maunantia, Bambang Adithya, Nurman Mbay, Pak Usep Nas-rudin, Pak Imam, Pak Dono, Mba Titi Lestari and Mas Hilman Ramadhan.
I am especially grateful to my jury and reviewer members, Thanks to Prof. Eric Chassignet, Dr.Janet Sprintall as my thesis reviewer for their careful review of my manuscript, and for the comments, corrections and suggestions that ensued. Thanks to Prof Isabelle Dadou, Prof Brian Arbic and Dr.Agus Sholeh Atmadipoera for assisting me during my thesis defense.
The most important part of my time at LEGOS,CLS and MERCATOR has been knowing such an incredible group of scientist and administrative team. I feel very fortunate to have been part of them and would like to thank to Sara Fleury(LEGOS), Florence Bouille(CLS), Benoˆıt Tran-chant(CLS), Jerome Chanut(Mercator),Guillaume Reffray(Mercator), Rachid Benshila GOS), Damien Allain(LEGOS), Julien Jouanno (LEGOS), the ECOLA research team (LE-GOS), GESSEC LEGOS(Martine Mena, Nadine Lacroux, Brigite Cournou Agathe Barithaud) and the head of LEGOS Dr.Alexandre Ganachaud. And thanks to my friends in LEGOS: Ma-rine Bretagnon, Cory Pegliasco, Kevin Gueriero, MaMa-rine Rog´e, Michel Tchilibou, Dac Nguyen, for your friendship and surprise gift after my defense.
I would like also to thank each of those who touched my life, making Toulouse as a such a wonderful home for me. ”Terima kasih” to PPI Toulouse (Indonesian Student Association in Toulouse) and Ibu Ninik, Ibu Yunah, Ibu Bintang from AAI(Franco-Indonesian Association).
A special thanks to my lovely pretty wife, Munky Andi Kasim, my adorable daughters Azkanayra Zaida Nugroho and Azraina Zahira Nugroho for your warm hugs and kiss everyday and also my brother,my brother in-law, my sister and my sister in-law.
Finally, I dedicate this thesis to my parents Rachmat Musa and Titiek Lasmiyati and my parents in-law Nash Andi Kasim and Jenny Loenggana. I can never thank them enough for all that they have given me ...Thank you.
In the Indonesian seas, large tidal currents interact with the rough topography and create strong internal waves at the tidal frequency, called internal tides. Part of them will eventually propagate and dissipate far away from generation sites. Their associated mixing upwells cold and nutrient-rich water that prove to be critical for climate system and for marine resources. This thesis uses the physical ocean general circulation model, NEMO, as part of the INDESO project that aims at monitoring the Indonesian marine living resources. Models not taking into account tidal missing are unable to correctly reproduce the vertical structure of watermasses in Indonesian seas. However, taking into account this mixing is no simple task as the phenomena involved in tidal mixing cover a wide spectrum of spatial scales. Internal tides indeed propagate over thousands of kilometres while dissipation and mixing occurs at centimetric to millimetric scales. A model capable of resolving all these processes at the same time does not exist. Until now scientists either parameterised the tidal mixing or used models which only partly resolve internal tides. More and more scientists introduce explicit tidal forcing in their models but without knowing where the energy is going and how the internal tides are dissipated. This thesis intends to quantify energy dissipation in NEMO forced with explicit tidal forcing and compares it to the dissipation induced by the currently used parameterization. This thesis also provides new results about the quantification of the tidal energy budget in NEMO. I first contributed to an INDESO study that aimed at validating the model against several observation data sets. In a second and third study, I investigated the mixing produced in the model by explicit tidal forcing and its impact on water mass. Explicit tides forcing proves to produce a mixing comparable to the one produced by the parameterization. It also produces a significant cooling of 0.3 °C with maxima reaching 0.8°C in the areas of internal tide generation. The cooling is stronger on austral winter. The spring tides and neap tides modulate this impact by 0.1°C to 0.3°C. The model generates 75% of the expected internal tides energy, in good agreement with other previous studies. In the ocean interior, most of it is dissipated by horizontal momentum dissipation (19 GW), while in reality one would expect dissipation through vertical possesses. This value is close to the dissipation induced by the parameterization (16 GW). The mixing is strong over generation sites, and only 20% remains for far field dissipation mainly in the
Banda and Sulawesi Seas. The model and the recent INDOMIX cruise [Koch-Larrouy et al. (2015)], which provided direct estimates of the mixing, are surprisingly in good agreement mainly above straits. However, in regions far away from the energy generation sites where INDOMIX found NO evidence of intensified mixing, the model produces too strong mixing. The bias comes from the lack of specific set up of internal tides in the model. More work is thus needed to improve the modeled dissipation, which is a theme of active research for the scientific community. I dedicated the last part of my thesis to the quantification of tidal energy sinks in NEMO. I first worked on a simple academic case: the COMODO internal tides test case, which analyses the behaviour of a vertically stratified fluid forced by a barotropic flow interacting over an idealized abyssal plain/slope/shelf topography without bottom friction. The results of the finite element T-UGOm hydrodynamic model are compared with those of NEMO. The central issue in calculating tidal energy budget is the separation of barotropic and baroclinic precesses. To this aim we developed an original method based on the projection on vertical modes. At first glance, this method compares well with the classical method of separation using the vertically averaged current. However, when looking into more details at energy budgets, vertical modes allow a cleaner and more realistic separation between barotropic and baroclinic tides. This precision will be very useful for the future SWOT mission. Also this method of separation allows quantification of the energy associated with each mode. This allowed us to identify an important bias in NEMO: The higher the mode is the shorter the NEMO wavelengths become compared to the T-UGOm wavelengths. NEMO also produces a strong numerical mixing that erodes the barotropic tides on the abyssal plain, where there is no bottom friction. The best suspect might be the 2D/3D coupling scheme implied by the NEMO’s time splitting. This work pinpoints areas for reflection and investigation to improve how the model takes into account internal tides dissipation. Based on our separation method, work is in progress to better quantify tidal energy budget in the Indonesian Seas.
Keywords : INDESO, internal tides, mixing,NEMO,water masses transformation,normal
Les mers Indon´esiennes sont le si`ege de tr`es fort courants de mar´ee qui interagissent avec la topographie pour cr´eer des ondes internes `a la fr´equence de la mar´ee que l’on appelle mar´ee in-terne. Certaines d’entres elles, vont se propager et se dissiper loin des sources de g´en´eration. Le m´elange associ´e provoque la remont´ee d’eau plus froide et plus riche en nutriments en surface qui influence le climat tropical et toute la chaine des ´ecosyst`emes marins. Surveiller les ressources marines est l’objectif du projet INDESO, dont cette th`ese fait partie et qui utilise le mod`ele physique de circulation g´en´erale NEMO. Les mod`eles qui ne prennent pas en compte le m´elange induit par la mar´ee interne ne sont pas capables de reproduire les masses d’eau en Indon´esie. Mais prendre en compte ce m´elange n’est pas facile. En effet, le r´esoudre enti`erement n’est pas possible car les ´echelles concern´ees par les diff´erents processus des ondes internes varient de plusieurs milliers de kilom`etres (propagation) `a quelques centim`etres/millim`etres (dissipation). De plus en plus de scientifiques introduisent le for¸cage de la mar´ee dans leur mod`ele mais sans savoir o`u va l’´energie et comment les ondes sont dissip´ees. Dans cette th`ese nous cherchons `a proposer des outils et des d´ebuts de r´eponses pour participer `a une meilleure compr´ehension de la dissipation des ondes internes dans le mod`ele de circulation g´en´erale d’oc´ean NEMO. J’ai, tout d’abord, contribu´e `a une ´etude d’INDESO sur la validation de NEMO grˆace `a de nombreux jeu de donn´ees. Ensuite, j’ai cherch´e `a quantifier et `a qualifier le m´elange induit par l’introduction de la mar´ee explicite dans le mod`ele, ainsi que son impact sur les masses d’eau. La transformation de masses d’eau induite par la mar´ee explicite est comparable `a celle produite par la param´etrisation des ondes internes g´en´eralement utilis´ee dans les mers Indon´esiennes. Il produit un refroidissement de surface de 0.3°C avec des maxima atteignant 0.8°C au niveau des sites de g´en´eration des ondes internes. Le climat et les ressources marines seront certainement sensibles `a ces refroidissements survenant `a la fr´equence de la mar´ee. Le mod`ele reproduit 75% de l’´energie attendue de g´en´eration des ondes internes, en bon accord avec des ´etudes pr´ec´edentes. L’essentiel de la dissipation a lieu horizontalement (19GW), alors que, dans la r´ealit´e, on s’attend principalement `a une dissipation r´ealis´ee grˆace `a des processus verticaux. Cette valeur est proche de celle induite par la param´etrisation couramment utilis´ee (16GW). Quant `a la structure spatiale, l’´energie se dissipe essentiellement localement, au dessus des sites
de g´en´eration, et seulement 20% de l’´energie se propage avant d’ˆetre dissip´ee en aval des sites de g´en´eration, principalement dans la mer de Banda et la mer du Sulawesi. Le mod`ele, au dessus des zones de g´en´eration, est de fa¸con surprenante en tr`es bon accord avec les mesures in situ de dissipation obtenues lors de la campagne INDOMIX [Koch-Larrouy et al. (2015)]. Par contre, dans les r´egions distantes des sources de g´en´eration, le mod`ele surestime le m´elange par rapport aux observations d’INDOMIX. Ce biais vient principalement du fait qu’il n’y a aucune prise en compte des processus associ´es `a la dissipation des ondes internes dans le mod`ele. Ce point pr´ecis est un th`eme de recherche actif au sein de la communaut´e scientifique. Dans la derni`ere partie de cette th`ese j’ai commenc´e `a apporter des ´el´ements de r´eponse `a la quantification des puits d’´energie dans NEMO. J’ai pour cela travaill´e avec le cas test COMODO, qui est une section d’un fluide stratifi´e constitu´ee d’une plaine abyssale, d’un talus et d’un plateau, forc´ee par la mar´ee et sans friction de fond. Le mod`ele T-UGOm, un mod`ele hydrodynamique de mar´ee avec une grille en ´el´ements finis, est compar´e au mod`ele NEMO. Dans ce cadre, nous avons d´evelopp´e une m´ethode originale pour s´eparer la mar´ee barotrope de la mar´ee barocline. Elle repose sur la projection en modes normaux. Cette m´ethode donne, `a premi`ere vue, des r´esultats similaires `a ceux obtenus grˆace `a la m´ethode plus classique de soustraction par la moyenne verticale. Cependant, lorsque l’on regarde plus en d´etail les diagnostiques d’´energie on trouve que la m´ethode de projection en modes normaux offre une plus grande pr´ecision et un plus grand r´ealisme pour s´eparer la mar´ee barotrope de la mar´ee barocline. Cette pr´ecision sera tr`es utile pour les futures missions SWOT. Par ailleurs, cette m´ethode donne acc`es `a la d´ecomposition d’´energie mode par mode et nous a permis d’identifier certains biais. Plus on monte dans des modes ´elev´es plus les longueurs ondes se raccourcissent dans NEMO par rapport `a T-UGOm. Par ailleurs, NEMO dissipe la mar´ee barotrope dans la plaine abyssale, alors qu’il n’y a explicitement pas de friction. Ce ne peut pas ˆetre la diffusion verticale ou horizontale qui est `a l’œuvre ici, car il n’y a pas de raison physique pour une diffusion sur un fond plat. Le meilleur candidat pour expliquer cette diffusion serait le couplage 2D/3D du time splitting de NEMO. Ce travail offre des pistes de recherche nouvelles pour am´eliorer la prise en compte de la mar´ee dans les mod`eles de circulation g´en´erale. Un travail est en cours pour appliquer cette m´ethode sur l’ensemble de l’archipel Indon´esien.
Mots Cl´es : INDESO, mar´ee interne, m´elange, NEMO, transformation de masses d’eau,
List of Abbreviations v
1 Thesis introduction 1
1.1 Introduction . . . 1
1.1.1 The context of the INDESO project . . . 1
1.1.2 The context of this thesis . . . 3
1.2 Introduction(in French) . . . 6
1.2.1 Le contexte du projet INDESO . . . 6
1.2.2 Le contexte de cette th`ese . . . 7
2 Scientific context 13 2.1 The indonesian archipelago a unique region of the world . . . 14
2.2 Topography and The Indonesian Through Flow . . . 15
2.3 Surface Properties . . . 17
2.4 Barotropic and Internal Tides in Indonesian Seas . . . 19
2.4.1 Barotropic tides . . . 19
2.4.2 Internal tides . . . 22
2.5 Mixing and Watermass Transformation . . . 24
3 Evaluation of an operational ocean model configuration at (1/120) spatial resolution for the Indonesian seas - Part 1: Ocean physics (published article) 29 3.1 Introduction . . . 30
3.2 Scientific paper : . . . 31
4 Modelling Explicit tides in the Indonesian seas: an important process for surface sea water properties (accepted article) 61 4.1 Introduction . . . 62
4.2 Scientific paper : . . . 63
5 Mixing induced by explicit tides in a realistic simulation of the Indonesian
5.1 Mixing induced by explicit tides in a realistic simulation of the Indonesian Seas . 79
5.1.1 Introduction . . . 79
5.1.2 The internal tides in the Indonesian Seas . . . 80
5.2 Methods and Data . . . 82
5.2.1 Model and Simulations . . . 82
5.2.2 Numerical experiments . . . 83
5.2.3 FES2014 numerical simulation . . . 83
5.2.4 INDOMIX in-situ data . . . 84
5.2.5 Generation rate . . . 84
5.2.6 Dissipation rate . . . 85
5.3 Results . . . 87
5.3.1 Impact on water mass . . . 87
5.3.2 Semidiurnal and diurnal tides . . . 87
5.3.3 Generation of baroclinic tides . . . 88
5.3.4 Propagation of baroclinic tides . . . 90
5.3.5 Dissipation . . . 91
5.3.6 Comparison to in-situ estimates . . . 94
5.3.7 Spring tides and neap tides . . . 95
5.4 Summary . . . 96
5.5 Discussion/perspective . . . 99
5.6 Figures . . . 100
5.7 Tables . . . 110
6 Tidal Energy Budget Controversy. (Paper to be submitted) 125 6.1 Introduction . . . 126
6.2 Barotropic and baroclinic tides definition . . . 129
6.3 Vertical Modes Decomposition . . . 131
6.3.1 Momentum and continuity equation in vertical modes . . . 131
6.3.2 Pressure and vertical velocity modes . . . 134
6.3.3 Horizontal velocity modes . . . 141
6.3.4 Internal tides special case . . . 142
6.3.5 Practical decomposition on vertical modes . . . 143
6.4 Models description . . . 146
6.5 Barotropic/baroclinic separation . . . 154
6.5.1 Principles . . . 155
6.5.2 Depth-averaging separation approach . . . 158
6.5.3 Vertical modes separation approach . . . 159
6.6 Tidal energy diagnostics . . . 160
6.6.1 Time-average energy budget . . . 160
6.6.2 Depth-averaging separation approach . . . 164
6.6.3 Vertical modes separation approach . . . 167
6.7 Numerical COMODO internal tide test case . . . 168
6.7.1 Test case description . . . 168
6.7.2 Numerical model configuration . . . 172
6.7.3 Internal tides simulations . . . 173
6.7.4 Energy budget . . . 178
6.7.5 Modal decomposition versus depth-averaging decomposition . . . 181
6.8 Conclusions . . . 182
7 Conclusion 201 7.1 Conclusion . . . 201
7.2 Conclusion (in French) . . . 205
8 Discussion/perspective 209 8.1 Discussion/perspective . . . 210
AFD . . . Agence Fran¸caise de D´eveloppement
CIS . . . Central Information System
CLS . . . Collecte Losalisation Satellites
COMODO . . . COmmunity MODelling Ocean
ECMWF . . . European Centre for Medium-Range Weather Forecasts
EEZ . . . Exclusive Economic Zone
ENSO . . . El Nino Southern Oscillation
FES . . . Finite Element Solution
GLS . . . Generic Length Scale
IA . . . Indonesian Achipelago
INDESO . . . Infrastructure Development For Space Oceanography
INSTANT . . . International Nusantara Stratification and Transport
ITCZ . . . Inter Tropical Convergence Zone
ITF . . . Indonesian Through Flow
IUU . . . Illegal Unregulated Unreported
LEGOS . . . Laboratoire d’´Etudes en G´eophysique et Oc´eanographie Spatiales
MMAF . . . Ministry of Marine Affaires and Fisheries
MODIS . . . Moderate-Resolution Imaging Spectroradiometer
NEMO . . . Nucleus for European Modeling of the Ocean
NPIW . . . North Pacific Intermediate Water
NPSW . . . North Pacific Subtropical Water
OGCM . . . Ocean General Circulation Model
PISCES . . . Pelagic Interactions Scheme for Carbon and Ecosystem Studies
PSU . . . Practical Salinity Unit
SAR . . . Synthetic Aperture Radar
SEAPODYM . . . Spatial Ecosystem and Populations Dynamics Model
SEC . . . South Equatorial Current
SLA . . . Sea Level Anomaly
SPSW . . . South Pascific Subtropical Water
SSH . . . Sea Surface Height
SST . . . Sea Surface Temperature
SV . . . Sverdrup
SWOT . . . Surface Water and Ocean Topography
Chapter 1
Thesis introduction
1.1
Introduction
1.1.1
The context of the INDESO project
The Indonesia, with its 17000 islands is the largest archipelagic country in the World. In-donesian archipelago lies at the heart of the Coral Triangle and is one of the most important reservoirs of marine biodiversity on the planet [Allen and Werner (2002); Mora et al. (2003)]. 70% of the world coral species is found in this region [Veron et al. (2009)]. The region pro-vides several billion dollars of annual revenue through fisheries, aquaculture and tourism, with fishing and aquaculture employing almost 50 million people. Tuna fisheries are a major eco-nomical sector in Indonesia. If sustainably exploited, Indonesian seas represent a most valuable source of profit and employment. The need of monitoring and forcasting is thus vital. Work has to be done to develop sustainable use of the Indonesian marine resources while preventing unsustainable or illegal practices that undermine these resources.
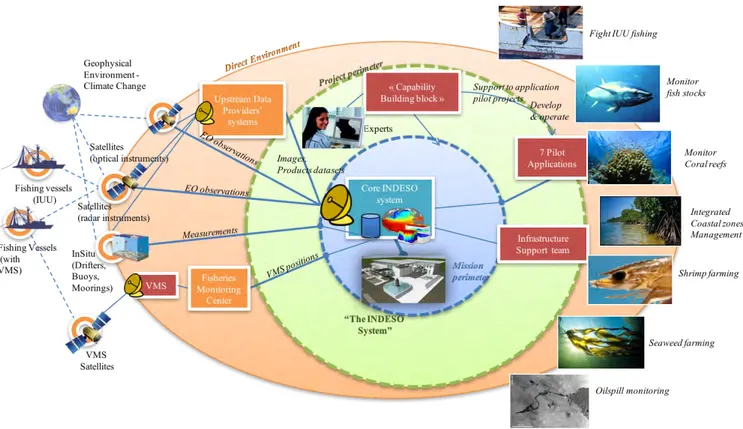
This is the main objective of the INDESO project (2013-2017), funded by the Ministry of Marine Affairs and Fisheries (MMAF) of the Republic of Indonesia. To achieve this goal, INDESO has implemented a “core system” made of 3 components:
1) A satellite receiving station to operationally acquire and process SAR images. These images are used for detecting and deterring IUU fishing activities, and to monitor oil spills.
2) A suite of numerical ocean models NEMO [Madec (2008)] and PISCES [Aumont (2004)], forced by satellite and in-situ data to monitor and forecast the evolution of the ocean circula-tion and biogeochemistry in the Indonesian EEZ. These models are also used to drive a tuna population dynamics model SEAPODYM [Lehodey et al. (2008)] simulating the evolution of the regional distribution and abundance of skipjack, yellowfin and bigeye tuna.
3) A central information system (CIS) acquiring all data produced by the satellite receiving station, the ocean models, the fish population dynamics models and high-resolution imagery obtained from various commercial satellites.
All data are distributed to authorized users through a Web portal. Based on this core system, INDESO aims at providing indispensable information allowing sustainable use of marine re-sources in Indonesia. INDESO more specifically focuses on seven key application domains (see figure 1.1): Combating illegal fishing, Managing fish stocks (especially tuna), Monitoring and management of coastal regions and Marine Protected Areas, Monitoring and protection of coral reefs Monitoring and support to shrimp producers and industrial aquaculture, Monitoring and support to seaweed farming, Monitoring and prevention of oil spills.
The wind stress and the ocean tides are believed to be the only significant sources of mechanical energy driving the deep ocean mixing necessary to sustain the global overturning circulation [Wunsch and Ferrari (2004)]. The overall tidal energy budget is estimated to be about 3.5 TW. Tidal energy is provided by the astronomic bodies (Earth, Moon and Sun) through gravitational forces work. 2.6 TW of this (mostly barotropic) energy is dissipated through to bottom friction and 0.9 TW are converted into internal tides, which will further dissipate locally or after propagation.
Internal tides generation occurs in the area where barotropic flows interact with strong topo-graphic gradient and create isopycnal heaving at tidal frequency. Barotropic horizontal motions are converted into vertical velocities over the topography. Part of internal tides could dissipate and produce vertical mixing locally just after generation, or later after propagation.
Many studies try to quantify the energy generation of the internal tides. For the global ocean tidal hydrodynamic model with data assimilation [Lyard et al. (2006)] and through inverse calculation using altimeter data [Egbert and Erofeeva (2002)] indicates that 0.7 TW or roughly 25% – 35% of the barotropic M2 tidal energy is converted through internal tides generation. Barotropic hydrodynamical models are not capable to resolve explicitly internal tides, hence energy conversion is parameterized as a wave drag based on bottom topography slope and barotropic currents, acting as a barotropic energy sink [Lyard et al. (2006); Shriver et al. (2012); Buijsman et al. (2015)].
In the recent years, OGCMs have been used to estimate internal tides energy in realistic strati-fication [Niwa and Hibiya (2001a); Niwa (2004); Lorenzo (2006); Jan et al. (2007, 2008); Carter et al. (2008); Jan and Chen (2009); Zilberman et al. (2009); Arbic et al. (2010); Niwa and Hi-biya (2011); Carter et al. (2012); Kang and Fringer (2012a); Muller et al. (2012a); Shang et al. (2015); Nagai and Hibiya (2015)]. In that case, the model explicitly solves internal tides, with more or less accuracy. Indeed, the mechanism of internal tides dissipation is still highly con-troversial, however it is usually admitted that a great parts of the energy get finally converted into ocean mixing.
The proportion of barotropic tides energy converted into baroclinic tides has been discussed for a long time. Today, the precise quantification of internal tide generation (through energy budget computation) and the fate of internal tide energy remain open questions. This thesis constitutes a contribution to the investigation relative to these questions in the context of the
INDESO project.
The Indonesian archipelago is the only region of the world with strong internal tides generation in a semi-enclosed area. As a result, all of the internal (or baroclinic) tidal energy remains trapped locally inside the archipelago and is available for dissipation. Thus, the archipelago is one of the regions in the World with the largest internal tides generation (10% of the global value). As a results water mass is transformed when entering the archipelago producing colder and fresher thermocline water and saltier and colder surface water [Ffield and Gordon (1996);
Hautala et al. (2001); Koch-Larrouy et al. (2007)]. Vertical diffusivity of 1–2.10−4m2/s have
been estimates from observations to be necessary in order to explain the water mass transfor-mation in the archipelago [Ffield and Gordon (1992)].
Recently, the INDOMIX cruise provided direct estimates of internal tides mixing [Koch-Larrouy
et al. (2015)] with higher values (10−2m2/s) in the shallow and narrow passage (Ombai Strait
and Halmahera portals) in comparison to lower values in the inner Halmahera Sea (10−4m2/s)
or further away from generation sites (10−6m2/s) in the Banda Sea. This new results show
that the mixing induced by internal tides in the Indonesian archipelago is highly heterogeneous in space, with high values above straits and low values further away from generation sites. In addition, it demonstrates that internal tides mixing is also strong at the surface.
Modelling in the region is quite challenging because of the numerous processes acting and the very complex bathymetry. Koch-Larrouy et al. (2007), implemented a tidal parameterization adapted to the specificities of the Indonesian archipelago. Introduced in an Oceanic General Circulation Model (OGCM), this parameterization allows the model to better represent the properties of the water mass evolution in each sub-basin, in good agreement with the obser-vations [Koch-Larrouy et al. (2007)]. It produces heterogeneous vertical diffusivity as large as
10.10−4m2/s, with an average of 1.5.10−4m2/s. This is in quite good agreement with previous
estimates deduced from observations [Ffield and Gordon (1996)]. This suggests that the total energy input provided by the tidal parameterization has the right order of magnitude.
This tidal mixing parameterization also cools the sea surface by 0.5°C in annual average, which reduces the deep convection, and the rain activity (by 20%) [Koch-Larrouy et al. (2007, 2010); Sprintall et al. (2014)]. The impact on biological activity has not yet been studied, but it could be guessed from these results that the vertical mixing would have a significant impact on blooms of phytoplankton by upwelling water richer in nutrients at the surface.
fraction could dissipate in the far field. Also this dissipation may vary in time following the cycles of variability of the surface tides. Such limitations and the increase of resolution encour-age scientists to force their Ocean General Circulation Models (OGCMs) by the explicit tidal forcing (eg: in Indonesian seas: [Castruccio et al. (2013); Kartadikaria et al. (2011); Nagai and Hibiya (2015)], in Luzon : [Niwa and Hibiya (2001b); Jan et al. (2008); Wang et al. (2016); Alford et al. (2015)], in Global : [Niwa and Hibiya (2011); Arbic et al. (2012); Simmons et al. (2004); Shriver et al. (2012)]. The resolution of these models is generaly between 1 to 10 km. Niwa and Hibiya (2011) show that using a 9km ( 1/12°) resolution the model is able to generate only 75% of the internal tides. With a 4km ( 1/36°) resolution, the model generates 90% of the internal tides. With such relatively coarse resolution the processes involved in the dissipation of the internal tides can’t be resolved. However, studies in the Indonesian archipelago [Castruccio et al. (2013); Kartadikaria et al. (2011); Nagai and Hibiya (2015)] show that the addition of explicit tidal forcing produces mixing that improves the water mass, reproducing the homoha-line Indonesian Water. The question is how the model is able to create mixing when no specific parameterization is active in the model. Is it done at the correct rate along the lifetime of the internal tides?
In order to respond at these questions we performed simulations with and without tides and calculate the kinetic and potential energy dissipations. Validation of these tidal energy estimates are done using the INDOMIX recent cruise. But these estimates rely on the hypothesis that the physic induced by wind and hydrodynamic forcing is identical with and without tides, which may not be entirely true. Also the need of a precise tidal budget in NEMO is needed. The last part of this thesis work has been achieve in order to provide a method and diagnostics to better quantify the tidal energy budget in NEMO. The results are presented in this manuscript on a simple test case and some work is in progress to apply it over the Indonesian region.
The central issue in calculating tidal energy budget is the separation of barotropic and baroclinic processes, in terms of velocity and pressure. Although intuitive, this issue is nothing but trivial and needs to define precisely the meaning of ”barotropic dynamics” and ”baroclinic dynamics” terms. A universal, precise definition does not exist and still trigger some controversy among researchers. Kelly and Nash (2011) gives a revolutionary comprehension to show the complexities and the importance of barotropic and internal tides separation in order to remove spurious tidal energy budget. His study lead to incertitude of the common methods that has been first introduced by [Baines (1982)] and followed by researchers until now [Niwa and Hibiya
(2001a); Jan et al. (2008); Carter et al. (2008); Kang (2010); Zilberman et al. (2009); Niwa and Hibiya (2011); Jeon et al. (2014); Nagai and Hibiya (2015); Alford et al. (2015); Wang et al. (2016)].
The main objectives of the thesis are thus: Provide quantification of the energy generation, dissipation of the tides in NEMO over the Indonesian region; Establish the impact of the associated dissipation on water mass, surface cooling and its associated variability; Provide knowledge, tools and diagnostics to better describe the energy route of the tidal fields.
This thesis manuscript is organized as follows: Chapter 2 will first review the currentology, and hydrography, as well as the tidal properties of the Indonesian seas. The evaluation on the INDESO physical model is then presented in Chapter 3. Chapter 4 presents results on the effect on explicit tidal forcing on surface properties, while Chapter 5 shows a more detailed study that investigate the energy of generation and dissipation of the tides in the model. Chapter 6 presents the controversy on the tidal energetic calculation. Finally, the conclusions of this thesis are presented in Chapter 7, while a discussion and perspectives to this work are provided in Chapter 8.
1.2
Introduction(in French)
1.2.1
Le contexte du projet INDESO
Avec ses 17 000 ˆıles, l’Indon´esie, est le plus grand pays archip´elagique du monde. L’archipel indon´esien, au coeur du triangle de corail, est un des principaux r´eservoirs de la biodiversit´e marine au niveau mondial [Allen and Werner (2002); Mora et al. (2003)]. On y trouve 70% des esp`eces de corail connues [Veron et al. (2009)]. La pˆeche et l’aquaculture emploient pr`es de 50 millions de personnes et constituent, avec le tourisme, une source de revenu importante pour l’Indon´esie. La pˆeche thoni`ere, en particulier, est un secteur d’activit´e majeur. Si elles sont exploit´ees de fa¸con durables, les mers indon´esiennes repr´esentent donc une source de richesse et d’emploi inestimable. Il est donc indispensable de suivre et de pr´evoir leur ´evolution afin de pouvoir d´evelopper une exploitation durable des ressources marines, tout en contrˆolant et en d´ecourageant les activit´es ill´egales qui menacent ces ressources. C’est l’objectif principal du projet INDESO (2013-2017), financ´e par le minist`ere des Affaires maritimes et des Pˆeches de la R´epublique d’Indon´esie. Pour atteindre cet objectif, INDESO a mis en place un ”syst`eme central” compos´e de 3 composants:
op´erationnelle, des images SAR. Ces images sont utilis´ees pour d´etecter les activit´es de pˆeche ill´egales et les pollutions par hydrocarbures.
2) Une s´erie de mod`eles num´eriques d’oc´ean (NEMO [Madec (2008)] et PISCES, [Aumont (2004)], forc´es par des observations satellitaires et in situ pour simuler et pr´evoir l’´evolution de la circulation oc´eanique et de la bio-g´eochimie dans la ZEE indon´esienne . Les sorties de ces deux mod`eles sont ´egalement utilis´es pour forcer SEAPODYM [Lehodey et al. (2008)], un mod`ele de dynamique de la population simulant l’´evolution de l’abondance et la distribution spatiale des 3 principales esp`eces de thons exploit´ees en Indon´esie : la bonite, le thon jaune et le thon ob`ese.
3) Un syst`eme d’information central (CIS) qui stocke toutes les donn´ees acquises par la sta-tion de r´ecepsta-tion d’images satellitaires ou produites par les diff´erents mod`eles num´eriques. Le CIS distribue ´egalement ces donn´ees aux utilisateurs autoris´es grˆace `a un serveur Web. IN-DESO vise ainsi `a fournir des informations indispensables permettant une utilisation durable des ressources marines en Indon´esie. INDESO se concentre plus sp´ecifiquement sur sept do-maines d’application cl´es (voir figure 1.1): Lutte contre la pˆeche ill´egale, gestion des stocks de poissons (en particulier le thon), surveillance des r´egions cˆoti`eres et des aires marines prot´eg´ees, surveillance des r´ecifs coralliens, surveillance et support `a la crevetticulture et `a l’aquaculture industrielle, surveillance et support `a l’algoculture, surveillance des pollutions par hydrocarbu-res.
1.2.2
Le contexte de cette th`
ese
Le vent et les mar´ees sont les principales sources d’´energie m´ecanique provoquant le m´elange de n´ecessaire pour maintenir la circulation de retournement globale [Wunsch and Ferrari (2004)]. L’apport global d’´energie par la mar´ee est estim´e `a environ 3,5 TW. Cette ´energie est fournie par les corps astronomiques (Terre, Lune et Soleil) grˆace au travail des forces gravitationnelles. 2.6 TW de cette ´energie (principalement barotrope) est dissip´ee par frottement du fond et 0.9 TW sont convertis en mar´ees internes, qui se dissiperont localement ou apr`es propagation. La g´en´eration de la mar´ee interne se produit dans les zones o`u des ´ecoulements barotropes inter-agissent avec un gradient topographique fort et cr´eent un soul`evement isopycnal `a la fr´equence des mar´ees. Les mouvements horizontaux barotropes sont convertis en vitesses verticales sur la topographie. Une partie des mar´ees internes peut se dissiper et produire un m´elange vertical
localement juste apr`es la g´en´eration, ou plus tard apr`es la propagation. De nombreuses ´etudes tentent de quantifier la g´en´eration d’´energie li´ee aux mar´ees internes. Lyard et al. (2006), avec un mod`ele hydrodynamique de mar´ee global assimilant des donn´ees et Egbert and Erofeeva (2002), avec un calcul inverse utilisant des donn´ees altim´etriques, estiment que 0,7 TW ou environ 25% `a 35% de l’´energie de la composante barotrope de la mar´ee M2 est converti par g´en´eration de mar´ee interne. Les mod`eles hydrodynamiques barotropes n’´etant pas capables de r´esoudre explicitement la mar´ee interne, le transfert d’´energie vers la mar´ee interne y est param´etr´ee sous forme de frottement de fond li´e `a la pente du fond et `a la vitesse du courant barotrope [Lyard et al. (2006); Shriver et al. (2012); Buijsman et al. (2015)]. Au cours des derni`eres ann´ees, des mod`eles de circulation g´en´erale (OGCM) ont ´et´e utilis´es pour estimer l’´energie interne des mar´ees dans une stratification r´ealiste [Niwa and Hibiya (2001a); Niwa (2004); Lorenzo (2006); Jan et al. (2007, 2008); Carter et al. (2008); Jan and Chen (2009); Zilberman et al. (2009); Arbic et al. (2010); Niwa and Hibiya (2011); Carter et al. (2012); Kang and Fringer (2012a); Muller et al. (2012a); Shang et al. (2015); Nagai and Hibiya (2015)]. Dans ce cas, le mod`ele r´esout explicitement les mar´ees internes, avec plus ou moins de pr´ecision. En effet, le Dans ce cas, le mod`ele r´esout explicitement les mar´ees internes, avec plus ou moins de pr´ecision. En effet, le m´ecanisme de la dissipation interne des mar´ees est encore tr`es controvers´e, mais on admet g´en´eralement que qu’une part importante de l’´energie est dissip´ee par m´elange vertical. La proportion de l’´energie des mar´ees barotropes converties en mar´ees baroclines a ´et´e discut´ee depuis longtemps. Aujourd’hui, la quantification pr´ecise de la g´en´eration de la mar´ee interne et le devenir de l’´energie y associ´ee restent des questions ouvertes. Cette th`ese constitue une contribution `a l’enquˆete relative `a ces questions dans le cadre du projet INDESO. L’archipel indon´esien est la seule r´egion du monde avec une forte g´en´eration de mar´ees internes dans une zone semi-ferm´ee. En cons´equence, toute l’´energie de mar´ee interne (ou barocline) reste pi´eg´ee localement `a l’int´erieur de l’archipel et est disponible pour la dissipation. Ainsi, l’archipel indon´esien est l’une des r´egions du monde avec la plus grande g´en´eration de mar´ees internes (10% de la valeur globale). En cons´equence, les masses d’eau se transforment en en-trant dans l’archipel : les eaux profondes de la thermocline deviennent plus chaudes et moins sal´ees alors que les eaux de surfaces se refroidissent et deviennent plus sal´ees [Ffield and Gordon (1996); Hautala et al. (2001); Koch-Larrouy et al. (2007)]. Il a ´et´e estim´e qu’une diffusivit´e verticale de 1 `a 2 10-4 m2/s ´etait n´ecessaire pour expliquer la transformation des masses d’eau dans l’archipel [Ffield and Gordon (1992)]. R´ecemment, la croisi`ere INDOMIX a fourni des estimations directes du m´elange induit par la mar´ee interne [Koch-Larrouy et al. (2015)]. Des valeurs ´elev´ees de diffusivit´e (10−2m2/s) ont ´et´e mesur´ees dans des passages peu profonds et
la mer d’Halmahera (10−4m2/s) ou plus loin des sites de production (10−6m2/s) dans la mer
de Banda. Ces nouveaux r´esultats montrent que le m´elange induit par les mar´ees internes dans l’archipel indon´esien est tr`es h´et´erog`ene dans l’espace, avec des valeurs ´elev´ees au-dessus des d´etroits et des valeurs faibles plus loin des sites de production. En outre, il d´emontre que le m´elange interne des mar´ees est fort `a la surface. La mod´elisation des mers indon´esiennes est tr`es difficile en raison des nombreux processus qui agissent et de la bathym´etrie tr`es complexe. Koch-Larrouy et al. (2007) , a mis en place une param´etrisation des mar´ees adapt´ee aux sp´ecificit´es de l’archipel indon´esien. Introduite dans un OGCM, cette param´etrisation permet au mod`ele de mieux repr´esenter l’´evolution des propri´et´es de de la masse d’eau dans chaque sous-bassin, en accord avec les observations [Koch-Larrouy et al. (2007)]. Cette param´etrisation produit une diffusivit´e verticale h´et´erog`ene atteignant 10.10−4m2/s, avec une moyenne de 1.5.10−4m2/s.
Cela sugg`ere que l’apport ´energ´etique total fourni par la param´etrisation des mar´ees a le bon ordre de grandeur. Cette param´etrisation du m´elange des mar´ees refroidit ´egalement la surface de la mer de 0,5 ° C en moyenne annuelle, ce qui r´eduit la convection profonde et la pluviosit´e (de -20%) [Koch-Larrouy et al. (2007); Sprintall et al. (2014)]. L’impact sur l’activit´e biologique n’a pas encore ´et´e ´etudi´e, mais on peut penser que le m´elange vertical aurait un impact sig-nificatif sur les blooms de phytoplancton grˆace `a l’apport en surface d’eaux profondes riches en nutriments. Cependant, cette param´etrisation n’est qu’une premi`ere ´etape vers la prise en compte du m´elange induit par les mar´ees internes. En r´ealit´e, la dissipation ne se produit pas exclusivement localement mais une fraction de l’´energie peut se dissiper dans le champ lointain. Cette dissipation peut ´egalement varier dans le temps suivant les cycles de variabilit´e des mar´ees de surface. De telles limitations et l’augmentation de la r´esolution encouragent les scientifiques `a inclure dans leurs OGCM une mod´elisation explicte de la mar´ee (par exemple dans les mers indon´esiennes: [Castruccio et al. (2013); Kartadikaria et al. (2011); Nagai and Hibiya (2015)] ; `a Luzon : [Niwa and Hibiya (2001b); Jan et al. (2008); Wang et al. (2016); Alford et al. (2015)], au niveau global: [Niwa and Hibiya (2011); Arbic et al. (2012); Simmons et al. (2004); Shriver et al. (2012)]. La r´esolution de ces mod`eles se situe entre 5 et 10 km. Niwa and Hibiya (2011) montrent qu’en utilisant une r´esolution de 9 km ( 1/12 °), le mod`ele ne peut g´en´erer que 75% des mar´ees internes. Avec une r´esolution de 4 km ( 1/36 °), le mod`ele g´en`ere 90% des mar´ees internes. Avec une r´esolution relativement grossi`ere, les processus impliqu´es dans la dissipation des mar´ees internes ne peuvent pas ˆetre compl`etement r´esolus. Cependant, des ´etudes dans l’archipel indon´esien [Castruccio et al. (2013); Kartadikaria et al. (2011); Nagai and Hibiya (2015)] montrent que l’ajout d’un for¸cage de mar´ee explicite produit un m´elange
qui am´eliore la structure de la masse d’eau et reproduisent l’eau indon´esienne homohaline. La question est de savoir comment ce type de mod`ele peut cr´eer du m´elange en l’absence d’une param´etrisation sp´ecifique. Est-ce que cela se fait `a un taux correct pendant toute la dur´ee de vie des mar´ees internes? Afin de r´epondre `a ces questions, nous avons effectu´e une simulation avec mar´ee et une autre sans mar´ee. Nous avons ensuite compar´e la dissipation de quantit´e de mouvement et d’´energie potentielle dans ces 2 simulations. La validation de ces estimations de la dissipation est effectu´ee `a l’aide des r´esultats de la croisi`ere INDOMIX. Mais ces estimations s’appuient sur l’hypoth`ese que la physique induite par le for¸cage ´eolien et hydrodynamique est identique avec et sans la mar´ee, ce qui n’est probablement pas enti`erement vrai. De plus, le besoin d’un budget de mar´ee pr´ecis dans NEMO est n´ecessaire. Dans la derni`ere partie de cette th`ese, des travaux ont ´et´e r´ealis´es afin de fournir une m´ethode et des diagnostics permettant de mieux quantifier le budget ´energ´etique de la mar´ee dans NEMO. Les r´esultats sont pr´esent´es dans ce manuscrit sur un cas de test simple. Des travaux sont en cours pour l’appliquer sur la r´egion indon´esienne. Le probl`eme central dans le calcul du budget ´energ´etique de la mar´ee est la s´eparation des processus barotropes et baroclines, en terme de vitesse et de pression. Bien qu’intuitif, ce probl`eme est loin d’ˆetre trivial et n´ecessite une d´efinition pr´ecise de la dynamique barotrope et de la dynamique barocline. Une d´efinition universelle et pr´ecise n’existe pas et d´eclenche encore une certaine controverse parmi les chercheurs. Kelly and Nash (2011) propose une compr´ehension r´evolutionnaire de ces probl`emes afin de mettre en ´evidence la com-plexit´e et l’importance de la s´eparation barotrope/barocline dans le cadre de l’´etude du budget ´energ´etique de la mar´ee. Son travail questionne la validit´e des approches courantes introduites par Baines (1982) et suivies jusqu’`a pr´esent par la plupart des chercheurs [Niwa and Hibiya (2001a); Jan et al. (2008); Carter et al. (2008); Kang (2010); Zilberman et al. (2009); Niwa and Hibiya (2011); Jeon et al. (2014); Nagai and Hibiya (2015); Alford et al. (2015); Wang et al. (2016)]. Les principaux objectifs de cette th`ese sont donc de 1) Quantifier, dans NEMO, la production et la dissipation d’´energie li´ee `a la mar´ee dans les mers indon´esiennes 2) Etablir l’impact de la dissipation sur les masses d’eau simul´ees et sur le refroidissement en surface et sa variabilit´e 3) Fournir de nouvelles connaissances, des m´ethodes et des diagnostics permettant de mieux d´ecrire les processus de transfert d’´energie li´es `a la mar´ee.
Ce manuscrit de th`ese est organis´e comme suit: le chapitre 2 passe en revue la courantologie, l’hydrographie, et les mar´ees dans les mers indon´esiennes. L’´evaluation du mod`ele physique utilis´e dans INDESO est ensuite pr´esent´ee au chapitre 3. Le chapitre 4 ´etudie l’impact de la mod´elisation explicite de la mar´ee sur les propri´et´es de surface, tandis que le chapitre 5 pr´esente
Le chapitre 6 pr´esente la controverse existant sur le calcul du bilan en ´energie de la mar´ee. Les conclusions de cette th`ese sont pr´esent´ees au chapitre 7. Enfin, une discussion finale et les perspectives de ce travail sont fournies au chapitre 8.
Chapter 2
Scientific context
contents
2.1 The indonesian archipelago a unique region of the world . . . . . 14
2.2 Topography and The Indonesian Through Flow . . . . 15
2.3 Surface Properties . . . . 17 2.4 Barotropic and Internal Tides in Indonesian Seas . . . . 19
2.4.1 Barotropic tides . . . 19 2.4.2 Internal tides . . . 22
2.1
The indonesian archipelago a unique region of the
world
Indonesian Archipelago (IA) is the only area where two major oceans, the Pacific and the Indian, are connected near the Equator. The IA plays at least two important roles in the global ocean. The first, concerns its role in the climate system. It encompasses some of the warmest surface temperatures of the world ocean that drive intense atmospheric convection [Clement et al. (2005)] and is therefore able to influence climate on the global scale via atmospheric teleconnections [Neale and Slingo (2003)].
The atmospheric deep convection is the center of the Walker and Hadley Circulation and is one of the main driving forces of the tropical atmospheric circulation. The Indonesian Seas contribute to this deep convection as heat and moisture source [Kawamura and Matsuura (2003)]. As such, the volume of surface heat content in IA is known to impact the state of the Pacific and Indian oceans as well as air–sea exchange and gives influence to coupled ocean–climate system [Godfrey (1996); Lukas et al. (1996); Lee et al. (2002); Vranes et al. (2002); Jochum and Potemra (2008); Koch-Larrouy et al. (2010); Sprintall et al. (2014)].
The second important role is its oceanic pathway in the Pacific to Indian interocean exchange which is known as Indonesian Through flow (ITF) that transports 10–20 Sv of warm and fresh waters [Murray and Arief (1988); Fieux et al. (1994); Meyers (1996); Gordon and Fine (1996); Hautala et al. (2001); Molcard et al. (2001); Susanto and Gordon (2005); Sprintall et al. (2009)]. The IA bathymetry is very complex (see Figure. 2.1), with numerous narrow straits, shal-low submarine mounts and semi-enclosed basins with sharp shelf break down to 4000m depth (Sulawesi, Molucca and Seram Seas). IA is the only region of the world where strong internal tides remains trapped in the semi enclosed seas, so that a large amount of tidal energy remains available for vertical mixing [Koch-Larrouy et al. (2007, 2008)].
Vertical mixing within the Indonesian seas allow a very strong water mass transformation of the incoming Pacific waters into Indonesian water. Salinity maximums of the North Pacific Subtropical Waters (NPSW) of 34.8 PSU (practical salinity unit) and the South Pacific Sub-tropical Waters (SPSW) 35.4 PSU, are eroded during their residence in the Indonesian seas. The Indonesian water enterring into the Indian Ocean are characterized by a homohaline water mass with a salinity of 34.45 PSU. As a result, the tropical Indian Ocean thermocline is cooled and freshened by the ITF [Song and Gordon (2004); Gordon (2005)].
The INDESO model domain cover most of southeast asian waters including full part of IA. The
Bathymetry in Indonesian Archipelago is shown in figure 2.1. Model latitude varies from 150
south in Indian Ocean to pacific ocean in 220 north. Model longitude covers Andaman seas in
the west ( 950 East) to eastern Papua island in 1440 East.
The model region consists of more than 16000 islands and is lying over a complex bottom topography. Shallow bottom topography of less than 50 meters can be found in Java seas and Arafura seas whereas deep bottom topography of more than 6000 meters can be found in the Indian Ocean, the Pacific Ocean and in the interior of Banda Sea. The region is also formed by a complex coastline and many straits that create sharp topography gradient. Typical strong bottom gradient can be found in the region facing the Pacific ocean such as Luzon, Halmahera and Sangihe Straits and in the region facing to Indian Ocean such as Sunda, Lombok, Alas, Flores and Timor straits. In the interior seas, the topography is even more complicated as the small islands are current feature in this region.
The IA is the only low latitude upper passage in the global thermohaline circulation, known as the Indonesian Through Flow (ITF). To reach the interior of Indonesian seas, Pacific water must deal with deep gap along Phillipines and New guinea. The main entrance portals to the the interior seas are the Luzon straits, the Sangihe Straits and the Halmahera seas [Gordon and Fine (1996); Gordon (2005)]. ITF flow rate average is ranging from 10 - 15 Sv (1 Sv
≡ 106m3s−1)[Potemra (1999); Gordon (2005); van Aken et al. (2009); Gordon et al. (2010);
Wijffels et al. (2008)].
ITF transport has been measured from INSTANT program between 2004-2006 by deploying three years of moorings at 5 stations along the route : Lombok, Makassar, Lifamatola, Ombai and Timor straits. The ITF route from Pacific Ocean to Indian ocean can be divided into western and eastern route into the interior of IS and through south china seas via Luzon Strait and its total transport can be seen in figure 2.1.
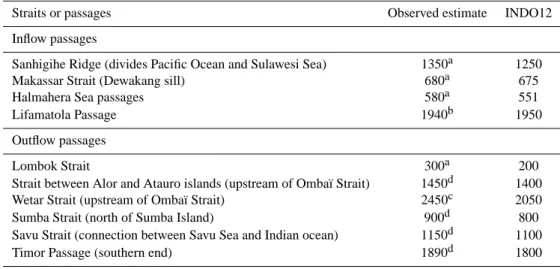
The western route mainly concerns North Pacific waters that flow through the Sulawesi Sea into the Makassar Strait. Within Makassar Strait, the 680 m deep Dewakang sill permits only the upper thermocline waters to enter the Flores Sea and flow eastward to the Banda Sea, or to directly exit into the Indian Ocean via the shallow (300 m) Lombok Strait. The transport in Makassar strait was measured 11,6 Sv southward direction [Gordon et al. (2010)].
Smaller contributions of Deeper Pacific water may also take an “eastern” route through the Maluku Sea and over the deeper (1940 m) sill of Lifamatola Strait into the Banda Sea. The 3-years mooring data in Lifamatola strait during INSTANT programme [van Aken et al. (2009)] reflect vigorous horizontal and vertical motion in the lowest 500m over the 2000m deep sill, with speeds regularly surpassing 100 cm/s. The strong residual flow over the sill in the passage and internal, mainly diurnal, tides contribute to this bottom intensified motion. The average volume transport of the deep throughflow from the Maluku Sea to the Seram Sea below 1250m is 2.5 Sv. At shallower levels, between 1250m and the sea surface, the flow is directed towards the Maluku Sea, north of the passage. The typical residual velocities in this layer are low ( 3cm/s), contributing to an estimated northward flow of 0.9–1.3 Sv. Finally as secondary entrance to the IA, South Pacific waters may enter through from Halmahera Sea, as well as water from fresh water Java.
Lombok Strait, Ombai Strait, and Timor Passage convey the full-depth transport and strat-ification profile of the ITF from the Pacific Ocean to the Indian Ocean [Sprintall et al. (2009)]. Total mean transport over the 3-year period is 2.6 Sv in Lombok Strait (i.e., toward the Indian Ocean), 4.9 Sv in Ombai Strait, and 7.5 Sv in Timor Passage. The transport in Timor Passage is nearly twice as large as historical estimates and represents half of the 15 Sv full-depth ITF transport that enters the Indian Ocean.
To first order, the seasonal cycle of transport in the thermocline (100–150 m) in all three exit straits is dominated by regional monsoon forcing, with maximum ITF during the southeast monsoon. During the northwest monsoon, the surface transport relaxes in Timor and weakly reverses in Ombai and Lombok, so the main core of the ITF is subsurface.
(in Sv, 106 m3/s). ITF net transport is of between 10 and 15 Sv. It passes through the shallow Makassar Strait (9 Sv), through the deep Lifamatola Strait (3 Sv). Another 0.5 to 1.5
Sv passes through Halmahera seas, and 0.5 to 1.5 through Java sea. 3 to 4 Sv flow out through the shallow Lombok Strait, and 8 to 9 Sv out distributed among the deep Savu,
Sumba, and Timor Straits [Gordon (2005); Talley and Sprintall (2005); van Aken et al. (2009); Sprintall et al. (2014)]. Bathymetry in 1/12 deg resolution interpolated from Etopo2
(www.ngdc.noaa.gov)
2.3
Surface Properties
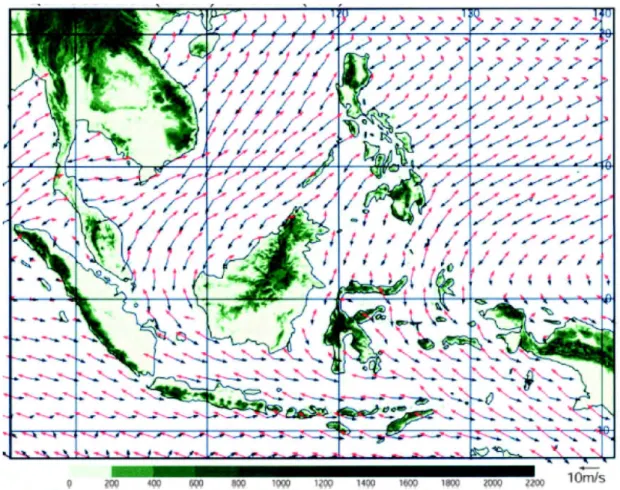
The IA experiences a seasonal cycle due to monsoonal winds (figure 1.2), with the principal rainy season centered on December- February (DJF), and the dry season peaking in July-August [Aldrian and Dwi Susanto (2003); Chang et al. (2005)]. The ITCZ (Inter Tropical Convergence Zone) follows this moonsonal cycle and is over the South China Sea from July to September, and is over the Sunda Island archipelago, dipping into northern Australia from January to March.
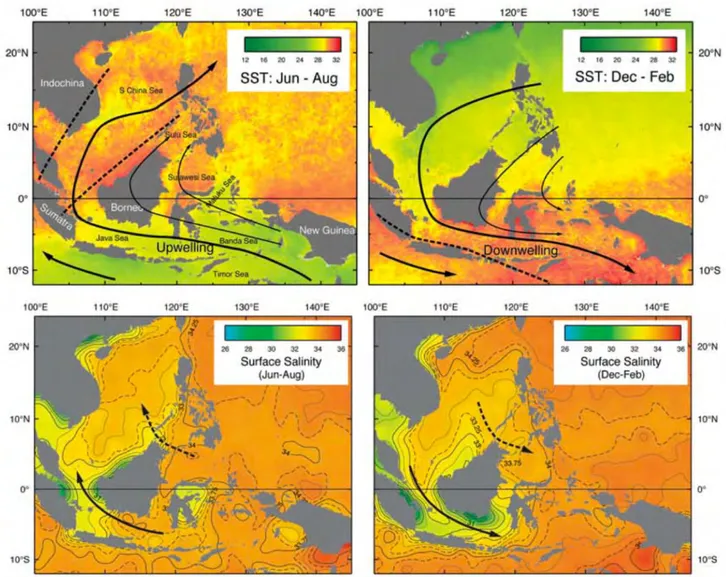
Monsoonal pattern of sea surface temperature and sea surface salinity is shown in figure 2.3. The monsoonal winds shift the lowest surface salinity into the Java Sea and Southern Makassar
Strait from January to March, and into the South China Sea from July to September.
Figure 2.2: Mean QuikSCAT wind for Jan (black) and Jul (red), and topography (m).[Chang et al. (2005)]
At the sea surface, the warmest waters also shift with the seasons: they are further north from July to September, and further south from January to March. In the austral summer (Dec, Jan, Feb), winds blow from the north. They are known as the north west monsoon winds and they bring cold air temperature and tend to cool SST in south china seas and north part of Indonesia. In summer season, the winds are coming from the south west and they tend to warm the SST in southern part of IA. In the Austral winter from June to August, SST is warmer in the northern part of IA, while over Australia the air temperature is colder during winter season. During southeast monsoon upwelling south of the Java islands, nusatenggara islands, and Banda Sea are seen.
Wind is the strongest sources that induced seasonal cycle in Indonesian archipelago. Sea surface salinity reveal the shifts of low salinity water in response to the monsoonal winds (black arrows) and precipitation patterns. The warm sea surface temperature (SST) of these seas serves as one of major sources of heat and moisture for the Austral SummerMonsoon [Kawamura and Matsuura (2003)] and small differences in the SST can lead to significant changes in the
(2010); Sprintall et al. (2014)].
Figure 2.3: Sea surface temperature (SST, top panels) and Sea Surface Salinity (SSS, bottom panels)(left: southeast monsoon; right: northwest monsoon) based on archived hydrographic
data.[Gordon (2005)]
2.4
Barotropic and Internal Tides in Indonesian Seas
2.4.1
Barotropic tides
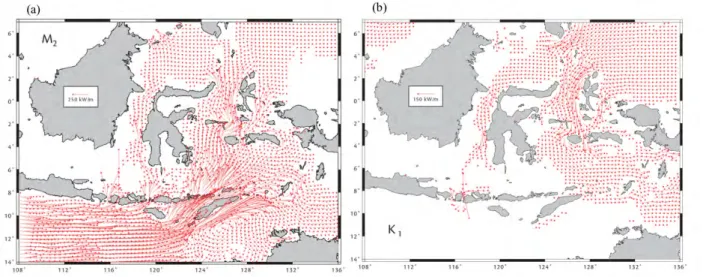
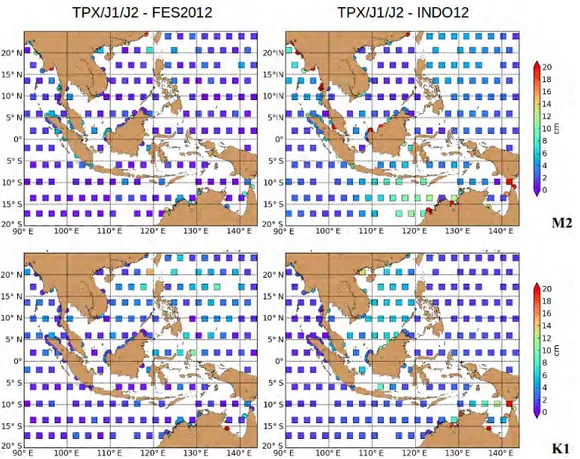
Egbert and Erofeeva (2002) assimilated Topex/Poseidon altimeter data into a global barotropic model by using the method of a generalized inversion scheme. The Semidiurnal M2 constituents is the largest semidiurnal tidal influence in IA. Map of M2 tides from model-observation can be seen in figure 2.4(left).
From the co-tidal phase contour, the propagation of semidiurnal tides is dominated from Indian Ocean into the interior of Indonesian seas. Amplitude varies between 20 cm to 50 cm in the open ocean where the lowest amplitude (less than 10cm) is found in the South china sea and Java sea. Semidiurnal tides have lower amplitude in the Pacific ocean and enter the Indonesian seas by Luzon strait and Halmahera Sea.
Concerning the diurnal tides, K1 is the largest one in the IA. Map of K1 from the model from the model and observations can be seen in figure 2.4(right). In contrast with M2, the tidal pattern in K1 is simpler. Tidal height range from 10 cm in the open seas to 40 cm in the interior seas. High tidal amplitude up to 65 cm is found in the continental shelf, where in particular in Karimata Strait, Sunda Shelf and northwestern Australia coast. From the phase lag contours, we can sea that K1 is mainly passing from Pacific Ocean through IA through Sangihe Strait and Halmahera Sea. M2 is coming from the Indian Ocean, passes along the shore of the Java Island and enters to the interior seas through the Nusa Tenggara islands, Ombai and Timor straits. High amplitudes are found in Indian ocean before entering inner Indonesian seas.
K1(right) for sea surface amplitude (top) and greenwich phase lags (bottom). Charts are based on ten years of sea-level measurements from the Topex/Poseidon satellite altimeter into
Figure 2.5: Mean barotropic energy flux vectors for the M2 (left). Mean barotropic energy flux vectors for the M2 tiden(right). Fluxes smaller than 20 kW m-1 are not drawn. Figure is
copied from Egbert and Erofeeva (2002).
The mean M2 barotropic energy flux can be seen in figure 2.5. The figure show that M2 is mainly coming from the Indian ocean, while K1 is coming from the Pacific. The barotropic M2 flux enter the interior IA through the islands of Nusa Tenggara and Flores. It is amplified when entering narrow strait such as Lombok strait, Alat strait 10 150 kW m-1 and exceeding 500 kW m-1 in Ombai and Timor strait. K1 barotropic flux is higher in Sangihe and Lifamatola straits.
2.4.2
Internal tides
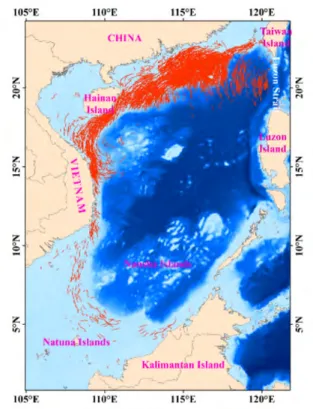
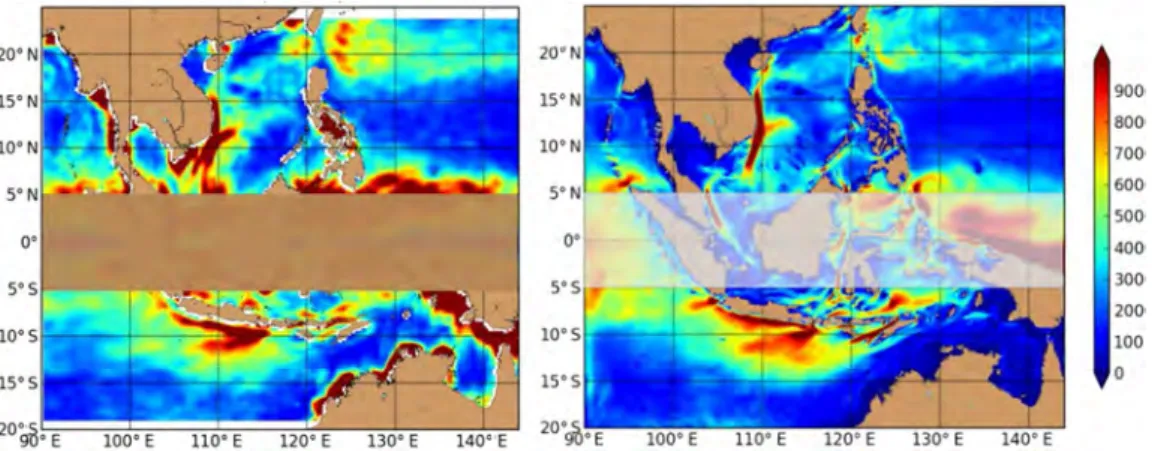
The INDESO domain covers regions with strong internal tides generation. Indeed, regions that have been reported as sources of internal tides are : Lombok strait, Halmahera seas, Sangihe strait, Sulu straits, Ombai strait, Makassar strait and Luzon strait [Mitnik et al. (2000); Aiki et al. (2011); Sari Ningsih (2008); Susanto et al. (2005); Matthews et al. (2011); Robertson and Ffield (2005, 2008)]. Vertical displacement induced by Internal tides can reach up to 150m in 5 min. This strong vertical heaving may supply nutrients from the deep ocean that nourish coral reefs and pilot whale populations that forage in their wakes [Moore and Lien (2007); Jan and Chen (2009); Alford et al. (2015)]. The surface signature from internal tides in IA is detected from Moderate Resolution Imaging Spectroradiometer (MODIS) satellite with the SAR images [Jackson (2007)] The example of captured internal tides from MODIS image data is shown in Figure 2.6. Three selected ”less cloud cover” image were captured in South China Sea, Sulawesi Sea and Banda Seas. In Sulawesi Sea, there are packets of internal tides propagated to the west
propagate to southeast coming from the generation site of Sibutu Strait. In the South China sea, the internal wave packets is coming from the northern Luzon strait. Finally, internal tides in Banda seas are coming from the Ombai strait.
Figure 2.6: True-color MODIS image of (a) the Sulawesi Sea acquired on 6 March 2006 at 5:25 (b) the southwestern South China Sea acquired on 6 March 2003 at 3:20 UTC (c) the Banda Sea acquired on 24 February 2004 at 5:05 UTC. (more details in Jackson (2007)
Internal tides surface signature is also detected in Luzon strait from ENVISAT ASAR images and some ERS-2 SAR images from 2005 to 2010 [Wang et al. (2011)]. Internal waves not only occur in the Northern South China Sea (between Luzon Strait and Hainan Island), but are also found in Western South China Sea (along the Vietnamese coast) and Southern South China Sea as shown in figure 2.7.
The internal tides coming from the Luzon Strait on the eastern margin of the South China Sea are the largest waves documented in the global oceans [Alford et al. (2015)]. They shoal onto the continental slope to the west, the downward displacement of the ocean’s layers associated with these solitary waves can exceed 150 meter in 5 min [Ramp et al. (2004)].
Figure 2.7: The spatial distribution map of internal waves in South China Sea from 2005 to 2010 from Wang et al. (2011)
2.5
Mixing and Watermass Transformation
Many previous studies have suggested that the most likely factor causing the strong water mass transformation in the IA would be the internal tides and their associated mixing [Schiller (2004); Hatayama (2004); Robertson and Ffield (2005)]. IA is the only region of the world where strong internal tides remain trapped in semi-enclosed seas, so that a large amount of tidal energy remains available for vertical mixing [Schiller (2004); Alford et al. (1999); Koch-Larrouy et al. (2008, 2007); Robertson and Ffield (2008); Robertson (2010); Nagai and Hibiya (2015)].
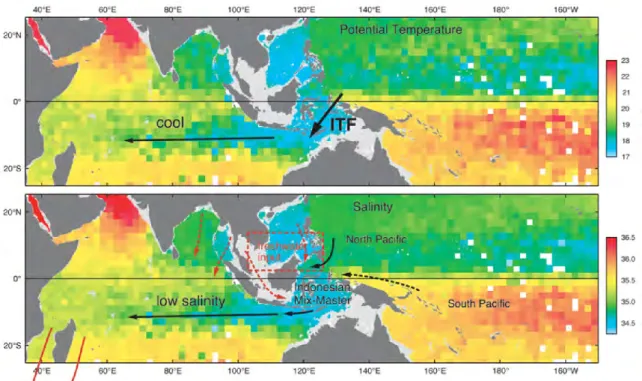
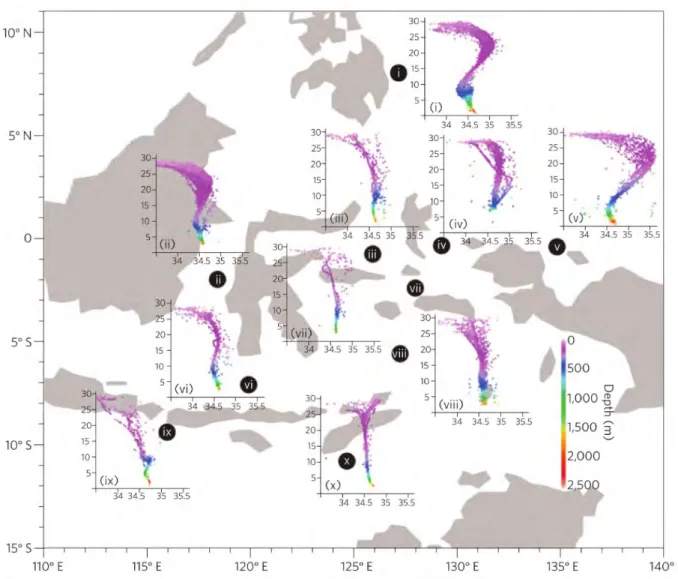
Temperature and salinity distributions within Indian ocean thermocline depth (figure 2.3) depict that the IA acts as a ”mix master” that cools and freshen the thermocline water from Pacific Ocean [Gordon and Fine (1996); Gordon (2005)]. Watermass transformation looking at Temperature Salinity diagrams within the IA is shown Figure 2.9. The NPSW found in the
contrast, the SPSW found in the South Pacific input box is characterized by a higher salinity
maximum of around 35.45 psu and the temperature reaches 21.50C. Strong vertical mixing in
IS forms the unique, nearly homohaline ITF profile in Indian Ocean, with a salinity of 34.45 PSU. It is interesting to note that SPSW has lost the signature of the salinity maximum already in the Seram Sea, suggesting that most of the mixing must occur in the Halmahera and Seram Sea.
First estimates of the integrated vertical mixing in the IA has been done using in-situ water mass properties and a simple advection–diffusion model [Ffield and Gordon (1992)].
They show that a mixing ten times larger than in the open ocean (Kz ≈ 10−4m−2s−1) was
necessary in order to reproduce the water-mass transformations. Estimates from microstructure measurements in the Indonesian Archipelago was carried out by [Alford et al. (1999)] in Banda
seas indicating only weak vertical mixing Kz ≈ 10−5m−2s−1 in the upper 300 m. The first
microstructure and finestructure estimates of the mixing in the regions of high internal tide generation in the Indonesian archipelago were carried out by [Koch-Larrouy et al. (2015)] during the INDOMIX 2010 cruise. They show that mixing is very heterogeneous with very high values
of Kz ≈ 10−2m−2s−1 (station 1, 3, 5 figure 2.10) in regions of generation. In contrast, region
further away from generation sites (station 2 and 4, figure 2.10) depict smaller or inexistent mixing in good agreement with Alford et al. (1999)
Figure 2.8: Temperature (upper) and Salinity (lower) in σ = 25 which lies within the upper thermocline. (Figure from Gordon (2005))
Figure 2.9: Temperature Salinity diagram in the IA.The data were derived from the World Ocean Data Base 2001 and additional regional CTD data. (Figure is from Sprintall et al.
Chapter 3
Evaluation of an operational ocean model configuration
at (1/12
0) spatial resolution for the Indonesian seas - Part
3.1
Introduction
In the framework of the INDESO project, a regional configuration of the NEMO/OPA 9.0 physical ocean model (Madec et al., 1998) has been developed. It covers the whole Indonesian EEZ (Exclusive Economic Zone) and is now running every week in a fully operational mode. This NEMO configuration (named INDO12) has an horizontal resolution of 1/12°. It is coupled with the biogeochemical model PISCES, (Aumont et al., 2006) and fish population dynamics model SEAPODYM (Lehodey et al, 2008). INDO12, which is the model used throughout this thesis, is presented in this paper and its results are validated against several observation data sets.
The model started in January 2007 from initial hydrographic conditions derived from the op-erational global ocean forecasting system (at 1/40 ) operated by Mercator Oc´ean. Atmospheric forcing fields (3-hourly ECMWF model outputs) and the inverse barometer effect are used as surface forcing. Explicit tidal forcing is extracted along ocean boundaries from TPXO6 global tidal model. The model is also forced by the fresh water flux from major rivers in Indonesia and along Malaya peninsula.
To take into account internal tidal mixing, the model explicitly solves the barotropic tides. At the resolution of the model, only part of the baroclinic energy will be generated (Niwa and Hibiya, 2011). An additional parameterisation of tidal mixing is thus used to reproduce the effect of internal tides. This parameterisation has been especially developed for OPA/NEMO in Indonesian seas (Koch-Larrouy et al., 2007, 2008, 2010). Comparison of the model results with various data sets, including outputs of the parent model, climatologies, in situ temperature and salinity measurements, and satellite data, show that:
• The general circulation around and through the Indonesian archipelago is well reproduced by the INDO12 ocean model.
• The simulated tides agree reasonably well with the TOPEX/POSEIDON, JASON 1 and JASON2 crossover observations.
• The relative volume transport in the three major outflow passages in the INDO12 simu-lation is very close to one calculated from the INSTANT estimates
• The simulated vertical mixing is able to erode the South and North Pacific subtropical water salinity maximum. Compared to climatologies, the inflow coming from North Pacific seems too salty for NPSW (give full name) and too fresh in surface for NPIW.
strong vertical mixing occurs in Halmahera Sea, on the other hand, T –S profiles fit quite well in the Banda Sea and the Ombai Strait. Finally, all T –S dia- grams in the Indonesian Archipelago show that the parent model has definitively not enough efficient vertical mixing and that a higher resolution model including explicit tides is needed to mix correctly the Pacific waters in the Indonesian Archipelago.
In summary, in spite of a few weaknesses, INDO12 proves to be able to provide a very realistic simulation of the ocean circulation and water mass transformation through the Indonesian Archipelago.
3.2
Scientific paper :
Evaluation of an operational ocean model configuration
at (1/12
0) spatial resolution for the Indonesian seas
(NEMO2.3/INDO12) – Part 1: Ocean physics
Benoit Tranchant1, Guil laume Reffray2, Eric Greiner2, Dwiyoga Nugroho3,4, Ariane Koch-Larrouy3 and Philippe Gaspar1
1 CLS, Ramonville Saint-Agne, France
2 Mercator Oc´ean, Ramonville Saint-Agne, France
3 IRD/LEGOS 18 av. Ed. Belin, 31401 Toulouse, France
4 Agency of Research and Development for Marine And Fisheries, MMAF, Jakarta, Indonesia Published in Geoscientific Model Development Journal, 10 March 2016