Science Arts & Métiers (SAM)
is an open access repository that collects the work of Arts et Métiers Institute of Technology researchers and makes it freely available over the web where possible.
This is an author-deposited version published in: https://sam.ensam.eu Handle ID: .http://hdl.handle.net/10985/10534
To cite this version :
Vincent DAVAL, Guillaume POT, Mohamed BELKACEMI, Fabrice MERIAUDEAU, Robert COLLET - Automatic measurement of wood fiber orientation and knot detection using an optical system based on heating conduction - Optics Express - Vol. 23, n°26, p.33529-33539 - 2015
Any correspondence concerning this service should be sent to the repository Administrator : archiveouverte@ensam.eu
Automatic measurement of wood fiber
orientation and knot detection using an optical
system based on heating conduction
Vincent Daval,1,* and Guillaume Pot,1 and Mohamed Belkacemi,2 and Fabrice
Meriaudeau,2 and Robert Collet1
1LaBoMaP, Ecole Nationale des Arts et Métiers, Rue porte de Paris, Cluny, 71250, France 2Le2i, Université de Bourgogne, IUT Le Creusot, 11 rue de la fonderie, Le Creusot, 71200, France
*vincent.daval@ensam.eu
Abstract: In this paper, a new approach to computing the deviation of
wood grain is proposed. To do this, the thermal conduction properties of timber are used (higher conduction in the fiber direction). Exciting the surface of the wood with a laser and capturing the thermal conduction using a thermal camera, an ellipse can be observed. Using a method similar to the tracheid effect, it is possible to extract information from this ellipse, such as the slope of grain and the presence of knots. With this method it is therefore possible to extend the mechanical model (assessing the mechanical properties of timber) to take certain singularities into account. Using this approach, the slope of grain can be estimated for any wood species, either hardwood or softwood, which was not possible with the existing tracheid effect.
References and links
1. EN 338, “Structural timber-Strength classes,” (2009).
2. EN 14081–1, “Strength graded structural timber with rectangular cross section-part 1: general requirements,” (2011).
3. EN 14081–2, “Strength graded structural timber with rectangular cross section-part 2: machine grading; additional requirements for initial type testing,” (2013).
4. EN 14081–3, “Strength graded structural timber with rectangular cross section-part 3: machine grading; additional requirements for factory production control,” (2012).
5. EN 14081–4, “Strength graded structural timber with rectangular cross section-part 4: machine grading; grading machine settings for machine controlled systems,” (2009).
6. B. Rajeshwar, D. Bender, D. Bray, and K. McDonald, “An ultrasonic technique for predicting tensile strength of southern pine lumber,” Trans. Am. Soc. Agri. Eng. 40(4), 1153–1159 (1997).
7. T. Biechele, Y. H. Chui, and M. Gong, “Comparison of NDE techniques for assessing mechanical properties of unjointed and finger-jointed lumber,” Holzforschung 65(3), 397–401 (2011).
8. A. Olsson, J. Oscarsson, M. Johansson, and B. Kallsner, “Prediction of timber bending strength on basis of bending stiffness and material homogeneity assessed from dynamic excitation,” Wood Sci. Technol. 46(4), 667– 683 (2012).
9. G. Roblot, L. Bleron, F. Mériaudeau, and R. Marchal, “Automatic computation of the knot area ratio for machine strength grading of douglas-fir and spruce timber,” Eur. J. Environ. Civil Eng. 14(10), 1317–1332 (2010). 10. J. K. Oh, K. Shim, K. M. Kim, and J. J. Lee, “Quantification of knots in dimension lumber using a single-pass
X-ray radiation,” J. Wood Sci. 55(4), 264–272 (2009).
11. M. Hu, M. Johansson, A. Olsson, J. Oscarsson, and B. Enquist, “Local variation of modulus of elasticity in timber determined on the basis of non-contact deformation measurement and scanned fibre orientation,” Eur. J. Wood Wood Prod 73(1), 17–27 (2015).
12. J. Viguier, A. Jehl, R. Collet, L. Bleron, and F. Meriaudeau, “Improving strength grading of timber by grain angle measurement and mechanical modeling,” Wood Mater. Sci. Eng. 10(1), 1–12 (2015).
13. R. Bergman, Z. Cai, C. Carll, C. Clausen, M. Dietenberger, R. Falk, C. Frihart, S. Glass, C. Hunt, and R. Ibach, “Wood handbook: wood as an engineering material,” in Forest Products Laboratory (2010).
14. J. Nyström, “Automatic measurement of fiber orientation in softwoods by using the Tracheid effect,” Comput. Electron. Agric. 41(1–3), 91–99 (2003).
15. S. Simonaho, J. Palviainen, Y. Tolonen, and R. Silvennoinen, “Determination of wood grain direction from laser light scattering pattern,” Opt. Lasers Eng. 41(1), 95–103 (2004).
16. J. Zhou and J. Shen, “Ellipse detection and phase demodulation for wood grain orientation measurement based on the Tracheid effect,” Opt. Lasers Eng. 39(1), 73–89 (2003).
17. F. F. P. Kollmann and W. A. Côté, “Principles of Wood Science and Technology,” (Springer-Verlag, 1968). 18. T. Maku, “Studies on the heat conduction in wood,” Wood Res. 13, 1–79 (1954).
19. H. C. Fernandes and X. Maldague, “Fiber orientation assessment in complex shaped parts reinforced with carbon fiber using infrared thermography,” Quantum Infrared Thermography J. 12(1), 1–16 (2015).
20. A. Bajard, O. Aubreton, Y. Bokhabrine, B. Verney, G. Eren, A. Erçil, and F. Truchetet, “3D Scanning of specular and diffuse metallic surfaces using an infrared technique,” Opt. Eng. 51(6), 0091 (2012).
21. A. Olsson, J. Oscarsson, E. Serrano, B. Källsner, M. Johansson, and B. Enquist, “Prediction of timber bending strength and in-member cross-sectional stiffness variation on the basis of local wood fibre orientation,” Eur. J. Wood Wood Prod 71(3), 319–333 (2013).
1. Introduction
Since 2010 in the European Union, wood used for structural purposes must satisfy several mechanical requirements. Wood must therefore be mechanically graded to ensure that the product complies with the requirements. Mechanical grading of timber must guarantee three properties [1]: density, modulus of elasticity (MOE) and bending strength also called modulus of rupture (MOR). However, wood presents significant variability in terms of its mechanical properties, mainly due to factors such as wood species, tree growth rate, density, local singularities (knots, cracks, slope of grain), etc. Machines can be used to perform the mechanical grading of wood, in accordance with the relevant European standards [2–5].Wood grading machines are based on various principles, such as density measurement, vibrational measurement of the MOE [6–8] or singularity detection using optical means, X-rays, or scattering measurement techniques [9–11]. To predict bending strength, most of these grading techniques are extremely dependent on the correlation between the MOR and the density or the MOE, and thus only partially take into account local singularities. A recent study [12] shows that for a species with large knots (such as douglas fir produced in southern Europe), a mechanical model based on local measurements of singularities, and more specifically grain slope measurements, significantly improves MOR prediction, since timber strength decreases non-linearly as the slope of grain increases [13].
The slope of grain (also called grain direction) is the angle made by wood fibers and the edges of a piece of wood. Indeed, wood is made of highly elongated cells of a diameter of a few tens of micrometers and a length that can be of several millimeters. Variations in slope of grain are especially great around the knots [11, 12], because of the simultaneous growth of the trunk and a branch in different directions.
The slope of grain can be measured by the “tracheid effect” principle: an ellipse of light appears in the direction of the tracheids (i.e. wood fibers of softwood species) when projecting a laser dot onto the wood surface [14–16]. Although there are multiple theories to explain this phenomenon, the most commonly accepted is the following: the light propagates by total reflection in such a way that the laser dot penetrates the wood surface and propagates in the wood fibers as in optical fibers [14]. By using a dot line, this scattering produces an ellipse for each laser dot, and the slope of grain on the surfaces of wood boards can be scanned as shown in Fig. 1. However, Zhou et al. [16] showed that the emergent laser light on the wood surface is affected by wood species and surface finishes, so that the so-called “tracheid effect” is hardly observed in hardwood and is highly disturbed for rough-sawn surface finishes. The purpose of this study is to propose a new method to measure the slope of grain for a large number of species and different surface finishes by using heating conduction. This “heating method” is compared to the scattering method for different wood species and surface finishes.
2. Material and methods
2.1 Laser Scattering
As explained previously, the scattering method is based on the “tracheid effect”. In the present work a dot laser (HeNe: 632.8 nm) is split into a dot line by a diffractive optical
element on the board surface. The spacing between each dot is regular: 4 mm in the present case as shown in Fig. 1. The grain slope is computed from the ellipse formed by the light scattering for each dot. By moving the board on a conveyor, one can capture one image every millimeter along the longitudinal direction of the board. As a result, a local measurement of slope of grain with an interval of 1 mm along the longitudinal direction and 4 mm along the transversal direction of the board is obtained.
Fig. 1. Tracheid effect by projection of dot line laser [12].
2.2 Heating conduction
Instead of using scattering, we herein propose a new approach in order to locally measure the slope of grain of hardwood and softwood by using the thermal conductivity properties of wood. A similar approach, called ellipsometry, is already used in the study of composite materials to estimate the composite fiber orientation [19]. Thermal conductivity can be written as the sum of two contributions:
e p
λ λ λ= + (1)
With λe the contribution of charge carriers and λp the contribution of vibrations of the
atoms. In wood, because there are very few free electrons, λe can be neglected. Thus, the
thermal conductivity of wood mainly depends on λp, that is to say on the structure of the wood. Indeed, Kollmann et al. [17] have shown that wood thermal conductivity depends on fiber direction and wood singularities. In addition, other studies have shown that the conductivity is larger in the fiber direction than in the direction perpendicular to the fibers (about 2.5 times) [18]. Hence, by using an infrared laser to heat the surface of the wood it is possible to detect and estimate the slope of grain. During the application of an external heat source on any surface, three heat transfer modes appear: conduction, convection and radiation. Figure 2 illustrates these transfers when a material is excited by a laser. In this case, another interaction appears: specular reflection (an optical phenomenon).
Fig. 2. 3D representation of heat transfers (taken from [20]).
In the case of wood, the incident radiation will be partially reflected and partially absorbed. The absorbed part, due to particle motion, will create a local temperature rise. This heat will be propagated in the material by conduction (mostly in the fiber direction because of its greater conductivity) and convection at each air/solid interface. In order to not damage the wood, the temperature rise must remain relatively low. As with any radiation, thermal radiation is subject to Planck's law. Therefore, to visualize the conduction we need to use an infrared camera (sensitive to wavelengths around 5 µm). Thus, by exciting the surface locally with a laser and by visualizing the conduction with an infrared camera, it is possible to detect and estimate the slope of grain for any wood species, including hardwood.
Fig. 3. Experimental setup.
Figure 3 illustrates the experimental setup used for this experiment. The wood surface is excited by a pulsed fiber laser (5 W) emitting at 1060 nm. A system of galvanometer mirrors is mounted at the output of the laser as illustrated in Fig. 3. These mirrors enable the laser dot to be oriented in any direction in order to scan the wood sample. The heat then spreads in the fibers by conduction. This heat propagation is observed thanks to an infrared camera (sensitivity: 1.5 µm to 5.1 µm, resolution: 320x256 pixels). Given that the heat propagates mainly along the fiber, the radiation captured by the camera forms an ellipse Fig. 4(b). As mentioned previously, in order to not damage the wood, a short laser radiation pulse duration was used. As shown in Fig. 4, the shape of the ellipse obtained by conduction depends on the laser emission time. After 1 µs, the heat has not yet propagated in wood fibers and only a circle can be observed at the surface of the wood Fig. 4(a). Continuing to excite the surface,
after 200 µs an ellipse shaped by heat conduction in the fibers is observed Fig. 4(b). Stopping the laser emission after 200µs, the heat continues to propagate for a few µs Fig. 4(c). In the following, the image used for slope of grain measurement was captured after 200 µs, which is sufficient for ellipse detection Fig. 4(b).
Fig. 4. Ellipse obtained by conduction at different times on oak sample. In our application, the images were captured at 200 µs, Fig. 4(b).
2.3 Ellipse detection
For both methods, the slope of grain is determined from the shape of the ellipses. The only difference is the physical phenomenon used to obtain the ellipse: the tracheid effect or the thermal conductivity of the wood. The principal axes of the ellipses are identified using a principal component analysis (PCA). PCA consists of extracting the two vectors which give the best de-correlation of the data. Here, the data are the location of each ellipse edge in pixels ( , )x yi i . These data are grouped in a centered matrix N:
1 1 ... ... n n x x x x N y y y y − − = − − (2)
With x et y respectively the mean of x (x1toxn) and the mean ofy(y1 to yn). PCA computation consists of calculating the covariance matrix of the centered data:
. T.
C=N N (3)
The two eigenvectors of C correspond to the axes of the ellipse, and their associated eigenvalues are used to estimate the shape factor, or ellipticity (ratio between the major axis and the minor axis). The ellipticityεof each ellipse is obtained from the eigenvaluesλ1andλ2of the covariance matrix C (Eq. (3) as follows:
1 2 , λ ε λ = (4)
whereλ1andλ2are respectively the eigenvalues of the highest and the smallest eigenvector of
2.4 Wood material
In order to verify the efficiency of the proposed heating conduction method, the measurement of the grain slope was tested using first the scattering method and then the heating method for four different wood species: spruce (Picea abies), Douglas fir (Pseudotsuga menziesii), poplar (Populus) and oak (Quercus petraea). The spruce, Douglas fir and oak samples presented knotty areas, while the poplar sample was homogeneous. Most of these samples were planed, but a second sample of Douglas fir was used in order to study the influence of surface finishes. Indeed, this sample was first measured by the two methods with a sawn surface finish, and then it was planed and measured again in the same zone using the two methods. The planing operation removed only a thin layer of wood (no more than 2 mm in thickness). To do this comparison, we have comptuted the grain angle with the heating method fisrt and we have just replaced the infrared camera (not sensitive to 1060nm) by an shortwave infrared camera (sensitive to 1060nm) to compute the grain angle with the scattering method for the same physical point on the wood sample.
3. Results
In order to verify the efficiency of the proposed heating conduction method, the local slope of grain measurements have been compared on the same samples to the scattering method. With both methods the angles measured are 2D angles. Actually, to classify mechanically a board of wood using scattering method, the existing methods propose to compute the grain angle on the two main faces of the board and calculate the mean between them [12, 21]. In the following, first are presented the results for different wood species, then for different surface finishes (before and after planing operation).
3.1 Comparison between the scattering and heating methods for different wood species
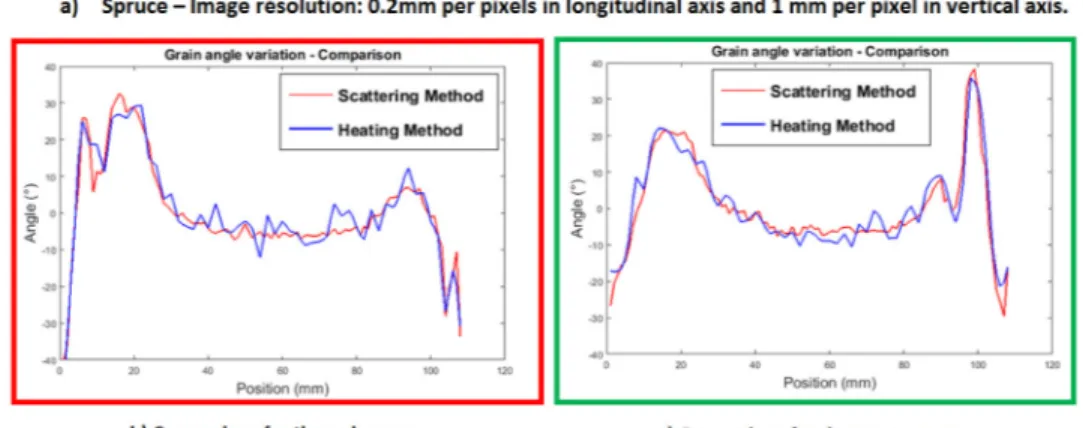
Figures 5 to 7 show the comparison between the heat conduction method and the scattering method for spruce, Douglas fir and poplar wood samples, respectively. To make these comparisons, the slope of grain was obtained with both methods along two lines (by moving a dot laser along these lines one millimeter at a time). The two different computed lines are symbolized respectively by a red arrow on the left and a green arrow on the right of Figs. 5(a) to 7(a). The corresponding measurement of the slope of grain is then presented according to the position in the red or green arrow in Figs. 5(b) to 7(b) and Fig. 5(c) to 7(c) respectively. The slope of grain angles measured by the scattering method and the heating method are plotted respectively in red and blue lines.
Fig. 5. Comparison of slope of grain variation in spruce. a) Sample of spruce and the two lines computed. b) Comparison between the two methods (scattering method in red and heating method in blue) for the red arrow. c) Same comparison for the green arrow.
Fig. 6. Comparison of slope of grain variation in Douglas fir. a) Sample of Douglas fir and the two lines computed. b) Comparison between the two methods (scattering method in red and heating method in blue) for the red arrow. c) Same comparison for the green arrow.
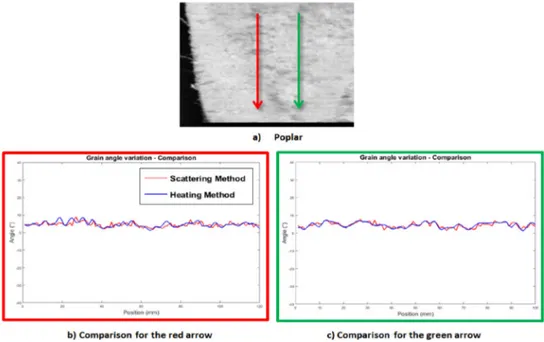
Fig. 7. Comparison of slope of grain variation in poplar. a) Sample of poplar and the two lines computed. b) Comparison between the two methods (scattering method in red and heating method in blue) for the red arrow. c) Same comparison for the green arrow.
These results show that the heating method enables us to obtain similar results to those obtained by the scattering approach applied to these wood species, by using thermal conduction properties of timber (same profile, with more noise in the heating method due to the pixel resolution of the camera). Indeed, the root mean square of the difference between the two methods is 2.80 degrees for spruce, 3.15 degrees for Douglas fir, and 0.71 degrees for poplar. Interestingly, both methods enable the measurement of the high grain angles and the high grain angle variations that appear close to knots, as shown in Figs. 5(a), 5(b), 6(a) and 6(b). For the poplar sample tested presented in Fig. 7(c), no knots were present, thus the grain angle was nearly constant. The root mean square value difference in the grain angle was 4.56 degrees with a standard deviation of 1.29 degrees. It is important to notice that the small variations in grain angle obtained by the two methods match very well as illustrated in Figs. 7(b) and 7(c). As a result, the grain angle variations observed in Figs. 7(a) and 7(b) are most likely due to the wood itself or the surface finish, and not to the measurement device. This result shows that samples which are supposed to have a constant grain angle by eye observation must have slight variations of a few degrees.
The tracheid effects have a limitation, as illustrated in Fig. 8. In the case of Douglas, the light is scattered in the fiber direction and an ellipse appears at the wood surface, Fig. 8(a). But, in the case of oak, as illustrated in Fig. 8(b), the scattering method is inefficient (no ellipse appears). This result can be explained by the fact that in the case of hardwood the fibers are denser and shorter; the light is thus not sufficiently diffused, so no ellipse appears. As a consequence, a comparison between the two methods could not be made for oak as it was for the other species. However, the heat conduction method works on hardwood, because the phenomenon is not based on light propagation but on heat propagation.
Fig. 8. Tracheid effect on different wood species.
Fig. 9. Oriented vectors (slope of grain) calculated on an oak sample. The slope of grain turns around the knot. The length of the vectors is related to the ellipticity. Magenta vectors represent the ellipses with a low ellipticity.
The heating method was used to scan the surface of a full oak sample that include a knot as illustrated in Fig. 9. As shown in Fig. 9, the slope of grain changes around the knot. Moreover, the ellipticity of each ellipse obtained by heat conduction varies in the sample, it is related to the length of the vectors in Fig. 9. Finally, it is possible to define an ellipticity criterion that can be used to detect the knot. An arbitrary criterion was used to color the shorter vectors in magenta in Fig. 9. The heating method can thus be used to measure the local slope of grain of various wood species, including oak, and furthermore can be used to detect knots.
3.1 Comparison between the scattering and heating methods for different surface finishes
To study the influence of surface finishes, the slope of grain was computed along two lines (red and green arrows) for the same sample of Douglas fir using both methods, before and after the planing operation, respectively illustrated in Figs. 10(a) and 10(b). The results obtained for the Douglas rough-sawn sample prove that the scattering method is very sensitive to surface finish. The measurement of the slope of grain appears very noisy on this surface using the scattering method. Inversely, the heating method seems to provide smoother results. Indeed, the root mean square difference between the two methods is 10.62 degrees for the Douglas rough-sawn sample. On the same sample, after the planing operation, the results are similar for the two methods since the root mean square of the differences between them is 2.85 degrees. Moreover, the difference between the heating method on the Douglas rough-sawn sample and the Douglas planed sample is 2.51 degrees. As a result, in addition to being
efficient for different wood species, the heating method also presents the interest of being robust with respect to surface finishes, contrary to the scattering method.
Fig. 10. Comparison between the scattering method and the heating method for the same wood sample with different surface finishes. a) Douglas rough-sawn sample. b) Same sample planed. c) and d) Comparison between the two methods for the rough sample. e) and f) Comparison between the two methods for the planed sample.
4. Conclusion
In this paper, a new approach to computing slope of grain is proposed and compared to the existing scattering method. The proposed method uses the thermal conduction properties of timber (higher conduction in the fiber direction). The excitation of the surface of the wood using a laser enables an ellipse in the grain direction to be observed by means of a thermal camera. Notably, this phenomenon is almost unaffected by wood surface finishes, and works well on a rough-sawn Douglas fir sample, while the usual scattering method is much noisier. Furthermore, the scattering method appears to be inefficient for oak wood, while the proposed heating method is suitable for slope of grain and knot detection in this species. Therefore, to the best of the authors’ knowledge, the heating method is the only existing method that enables the slope of grain of oak wood to be measured; in addition, it appears to be much
more robust as regards surface finishes than the scattering method. As a result, this method could be used in a universal grain slope measurement system and ultimately be integrated into a wood grading machine. However, particular efforts will be required for the development and setup of the system in order to attain industrial throughput rates without damaging the wood from excessive heating.
Acknowledgment
The present study is supported by the Burgundy General Council and the French National Research Agency through the ANR CLAMEB project (ANR-11-RMNP-0015).
![Fig. 1. Tracheid effect by projection of dot line laser [12].](https://thumb-eu.123doks.com/thumbv2/123doknet/7439504.220503/4.918.271.647.220.415/fig-tracheid-effect-projection-dot-line-laser.webp)