Water Footprint of Hydraulic Fracturing in Northeastern British Columbia,
1
Canada
2
3
Authors: Wisen, J.
1, Chesnaux, R.
1*, Wendling, G.
2and Werring, J.
34
5
1. Université du Québec à Chicoutimi, Chicoutimi, Québec, Canada
6
2. GW Solutions, Nanaimo, British Columbia, Canada
7
3. David Suzuki Foundation, Vancouver, British Columbia, Canada
8
9
2nd reviewed version of the manuscript
10
11
12
13
14
15
16
17
18
19
20
21
22
23
24
25
26
27
*Corresponding author: romain_chesnaux@uqac.ca
28
Click here to view linked References 1 2 3 4 5 6 7 8 9 10 11 12 13 14 15 16 17 18 19 20 21 22 23 24 25 26 27 28 29 30 31 32 33 34 35 36 37 38 39 40 41 42 43 44 45 46 47 48 49 50 51 52 53 54 55 56 57 58 59 60
Abstract
29
The method of hydraulic fracturing used to exploit unconventional shale gas has raised public concerns over
30
the volumes of freshwater that are extracted for injection operations as well as the volumes of wastewater
31
generated as a by-product of gas production. Using data from the British Columbia Oil and Gas Commission,
32
this paper examines the volumes of produced and injected water from hydraulically fractured gas wells in
33
northeastern British Columbia. The two major producing shale gas basins in the province are the Montney
34
and the Horn River. In this study, these are divided into several sub-basins based on existing geological and
35
reservoir engineering applications. For each sub-basin the average volumes of wastewater - and injected
36
water per well are calculated and then normalized to cumulative gas production. Ratios of injected water: gas
37
production and wastewater: gas production are then applied to estimated volumes of remaining gas reserves
38
in each sub-basin in order to calculate a total water footprint of future exploitation. These extrapolated water
39
footprints were further elaborated into 3 scenarios of wastewater recycling rates: 0, 40, and 100% re-use This
40
study also compares the quality and quantity of wastewater produced from hydraulically fractured wells to
41
their conventional counterparts in the province. Based on these calculations, the total future freshwater
42
withdrawal and wastewater production volumes for all basins range from 1.65 to 3 billion, and 0 to 1.35
43
billion cubic meters, respectively. Volumes of freshwater withdrawal are relatively modest compared to other
44
industries when considering the size of northeastern British Columbia and the time-scale of extraction. In
45
general, hydraulically fractured wells in northeastern British Columbia produce volumes of wastewater that
46
are equal to or lower than those required for injection. Unconventional gas wells often produce far less
47
wastewater than their conventional counterparts.
48
49
50
51
52
53
54
55
56
57
58
59
60
61
3 4 5 6 7 8 9 10 11 12 13 14 15 16 17 18 19 20 21 22 23 24 25 26 27 28 29 30 31 32 33 34 35 36 37 38 39 40 41 42 43 44 45 46 47 48 49 50 51 52 53 54 55 56 571. Introduction
63
Production of natural gas from tight shale reservoirs (shale gas) has been steadily increasing
64
worldwide since 2005 and is projected to constitute 30% of worldwide gas production by 2040 (US EIA,
65
2015). For many countries, the possibility of shale gas production thanks to new exploitation techniques
66
presents a pathway towards energy independence in the near future (US EIA, 2015). Significant reserves of
67
shale gas exist in Canada, where 9 gas-bearing shale formations are spread out over 5 provinces and two
68
territories (Rivard et al., 2014). However, the method used to exploit shale gas has raised some environmental
69
concerns, particularly the possible cross-contamination of aquifers and surface waters either from hydraulic
70
fracturing of the shale (Wisen et al., 2019) or from disposal at depth of the wastewater thus produced. As a
71
consequence, a moratorium has been placed on shale gas development in three Canadian provinces (Québec,
72
New Brunswick and Nova Scotia) and in several countries including France and Germany.
73
74
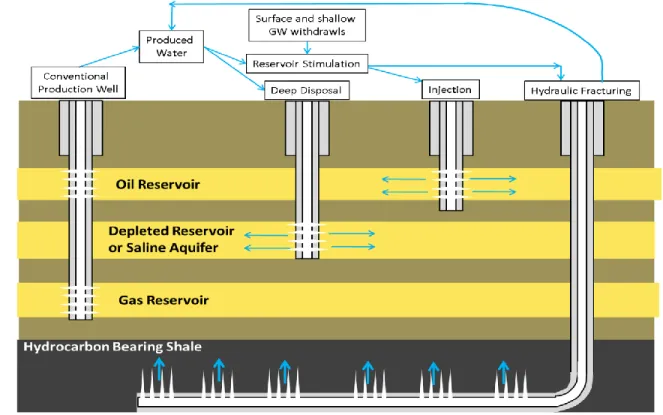
Figure 1: Conceptual illustration of shale gas production (conventional vs. hydraulic fracturing) and
75
disposition of produced wastewater.
76
77
Shale gas is exploited through the combined techniques of horizontal drilling and multi-stage hydraulic
78
fracturing (“fracking”). Fracking is the process by which perforated sections of a horizontal wellbore are
79
sequentially injected with high volumes of water and sand, in order to create and prop open a fracture
80
network. This created fracture network increases the bulk permeability of the shale, allowing the flow and
81
production of hydrocarbons that would otherwise remain trapped in the rock matrix. Exploited shale gas
82
reservoirs are typically found at depths greater than a kilometer. Shale gas is considered an example of
83
unconventional gas in that it relies upon an enhanced stimulation technique (i.e. fracking) in order to generate
84
economic production. Conventional gas, on the other hand, does not require any stimulation to make
85
economic amounts of gas flow to the surface (Johnson and Johnson, 2012). Figure 1 illustrates the cycles of
86
water injection and production for conventional and hydraulically fractured wells.
87
In order to maximize the effectiveness of fracturing, prior to injection a number of chemical additives
88
are mixed in with the water along with the sand proppant. These chemicals include viscosity and pH adjusters,
89
friction reducers, corrosion and scale inhibitors, surfactants, gelling agents and clay stabilizers to inhibit clay
90
flocculation (Jackson et al., 2013). Some of this hazardous water will flow back up the wellhead (flowback
91
3 4 5 6 7 8 9 10 11 12 13 14 15 16 17 18 19 20 21 22 23 24 25 26 27 28 29 30 31 32 33 34 35 36 37 38 39 40 41 42 43 44 45 46 47 48 49 50 51 52 53 54 55 56 57 58 59 60water) along with formation brines (produced water) during production of the well (Vengosh et al., 2014;
92
Lutz et al., 2013). Produced water from shale gas is characterized by high concentrations of toxic elements
93
such as barium, strontium and radioactive radium. Additionally, as with most conventional reservoirs,
94
produced water is highly saline and often contains dissolved organic compounds (Vengosh et al., 2014).
95
These toxic and radioactive elements typically show a direct correlation with salinity (Vengosh et al., 2014).
96
Flowback and produced water are sometimes collectively termed flowback-produced (FP) water (Scanlon et
97
al., 2016) or more generally, fracking “wastewater” (Lutz et al., 2013). Typically, the salinity of fracking
98
wastewater increases over time as the chemistry shifts from flowback to brine-dominated (Vengosh et al.,
99
2014).
100
101
The generation and handling of wastewater from shale gas present an environmental challenge and
102
possible threat to freshwater resources located in proximity to hydraulic fracturing operations. Shale gas FP
103
waters can be managed either through reuse in subsequent hydraulic fracturing operations or by permanent
104
disposal (US EPA, 2016). Due to their high salinity, FP waters are generally less effective at hydraulic
105
fracturing than freshwaters and hence require more treatment and additives before they can be reused for
106
subsequent hydraulic fracturing operations (US EPA, 2016; CCA 2014). Similarly, treatment for release into
107
surface waters is a complicated and costly process. In some cases, this treatment option has been found to be
108
inefficient at completely eradicating the geochemical signature of FP waters below safe drinking standard
109
thresholds (Warner et al., 2012). As a result, deep disposal is typically the most feasible and cost-effective
110
method for managing FP waters from shale gas operations (US EPA, 2016).
111
112
Deep disposal is the process by which wastewater is injected through a disposal well into deep saline
113
aquifers. Deep saline aquifers are permeable formations located at depths where the pore water is saline and
114
not suitable for consumption or agricultural purposes. The purpose of deep disposal is for injected fluids to
115
remain in the target formation and not contaminate surrounding sources of water (wastewater confinement).
116
Despite the apparent benefit of trapping unwanted fluids deep underground, some concerns have been raised
117
concerning this practice. Firstly, there is concern that injected wastewater could find a pathway upward into
118
freshwater aquifers along preferential pathways such as faults or leaky wellbores (Akob et al., 2016;
Carr-119
Wilson, 2014; Ferguson, 2015; US EPA, 2014; Chesnaux et al., 2013). Secondly, deep injection has been
120
increasingly linked to induced earthquakes, including some events of magnitude 4 and greater (McGarr,
121
2014; Atkinson et al., 2016; US EPA, 2015; Goebel et al., 2016; Shultz et al., 2014).
122
123
Thanks to hydraulic fracturing, Northeastern British Columbia (NEBC), now has access to one of
124
the world’s largest reserves of recoverable shale gas (US EIA, 2015), contained in the Montney and Horn
125
River Basins (Figure 2).
126
In BC, deep disposal is the only permitted method for disposing of wastewater that is not re-used
127
for subsequent reservoir stimulation operations, according to the British Columbia Oil and Gas Commission
128
(BC OGC, 2018). Deep disposal in BC is permitted in either depleted reservoirs or deep saline aquifers (BC
129
OGC, 2018).
130
131
This study examines the current and projected volumes of freshwater consumption and wastewater
132
disposal needed to accommodate continued hydraulic fracturing in NEBC. Although the BC OGC has
133
provided geological estimates of recoverable gas volumes, there is no estimate of total water footprint.
134
Hughes (2015) estimated how many wells need to be drilled in NEBC in order to produce the remaining gas
135
reserves. However, Hughes (2015) did not calculate how much freshwater will be withdrawn, how much
136
wastewater will be produced and how much wastewater will require deep disposal, for all these wells.
137
138
No study has yet attempted to estimate the volumes of wastewater that will be generated from hydraulic
139
fracturing activities and how much water will require deep disposal after part of the produced wastewater can
140
be reused for hydrofracking. The two issues of 1-freshwater withdrawal applying a stress on freshwater
141
3 4 5 6 7 8 9 10 11 12 13 14 15 16 17 18 19 20 21 22 23 24 25 26 27 28 29 30 31 32 33 34 35 36 37 38 39 40 41 42 43 44 45 46 47 48 49 50 51 52 53 54 55 56 57estimating, on the one hand, the future quantities of freshwater that will be needed for hydrofracking, and on
144
the other hand, the future quantities of wastewater produced by hydrofracking in shale gas formations. These
145
estimates ultimately make it possible to determine the quantity of water that will need to be re-injected into
146
the exploited shale gas formations, according to different scenarios of re-use of wastewater for hydrofracking.
147
148
149
Figure 2: Distribution of shale gas and conventional wells in NEBC. Not all wells displayed are currently
150
active producers.
151
152
In some cases, well operators re-use a portion of generated wastewater for subsequent hydraulic
153
fracking operations, which has the combined effect of reducing both freshwater consumption and the need
154
for deep disposal. This study therefore considers three scenarios in order to estimate anticipated volumes of
155
freshwater withdrawal and deep waste disposal. This includes one scenario in which all future hydraulic
156
fracturing fluids are sourced from wastewater and a second in which all fluids are sourced from freshwater
157
withdrawals. Lastly, in the third scenario, the current rate of wastewater re-use is calculated and applied to
158
all future production.
159
The study is illustrated with the specific case of the unconventional gas exploitation occurring in
160
NEBC for which a large database from the BC OGC is available regarding two specific basins: the Montney
161
3 4 5 6 7 8 9 10 11 12 13 14 15 16 17 18 19 20 21 22 23 24 25 26 27 28 29 30 31 32 33 34 35 36 37 38 39 40 41 42 43 44 45 46 47 48 49 50 51 52 53 54 55 56 57 58 59 60and the Horn River basins. The database contains the relevant information of water use and production of the
162
past and current shale gas production wells. Based on this information, the database will allow the prediction
163
of the future water footprint of the exploitation of the two shale basins under study using the developed
164
methodology. This methodology could then be used for any other unconventional shale gas formations
165
exploited worldwide in order to characterize the future water footprint of gas exploitation.
166
167
2
HYDROSTRATIGRAPHY OF NEBC AND STUDIED UNITS
168
2.1 Hydrostratigraphy
169
NEBC is located in the northwestern-most corner of the Western Canadian Sedimentary Basin
170
(WCSB). At its deepest, the WCSB extends 3 km below the surface in NEBC and contains 15
171
hydrostratigraphic units classified as deep saline aquifers (Figure 3). With the exception of the two uppermost
172
units, the Dunvegan and the Cardium, all these saline aquifers are major producers of conventional gas (more
173
than 100,000 m3 of cumulative production) or gas with lesser amounts of oil (IRIS 2018). These gas-bearing
174
saline aquifers are separated by 10 aquitards and the Charlie Lake aquiclude. The Charlie Lake aquiclude is
175
a predominantly evaporite sequence that contains isolated detrital sequences containing oil and gas
176
accumulations. Two of the 10 aquitards are the gas-bearing Montney and Horn River, exploited through the
177
unconventional technique of hydraulic fracturing. These two shale units do not extend laterally over the entire
178
province; the Montney is concentrated in the south and the Horn River in the north (Figure 2). The Horn
179
River aquitard is divided geologically and geographically into 2 basins: the Horn River Basin and Cordova
180
Embayment, and the Liard Basin. The Liard basin is the stratigraphic equivalent of the Horn River and
181
Cordova basins; however, it is offset from the latter by the Bovie Fault. There is little to no gas production
182
from the other aquitards (IRIS 2018, 2018).
183
184
2.2 Studied units
185
As previously described, the main shale gas units are the Montney and Horn River aquitards. For the purposes
186
of well performance and water impact analysis, these units are further subdivided as presented in Table 1.
187
These subdivisions are based on those proposed by the British Columbia Oil and Gas Commission (BC OGC)
188
in their most recent document on shale gas reserves (BC OGC 2015). In each of these study units, the BC
189
OGC has calculated an estimated recoverable volume of gas based on geostatistical analysis (Table 1).
190
As the Montney aquitard has been more extensively developed than the Horn River aquitard, it has
191
been sub-divided into both geographic and geological zones, including the upper Montney A and the lower
192
Montney B. Due to limited production data, the Liard basin was not analysed in this study.
193
For each study unit, the goal of the present study is to calculate ultimate freshwater consumption as
194
well as ultimate wastewater production for fracking. In other words, if the estimated volumes of recoverable
195
gas in place are exploited, how much freshwater resources will be consumed and how much wastewater will
196
be generated? Any leftover wastewater not re-used in hydraulic fracturing operations in B.C. requires
197
permanent disposal via deep disposal wells.
198
199
3 4 5 6 7 8 9 10 11 12 13 14 15 16 17 18 19 20 21 22 23 24 25 26 27 28 29 30 31 32 33 34 35 36 37 38 39 40 41 42 43 44 45 46 47 48 49 50 51 52 53 54 55 56 57200
Figure 3: Hydrostratigraphy of NE British Columbia. Adapted from Bachu (2002).
201
202
203
204
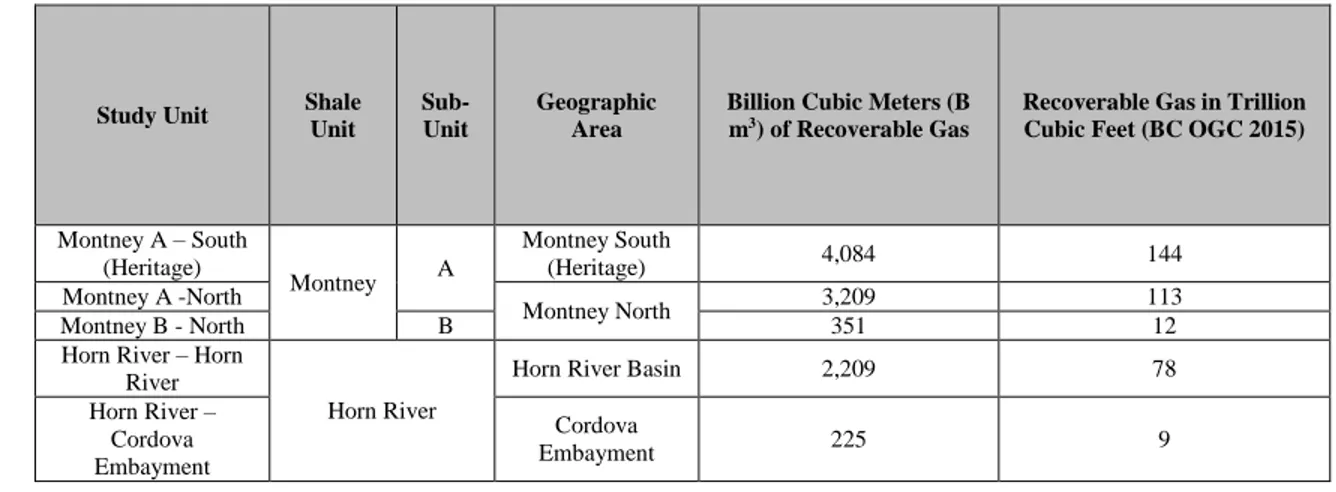
3 4 5 6 7 8 9 10 11 12 13 14 15 16 17 18 19 20 21 22 23 24 25 26 27 28 29 30 31 32 33 34 35 36 37 38 39 40 41 42 43 44 45 46 47 48 49 50 51 52 53 54 55 56 57 58 59 60Table 1: Study units and gas resources
205
Study Unit Shale Unit
Sub-Unit
Geographic Area
Billion Cubic Meters (B m3) of Recoverable Gas
Recoverable Gas in Trillion Cubic Feet (BC OGC 2015)
Montney A – South (Heritage) Montney A Montney South (Heritage) 4,084 144 Montney A -North Montney North 3,209 113 Montney B - North B 351 12
Horn River – Horn River
Horn River
Horn River Basin 2,209 78
Horn River – Cordova Embayment Cordova Embayment 225 9
206
3
METHODOLOGY
207
The methodology developed to assess the future global water footprint in NEBC is composed of the following
208
steps:
209
210
1- Estimating the volumes of freshwater and/or wastewater that are needed for future hydrofracking based
211
on the volumes of water that have been used in the past for hydrofracking the current active and past
212
deactivated wells in the Horn River and Montney basins. Knowledge of the quantity of water that has
213
been required to extract a certain quantity of gas makes it possible to anticipate the future needs of water
214
as a function of the future quantities of gas to be extracted by hydrofracking.
215
2- Estimating the volumes of wastewater resulting from the future exploitation of unconventional gas in the
216
two basins. These future required volumes of freshwater are estimated using a wastewater-to-gas ratio
217
(volume of wastewater divided by the volume of extracted gas) value that is calculated for each basin
218
from the data available in the database. It is indeed assumed that each basin has its own
wastewater-to-219
gas ratio value which characterizes the specific behaviour of each basin.
220
3- Applying different scenarios of wastewater reuse for fracking in order to calculate the volume of
221
wastewater to be disposed and also to calculate the volume of freshwater that will be needed for the future
222
shale gas extraction. This will make it possible to assess the global water footprint of the future extraction
223
of shale gas until the complete depletion of the known reserves.
224
4- Determining and comparing the average total dissolved solids (TDS values) of wastewater produced by
225
conventional and unconventional gas exploitation. This study allows an assessment of the qualitative
226
aspects of shale gas activities regarding the quality of wastewater.
227
228
All data on reservoir production and injection volumes as well as on the chemistry of wastewater produced
229
from the Montney and Horn River were extracted from the Integrated Resource Information System (IRIS),
230
which is maintained and updated, by the British Columbia Oil and Gas Commission on a monthly basis. This
231
data is available to download for free from the BC OGC website. Production decline curves were generated
232
for each geological unit by normalizing and averaging time in terms of production months for each producing
233
well from a given unit. Data from approximately 3,500 and 250 wells in the Montney and Horn River,
234
respectively, have been extracted from the database and processed in the framework of the present study.
235
3 4 5 6 7 8 9 10 11 12 13 14 15 16 17 18 19 20 21 22 23 24 25 26 27 28 29 30 31 32 33 34 35 36 37 38 39 40 41 42 43 44 45 46 47 48 49 50 51 52 53 54 55 56 574
RESULTS
237
238
4.1
Volumes of gas and wastewater produced by conventional and
239
unconventional gas exploitation in the entire province of BC
240
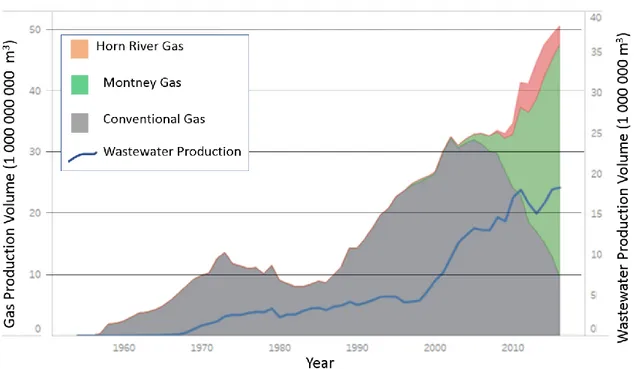
Figure 4 presents the annual production of conventional and unconventional gas in British Columbia. This
241
figure considers all of the 25 000 gas-producing wells in the province, the majority of which are gas
242
producers.
243
Figure 4 has been produced using data from the Integrated Resource Information System (IRIS) database
244
provided by the BC OGC (2018).
245
Since about 2005, conventional gas production has been in decline; however, production from the
246
unconventional Horn River and Montney plays has contributed to a net increase in annual gas production as
247
well as wastewater (Figure 4).
248
249
250
Figure 4: Annual production of conventional and unconventional gas in British Columbia. Unconventional
251
shale gas is produced from the Horn River and Montney Units. G is for billions, M for millions, annual gas
252
production volumes for 2016.
253
254
4.2
Hydraulic fracturing data and production decline analysis in the Montney
255
and Horn River basins
256
As previously stated, data from approximately 3,500 and 250 wells located in the Montney and Horn River,
257
respectively, have been treated in the IRIS database of the BC OGC (2018). This section presents the results
258
for the injected volumes of water and for the produced wastewater in the Montney and Horn River Basins.
259
Figure 5 presents the results for the average injected volume of water per well in the Montney, Horn River
260
3 4 5 6 7 8 9 10 11 12 13 14 15 16 17 18 19 20 21 22 23 24 25 26 27 28 29 30 31 32 33 34 35 36 37 38 39 40 41 42 43 44 45 46 47 48 49 50 51 52 53 54 55 56 57 58 59 60and Liard basins and Figure 6 presents the volumes of injected water per well length. Fracked wells drilled
261
in the Horn River and Cordova sub-units to the north inject higher volumes of water than those in the Montney
262
units to the south (Figure 5). These injected volumes are also high in the Liard Basin; however, the average
263
for Liard is based on only 3 wells and as a result may not be fully representative of future production. In
264
general, wells that are horizontally longer inject higher volumes of water, and wells in the northern Horn
265
River shale units are on average longer than those in the Montney. Despite this, even when normalizing
266
fracking injection volumes to the horizontal length of the well, a large difference is observed between the
267
southern Montney and the northern Horn River units (Figure 6). The Horn River units consume roughly 5
268
times more water than Montney wells for the same horizontal wellbore length. Horn River shales also
269
consume more water per volume of gas produced compared to those in the Montney (Figure 7).
270
Water consumption per produced gas volume is highest in the Horn River units located within the
271
Cordova Basin. Despite injecting substantially higher volumes of water during the hydraulic fracturing
272
process, wells in the Cordova basin produce volumes of gas similar to those in the Montney units (Figure
273
8a). Wells located within the Horn River basin however, produce substantially higher volumes of gas.
274
Wastewastewater volumes are highest in the Cordova basin, followed by the Horn River basin, and
275
Montney shale wells (Figure 8b). This is also true when comparing wastewater volumes to gas production
276
(Figure 9). Ratios of cumulative wastewater to cumulative gas production tend to level out at around 40
277
months and range between 0.1 and 0.2 m3 of water per 1,000 m3 of gas for all zones except the Cordova
278
Basin (Figure 9).
279
280
281
Figure 5: Average injected volumes per well in each study unit.
282
3 4 5 6 7 8 9 10 11 12 13 14 15 16 17 18 19 20 21 22 23 24 25 26 27 28 29 30 31 32 33 34 35 36 37 38 39 40 41 42 43 44 45 46 47 48 49 50 51 52 53 54 55 56 57283
Figure 6: Average injected water volume for wells in each study unit.
284
285
Figure 7: Injected water volume during fracking divided by cumulative gas production.
286
3 4 5 6 7 8 9 10 11 12 13 14 15 16 17 18 19 20 21 22 23 24 25 26 27 28 29 30 31 32 33 34 35 36 37 38 39 40 41 42 43 44 45 46 47 48 49 50 51 52 53 54 55 56 57 58 59 60287
Figure 8: Cumulative gas and wastewater production curves for study units.
288
289
290
3 4 5 6 7 8 9 10 11 12 13 14 15 16 17 18 19 20 21 22 23 24 25 26 27 28 29 30 31 32 33 34 35 36 37 38 39 40 41 42 43 44 45 46 47 48 49 50 51 52 53 54 55 56 57291
Figure 9: Ratio of cumulative wastewater to cumulative gas production.
292
293
4.3
Projected volumes of consumed freshwater and wastewater by future shale
294
gas production
295
The ratios of injected water: gas and wastewater: gas presented in Figure 9 are applied to volumes of gas in
296
place estimated by the BC OGC in order to calculate ultimate volumes of consumed freshwater and produced
297
wastewater by future shale gas production (Table 2).
298
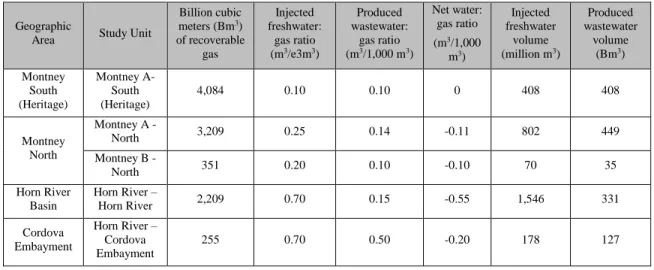
Table 2: Projected volumes of consumed freshwater and produced wastewater from hydraulic fracturing in
299
each study unit
300
Geographic
Area Study Unit
Billion cubic meters (Bm3) of recoverable gas Injected freshwater: gas ratio (m3/e3m3) Produced wastewater: gas ratio (m3/1,000 m3) Net water: gas ratio (m3/1,000 m3) Injected freshwater volume (million m3) Produced wastewater volume (Bm3) Montney South (Heritage) Montney A- South (Heritage) 4,084 0.10 0.10 0 408 408 Montney North Montney A - North 3,209 0.25 0.14 -0.11 802 449 Montney B - North 351 0.20 0.10 -0.10 70 35 Horn River Basin Horn River – Horn River 2,209 0.70 0.15 -0.55 1,546 331 Cordova Embayment Horn River – Cordova Embayment 255 0.70 0.50 -0.20 178 127
301
3 4 5 6 7 8 9 10 11 12 13 14 15 16 17 18 19 20 21 22 23 24 25 26 27 28 29 30 31 32 33 34 35 36 37 38 39 40 41 42 43 44 45 46 47 48 49 50 51 52 53 54 55 56 57 58 59 60In all cases except the Montney A – south, exploitation of shale is projected to inject more water than what
302
will be produced. This is expressed by the net water: produced gas ratio which is defined as (produced
303
wastewater – injected water) / cumulative gas production (m3/1,000 m3). Water loss is highest in the Horn
304
River shales of the Horn River basin. Water loss is the lowest in Montney shales of the Montney south field,
305
where projected wastewater production is estimated to approximate freshwater injection needs.
306
4.4
Scenarios of wastewater re-use and corresponding projected volumes of
307
freshwater withdrawal and wastewater requiring deep disposal
308
Analysis of the FracFocus database and freshwater withdrawal data from the IRIS database suggest that
309
approximately 40 % of hydraulic fracturing fluids were sourced from produced wastewater and 60% from
310
freshwater withdrawals. The database, however, does not detail the source of recycled produced wastewater.
311
Therefore, it is unknown what portion, if any, of recycled produced wastewater is sourced from conventional
312
oil and gas wells in the vicinity of fracking operations.
313
Three scenarios were applied in order to calculate ultimate volumes of freshwater withdrawals and
314
wastewater requiring deep disposal (Table 3). In the framework of these scenarios, the Montney A and B
315
units within the Montney North field are grouped together, given that they occupy the same geographic
316
location.
317
Even if all wastewater produced from fracking operations were to be re-used (scenario 1), there would still
318
be the requirement to withdraw 1.6 billion cubic meters of water. Alternatively, in the worst-case scenario in
319
which no produced wastewater is re-used, 3 billion cubic meters of water would need to be withdrawn.
320
Additionally, the worst-case scenario would generate 1.3 billion cubic meters of wastewater requiring deep
321
disposal. In the most likely scenario where 40% of fracking fluids are derived from recycled wastewater, the
322
projected volume of freshwater withdrawals is similar to the best-case scenario at 1.8 billion cubic meters.
323
Assuming that 40% of injectedwater were to be sourced from produced wastewater, as suggested in the third
324
scenario, deep disposal could be entirely avoided within the Horn River basin. This is important, as there is
325
much less capacity for deep disposal in that study unit than in the others (absence of depleted permeable
326
formations). Alternatively, this is the geographic zone with the highest demand for freshwater extraction.
327
Table 3: Scenarios of wastewater re-use and corresponding projected volumes of freshwater withdrawal
328
and wastewater requiring deep disposal.
329
Study unit
Scenario 1: all wastewater re-used Scenario 2: no wastewater re-used Scenario 3: 40% of fracking fluids sourced from recycled wastewater Freshwater withdrawal volume (million m3) Wastewater disposal volume (million m3) Freshwater withdrawal volume (million m3) Wastewater disposal volume (million m3) Freshwater withdrawal volume (million m3) Wastewater disposal volume (million m3) Montney South (Heritage) 0 0 408 408 245 245 Montney North A and Montney North B 388 0 872 484 523 135 Horn River Basin 1,215 0 1,546 331 928 0 Cordova Embayment 51 0 178 127 107 56 Total 1,654 0 3,005 1,351 1,803 436 3 4 5 6 7 8 9 10 11 12 13 14 15 16 17 18 19 20 21 22 23 24 25 26 27 28 29 30 31 32 33 34 35 36 37 38 39 40 41 42 43 44 45 46 47 48 49 50 51 52 53 54 55 56 57
4.5
Comparing the quantitative and qualitative aspects of water footprint of
331
conventional and unconventional shale gas production in BC
332
The quantity of wastewater produced from shale gas is not necessarily larger than that of conventional
333
production in BC (Figure 10). However, the quality is much lower if total dissolved solids (TDS) is used as
334
the sole criteria (Figure 10). The average TDS for produced wastewater from the Horn River and Montney
335
units is 100,000 and 162,000 mg/L, respectively (IRIS 2018).
336
337
Figure 10: Average salinity of produced wastewater vs. average water to gas ratio.
338
339
5
Discussion
340
The exploitation of the remaining shale reserves in British Columbia will require between 1,65 and 3 billion
341
cubic meters of freshwater. These figures represent 2 to 4 % of the total annual flux of surface water runoff
342
in Northeastern British Columbia, which is estimated at around 120 billion cubic meters per year
343
(Government of BC, 2015). The large-scale impact of freshwater extraction is moderated by the consideration
344
that the remaining reserves of shale gas in the province will be exploited over several decades. The overall
345
impact of freshwater extraction for purposes of hydraulic fracturing appears to be manageable in Northeastern
346
British Columbia. To provide some perspective by means of a comparison, in 2017 the city of Montreal
347
consumed 767 million cubic meters of water. It may be posited that the total volume of freshwater required
348
to be extracted for hydraulic fracturing to produce the remaining reserves of shale gas in BC over several
349
decades is roughly equivalent to a volume 2 to 4 times greater than that consumed by a large Canadian city
350
in a single year.
351
The proper management of freshwater resources will nevertheless require the investigation of impacts at a
352
local scale, that is to say, the location and rate of specific withdrawal points throughout the year. In British
353
Columbia, this management falls under the responsibility of the BC OGC which grants freshwater withdrawal
354
3 4 5 6 7 8 9 10 11 12 13 14 15 16 17 18 19 20 21 22 23 24 25 26 27 28 29 30 31 32 33 34 35 36 37 38 39 40 41 42 43 44 45 46 47 48 49 50 51 52 53 54 55 56 57 58 59 60permits to oil and gas companies based on their evaluation of the potential impact of production over short-
355
and long-term periods. These permits may be revoked in times of low stream flow or drought. In British
356
Columbia, these water withdrawals are also subject to the environmental requirements of the province’s
357
Water Sustainability Act.
358
Concerning the production of wastewater, the results of this study demonstrate that hydraulically fractured
359
wells do not generate more wastewater than conventional oil and gas wells in British Columbia. Nevertheless,
360
the growth of the shale gas industry in the province will consequently increase the volume of wastewater
361
generated, which will require either permanent disposal or re-use in subsequent hydraulic fracturing
362
operations. Currently, the best option for the permanent disposal of these wastewater is deep injection into
363
permeable saline formations containing groundwater unfit for human consumption. However, the increase in
364
reservoir pressure generated by deep disposal wells injecting wastewater has been known to trigger seismicity
365
throughout Canada and the United States (Rubinstein and Mahani, 2015). The increase in hydraulic head of
366
the disposal formation also increases the possibility of ascending cross-contamination if a hydraulic
367
connection was to exist or be created between the surface and the disposal formation (Wisen et al., 2019).
368
The re-use of wastewater in subsequent hydraulic fracturing operations should greatly contribute to
369
attenuating the necessity of deep disposal, and, at the same time, to reducing the volume of freshwater
370
consumed by the process. Indeed, the results of this study show that in Northeastern British Columbia, the
371
volumes of wastewater produced by shale gas wells are lesser than those required for injection as hydraulic
372
fracturing fluid.
373
Finally, it must be underlined that very few studies in other parts of the world have addressed the issue of
374
water footprint in terms of quantifying the volumes of freshwater that are needed for hydrofracking and in
375
terms of volumes of wastewater resulting from the exploitation and future exploitation of unconventional
376
gas. This makes it difficult to conduct a comparison of the results of our study against those of other studies,
377
with the intent to provide a critical analysis on our research results. For example, Warner et al. (2013) as well
378
as Olmstead et al. (2013) have addressed the issue of the impacts of shale gas wastewater disposal on the
379
surface water quality in Pennsylvania. These two studies have shown increased concentrations of chloride
380
and bromide and high levels of contaminants in the surface waters surrounding the region of the Marcellus
381
shale gas basin. They reported TDS concentrations of shale gas waste waters comprised between 0.8 and 300
382
g/L, which results agree with the TDS concentrations observed in our study (Figure 10), namely, between
383
100 and 160 g/L for the Horn, and Montney basins, respectively. According to the same authors, the overall
384
estimated volume of oil and gas wastewater has increased during recent years to reach values between 3.1
385
and 3.8 million m3/y. Concerning the reuse of waste water, Warner et al. (2013) as well as Olmstead et al.
386
(2013) reported that an estimated 70% of the flowback and produced fluids is reused. This ratio of 70% is
387
much higher than the ratio of reused water observed and documented in BC (40%); therefore, the ratio of
388
water reuse could potentially be improved in BC. Another study by Vandecasteele et al. (2015) has
389
investigated the impact of shale gas development on water resources consumption in northern Poland. This
390
study is not based on observed field results, but rather on modeling scenarios of future shale gas exploitation.
391
It estimated that water use per shale gas well would be between 8,000 and 19,000 m3, which is lower than
392
the values that are observed in BC (see Figure 5); these range between 10,000 and 77,000 m3 per well.
393
394
6
Conclusions
395
Using data from the British Columbia Oil and Gas Commission (data from approximately 3,750 wells), the
396
3 4 5 6 7 8 9 10 11 12 13 14 15 16 17 18 19 20 21 22 23 24 25 26 27 28 29 30 31 32 33 34 35 36 37 38 39 40 41 42 43 44 45 46 47 48 49 50 51 52 53 54 55 56 57developed for analysing the existing data and also for producing preliminary estimates of the future quantities
399
of freshwater that will be needed for hydrofracking in BC, as well as the future quantities of wastewater that
400
will be produced by hydrofracking in shale gas formations in BC. In addition, this study also proposed
401
tentative estimates of the quantity (volume) of freshwater that would potentially be needed in different
402
scenarios of re-use of wastewater for hydrofracking (for the re-injection and re-use of various ratios of fresh
403
and/or waste water into the shale gas formations to be exploited). The developed methodology could be used
404
to assess the water footprint of hydraulic fracturing in formations located in other geographical locations
405
around the world.
406
Acknowledgements
407
The authors would like to thank the MITACS Accelerate Program, which partnered the David Suzuki
408
Foundation (DSF) and GW Solutions inc. to provide funding for this research project. We would also like to
409
thank the Natural Sciences and Engineering Research Council of Canada (NSERC), and the Fonds de
410
Recherche du Québec - Nature et technologies (FRQNT) which also provided research grant funding. One
411
anonymous reviewer and Dr. Lamoreaux are thanked for their review of the manuscript. Ms. Josée Kaufmann
412
is also thanked for editorial collaboration.
413
414
References
415
Akob, D.M., Mumford, A.C., Orem, W., Engle M.A., Klinges. J.G., Kent, D.B. and Cozzarelli, I.M. 2016.
416
Wastewater disposal from unconventional oil and gas development degrades stream quality at a West
417
Virginia injection facility. Environmental Science & Technology 50: 5517-5525.
418
419
Atkinson, G.M., Eaton, D.W., Ghofrani, H., Walker, D., Cheadle,B., Schultz, R., Shcherbakov, R., Tiampo,
420
K., Gu, J., Harrington, R.M, Liu, Y., Van der Baan, M. and Kao, H. 2016. Hydraulic Fracturing and
421
Seismicity in the Western Canada Sedimentary Basin Seismological Research Letters 87(3): 1-17.
422
423
Bachu, S. 2002. Suitability of the subsurface in Northeastern British Columbia for geological sequestration
424
of anthropogenic carbon dioxide. Alberta Geological Survey, Energy and Utilities Board, 87pp.
425
426
British Columbia Oil and Gas Commission. 2015. British Columbia’s Oil and Gas Reserves and Production
427
Report.
428
429
BC Oil and Gas Commission (BC OGC) 2018. Oil & Gas operations manual, version 1.18 published: May
430
2018, 199pp.
431
432
Carr-Wilson, S. 2014. Improving the regulation of fracking wastewater disposal in BC, Environmental Law
433
Centre, University of Victoria, ELC file No. 2014-01-04, 32pp.
434
435
3 4 5 6 7 8 9 10 11 12 13 14 15 16 17 18 19 20 21 22 23 24 25 26 27 28 29 30 31 32 33 34 35 36 37 38 39 40 41 42 43 44 45 46 47 48 49 50 51 52 53 54 55 56 57 58 59 60Council of Canadian Academies (CCA), 2014. Environmental impacts of shale gas extraction in Canada.
436
Ottawa (ON): The Expert Panel on Harnessing Science and Technology to Understand the Environmental
437
Impacts of Shale Gas Extraction, Council of Canadian Academies, 292pp.
438
439
Chesnaux, R., Dal Soglio, L., Wendling, G. 2013. Modeling the impacts of shale gas extraction on
440
groundwater and surface water resources. GeoMontreal 2013, the 66th Canadian Geotechnical Conference
441
and the 11th Joint CGS/IAH-CNC Groundwater Conference, September 29-October 3, 2013, Montreal,
442
Quebec, Canada, 10pp.
443
444
Ferguson, G. 2015. Deep Injection of Wastewater in the Western Canada Sedimentary Basin. Groundwater
445
53(2): 187-194.
446
447
Goebel, T. H. W., Hosseini, S. M., Cappa, F., Hauksson, E., Ampuero J. P., Aminzadeh, F. and Saleeby, J.
448
B. 2016. Wastewater disposal and earthquake swarm activity at the southern end of the Central Valley,
449
California, Geophysical Research Letters 43, doi:10.1002/2015GL066948.
450
451
Government of British Columbia. 2015. Northeast Water Strategy.
452
453
Hughes, D. 2015. A Clear Look at BC LNG Energy Security, environmental implications and economic
454
potential. Canadian Centre for Policy Alternatives (CCPA), 50pp.
455
456
Jackson, R.E., Gorody, A.W., Mayer, B., Row, J.W., Ryan, M.C. and Van Stempvoort, D.R. 2013.
457
Groundwater protection and unconventional gas extraction: the critical need for field-based hydrogeological
458
research. Groundwater 51(4): 488-510.
459
460
Johnson, E.G. and Johnson, L.A. 2012: Hydraulic fracture water usage in northeast British Columbia:
461
locations, volumes and trends; in Geoscience Reports 2012, British Columbia Ministry of Energy and Mines,
462
pages 41-63.
463
464
Lutz, B. D., Lewis, A. N. and Doyle, M. W. 2013. Generation, transport, and disposal of wastewater
465
associated with Marcellus Shale gas development, Water Resources Research 49, doi:10.1002/wrcr.20096.
466
467
McGarr, A. 2014. Maximum magnitude earthquakes induced by fluid injection. Journal of Geophysical
468
Research: Solid Earth 119: 1008–1019.
469
470
3 4 5 6 7 8 9 10 11 12 13 14 15 16 17 18 19 20 21 22 23 24 25 26 27 28 29 30 31 32 33 34 35 36 37 38 39 40 41 42 43 44 45 46 47 48 49 50 51 52 53 54 55 56 57473
Rivard, C., Lavoie, D., Lefebvre, R., Séjourné, S., Lamontagne, C and Duchesne, M. 2014. An overview of
474
Canadian shale gas production and environmental concerns. International Journal of Coal Geology 126: 64–
475
76.
476
477
Rubinstein, J. L., & Mahani, A. B. (2015). Myths and facts on wastewater injection, hydraulic fracturing,
478
enhanced oil recovery, and induced seismicity. Seismological Research Letters, 86(4), 1060-1067.
479
480
Scanlon, B.R., Reedy, R.C., Male, F. and Hove, M. 2016. Managing the increasing water footprint of
481
hydraulic fracturing in the Bakken Play, United States. Environmental Science & Technology 50:
10273-482
10281.
483
484
Schultz, R., Stern, V. and Gu, Y. J.2014. An investigation of seismicity clustered near the Cordel Field, west
485
central Alberta, and its relation to a nearby disposal well. Journal of Geophysical Research: Solid Earth 119:
486
3410–3423.
487
488
U.S. Energy Information Administration (US EIA). 2015. Technically recoverable shale oil and shale gas
489
resources: Canada. The statistical and analytical agency at U.S. Department of Energy, Washington, DC,
490
66p.
491
492
U.S. Environmental Protection Agency (US EPA). 2016. Hydraulic fracturing for oil and gas: impacts from
493
the hydraulic fracturing water cycle on drinking water resources in the United States, EPA-600-R-16-236ES,
494
Office of Research and Development, Washington, DC, 50pp.
495
496
U.S. Environmental Protection Agency (US EPA). 2015. Minimizing and managing potential impacts of
497
injection-induced seismicity from Class II disposal wells: practical approaches, Underground Injection
498
Control National Technical Workgroup, Washington, DC, 415pp.
499
500
U.S. Environmental Protection Agency (US EPA). 2014. Drinking water EPA Program to protect
501
underground sources from injection of fluids associated with oil and gas production needs improvement.
502
United States Government Accountability Office (GAO), Report to Congressional Requesters, GAO-14-555
503
103pp.
504
505
Vandecasteele, I., Rivero, I.M., Sala, S., Baranzelli, C., Barranco, R., Batelaan, O. and Lavalle, C. 2015.
506
Impat of shale gas development on water resources: A case study in northen Poland. Environmental
507
Management 55: 1285-1299.508
509
3 4 5 6 7 8 9 10 11 12 13 14 15 16 17 18 19 20 21 22 23 24 25 26 27 28 29 30 31 32 33 34 35 36 37 38 39 40 41 42 43 44 45 46 47 48 49 50 51 52 53 54 55 56 57 58 59 60Vengosh, A., Jackson, R.B., Warner, N., Darrah, T.H. and Kondash, A. 2014. A critical review of the risks
510
to water resources from unconventional shale gas development and hydraulic fracturing in the United States.
511
Environmental Science & Technology 48: 8334-8348.
512
513
Warner, N.R., Jackson, R.B., Darrah, T.H., Osborn, S.G., Down, A., Zhao, K., White, A. and Vengosh, A.
514
2012. Geochemical evidence for possible natural migration of Marcellus Formation brine to shallow aquifers
515
in Pennsylvania. Proceedings of the National Academy of Sciences 109(30): 11961–11966.
516
517
Warner, N.R., Christie, C.A., Jackson, R.B. and Vengosh, A. 2013. Impacts of shale gas wastewater disposal
518
on water quality in Western Pennsylvania. Environmental Science & Technology 47: 11849-11857.
519
520
Wisen, J., Chesnaux, R., Wendling, G., Werring, J., Barbecot, F. and Baudron, P. 2019. Assessing the
521
potential of cross-contamination from oil and gas hydraulic fracturing: A case study in northeastern British
522
Columbia, Canada. Journal of Environmental Management 246: 275-282.