HAL Id: hal-00934265
https://hal.archives-ouvertes.fr/hal-00934265
Submitted on 21 Jan 2014
HAL is a multi-disciplinary open access
archive for the deposit and dissemination of
sci-entific research documents, whether they are
pub-lished or not. The documents may come from
teaching and research institutions in France or
abroad, or from public or private research centers.
L’archive ouverte pluridisciplinaire HAL, est
destinée au dépôt et à la diffusion de documents
scientifiques de niveau recherche, publiés ou non,
émanant des établissements d’enseignement et de
recherche français ou étrangers, des laboratoires
publics ou privés.
Differential Profiles and Semantic Ranking
Sidahmed Benabderrahmane
To cite this version:
Sidahmed Benabderrahmane. Biomedical Knowledge Extraction Using Fuzzy Differential Profiles and
Semantic Ranking. 14th Conference on Artificial Intelligence in Medicine, AIME 2013, Murcia, Spain,
May 2013, Murcia, Spain. pp.84-93, �10.1007/978-3-642-38326-7_13�. �hal-00934265�
Biomedical Knowledge Extraction Using Fuzzy
Differential Profiles and Semantic Ranking
Sidahmed Benabderrahmane
INRIA Research Center, Campus Scientifique, France [email protected]
Abstract. Recently, technologies such as DNA microarrays allow to generate big scale of transcriptomic data used to the aim of exploring background of genes. The analysis and the interpretation of such data requires important databases and efficient mining methods, in order to extract specific biological functions belonging to a group of genes of an expression profile. To this aim, we propose here a new approach for min-ing transcriptomic data combinmin-ing domain knowledge and classification methods. Firstly, we propose the definition of Fuzzy Differential Gene Expression Profiles (FG-DEP) based on fuzzy classification and a differ-ential definition between the considered biological situations. Secondly, we will use our previously defined efficient semantic similarity measure (called IntelliGO), that is applied on Gene Ontology (GO) annotation terms, for computing semantic and functional similarities between genes of resulting FG-DEP and well known genetic markers involved in the de-velopment of cancers. After that, the similarity matrices will be used to introduce a novel Functional Spectral Representation (FSR) calculated through a semantic ranking of genes regarding their similarities with the tumoral markers. The FSR representation should help expert to inter-pret by a new way transcriptomic data and infer new genes having similar biological functions regarding well known diseases.
Availability: The semantic similarity measure and the ranking method are available at http://plateforme-mbi.loria.fr/intelligo/ranking. php.
1
Introduction
Nowadays, the pharmaceutical industries require large volume of biological data and need a sophisticated computational methods to manage and extract relevant knowledge. Recently, DNA microarrays were used for measuring the expression levels of thousands of genes under various biological conditions. Hence, gene expression data analysis proceeds in two steps: Firstly, expression profiles are produced by grouping genes displaying similar expression levels under biological situations [1]. Secondly, a functional analysis, based on functional annotations, is applied on genes sharing the same expression profile, in order to identify their relevant biological functions [2]. In fact, the main goal of this functional analysis is to identify and characterize genes that can serve as diagnostic signatures or prognostic markers for different stages of a disease. One of the interesting source
N. Peek, R. Mar´ın Morales, and M. Peleg (Eds.): AIME 2013, LNAI 7885, pp. 84–93, 2013. c
of functional annotations in the biological domain is the Gene Ontology (GO) [3]. The interpretation of transcriptomic data requires efficient mining methods for extracting specific biological functions belonging to genes of an expression profile. In this context, we introduce here, by an innovative way, a cascade of methods for mining such data combining domain knowledge and classification methods. Firstly, we propose the definition of Fuzzy Differential Gene Expression Profiles (FD-GEP) based on fuzzy classification and a differential definition of the expression between the considered biological situations. This classification approach affects genes through fuzzy sets when there are differential physiological relations between the studied biological situations. Secondly, we will use our previously defined efficient semantic similarity measure (called IntelliGO), that is applied on Gene Ontology (GO) annotation terms, for computing semantic and functional similarities between genes of resulting FD-GEP and set of well known genetic markers involved in the development of cancers. After that, the similarity matrices will be used to introduce a novel Functional Spectral Representation (FSR) calculated through a semantic ranking of genes regarding their similarities with the tumoral markers. This new paradigm for visualizing expression data displays as a bar code, genes of a given FD-GEP w.r.t. disease markers. Genes that are at the top of the sorted list are functionally similar to these markers and can hence be explored by biologists to verify experimental hypothesis.
This paper is organized as follows. The next section, outlines the presenta-tion of the used dataset and introduce the new proposed method for profiles extraction. The next subsections present the new gene functional analysis based IntelliGO similarity and semantic Ranking. Finally, we discuss in the last section the relevance of the obtained results of the proposed methods.
2
Material and Methods
2.1 DNA Microarrays Dataset
In this work, we will use a list (L) of 222 differentially expressed genes of col-orectal cancers. An Affymetrix HGU133+1microarray was used for experiments.
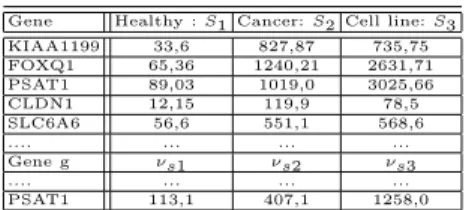
In this dataset, we dispose of three biological situations in the gene expression matrix (M ) that correspond to three biological samples: (i) healthy tissue (nor-mal); (ii): tumor tissue (cancer); (iii) cell line. We name these situations: S1, S2, S3 respectively. Each situation represents the average of multiple replicates and multiple specimens in each type of tissue during experiences [4]. An example of the expression data in the matrix M is illustrated in Table 1. The expression value for a given gene g from a set of genes G in a situation Si is given by νsi.
The selected 222 genes represent a significant fold change observed between S2 and S1. Thus biologists are interested by genes for which the expression varies between these two situations, i.e., found deregulated in cancer tissues.
1
86 S. Benabderrahmane
Table 1.Example of the expression matrix M of the 222 genes relative to colorectal cancer, used in this study. This matrix is used for extracting gene expression profiles.
Gene Healthy : S1 Cancer: S2 Cell line: S3 KIAA1199 33,6 827,87 735,75 FOXQ1 65,36 1240,21 2631,71 PSAT1 89,03 1019,0 3025,66 CLDN1 12,15 119,9 78,5 SLC6A6 56,6 551,1 568,6 .... ... ... ... Gene g νs1 νs2 νs3 .... ... ... ... PSAT1 113,1 407,1 1258,0
2.2 Definition of the Fuzzy Differential Genes Expression Profiles: FD-GEP
In the state-of-the-art methods for extracting expression profiles [1], there is no prior exploitable knowledge between the nature of biological situations. How-ever, the interpretation of groups of genes in an expression profile is usually guided by hypothesizes related to the objectives of the study. This is the case in particular when relations exist between the biological situations. Such kind of relations could be temporal when expression levels are measured at different time stamp, or kinetic when a kind of a tissue is considered but in different phys-iological states (e.g. stages of tumor). In this last case, the differences existing between pairs of situations may interest biologists, and it would be interesting to regroup together genes with the same variations between two situations regard-less of the level of expression they have each in one situation. This observation conducts us to introduce here the notion of a priori definition of Differential Genes Expression Profiles (D-GEP). It is the first contribution of this paper. Constructed from pairs of situations chosen by the user, these profiles can be considered as combinations, for each pair of situations, of theDifferential Expres-sion Sets (DES), to regroup genes having similar variations (over-expression, or even under-expression) between two situations. The membership of a gene to a given profile begins by studying its membership to a particular DES for each pair of situations. Here we use a fuzzy modeling of the expression level variations between two situations to consider noise in the data and provide an opportunity for a gene to belong to more than one profile. With our data set, and having three situations, we have 3 possible pairs of situations (S3, S1) (S2,S1) and (S3,S2),
respectively. For n situations, we can have n(n − 1)/2 pairs of situations. Identi-fying a D-GEP for a gene g leads us to affect this gene, for each pair of situation (Si, Sj), either in the set of genes over-expressed in Siwith respect to Sj (which
we denote Overi,j), or in the set of genes under-expressed in Si compared to Sj
(which we denote Underi,j), or rather in set of genes with similar expression in
Si w.r.t. Sj (which we denote Isoi,j). By extension, the sets Overi,j, Underi,j,
Isoi,j are called Differential Expression Sets (DES), and allow to represent the
differential expression of genes between two situations of interest Si and Sj.
Consequently, the formal definition of a D-GEP is a K-uplet of DES, where K is the number of pairs of situations. For example, in our case, the profile (Over3,1,
(S3) w.r.t. Normal tissue (S1), over expressed in cancer (S2) w.r.t. Normal
tis-sue (S1), and under expressed in the Cell Line (S3) w.r.t. Cancer (S2). As we
said before, the affectation of genes in the different DES is performed with fuzzy logic. Firstly, we need to define a value of variation of expression noted ξi,j to
represent the difference of the expression of a gene g in two situations (Si, Sj):
ξi,j(g) =
νsi−νsj
mink=1..n νsk for all i, j in k situations. The proposed fuzzy model
con-ducts to define a threshold value σ for the expression variation value ξi,j(g), and
for each pair of situations (Si,Sj). Three membership functions of three fuzzy
sets allow to define the affectation of genes to DES depending on the value of ξi,j(g). These membership functions are defined as:
Overi,j: G −→ [0, 1] Overi,j(g) =
1 if ξi,j(g) ≥ σ 1 σ× ξi,j(g) if 0 < ξi,j(g) < σ 0 otherwise
U nderi,j: G −→ [0, 1] U nderi,j(g) =
1 if ξi,j(g) ≤ −σ −1 σ ×ξi,j(g) if −σ < ξi,j(g) < 0 0 otherwise
Isoi,j: G −→ [0, 1] Isoi,j(g) =
0 if ξi,j(g) < −σ or ξi,j(g) > σ 1 σ× ξi,j(g) + 1 if − σ < ξi,j(g) < 0 −1 σ × ξi,j(g) + 1 if 0 < ξi,j(g) < σ
The defuzzification process allows the final classification of a gene g to one or more DES in accordance to a given threshold value µ. This is done with the following constraint: if the value taken by function Overi,j(g), U nderi,j(g)
or Isoi,j(g) is ≥ µ, thus the gene is classified in the corresponding DES. The
figure (1) represents the three membership functions Overi,j, U nderi,j, Isoi,j.
For example, for the gene g, we have Overi,j(g) = 0.25, U nderi,j(g) = 0,
Isoi,j(g) = 0.75. We observe that for µ = 0.5, this gene is classified in the
DES Isoi,j only, otherwise for µ = 0.25 it will be affected both in Isoi,j with
membership probability of 0.75 and Overi,j with a complementary membership
value of 0.25. We can remark that with this modelization, the bi-classification criteria of a gene in two DES is possible for µ ≤ 0.5. Hence, a D-GEP is a com-bination of DES, and the fuzzy modelization introduced here allows to genes to be affected to more than one D-GEP. By consequence a Fuzzy differential genes expression profile (FD-GEP) is a D-GEP where the affectation of genes in DES is performed with fuzzy logic. Note that, with 3 situations, and with 3 DES, we can obtain 27 possible FD-GEP. As we can observe, there are two parameters that can be taken into account during the classification algorithm, namely: σ and µ. The different values affected to these variables depend on the used datasets. We performed an exploratory analysis by testing different values for µ={0.1, 0.2, 0.3, 0.4, 0.5} and σ={0.1, 0.2, 0.3, 0.4, 0.5, 0.6, 0.7, 0.8, 0.9, 1}. Each pair of values of the two parameters were tested for extracting the possible FD-GEP profiles. Results for the different combination are not shown
88 S. Benabderrahmane
Fig. 1.Representation of the membership functions defining the affectation of a gene to the differential expression sets Overi,j, U nderi,j, Isoi,jused for defining the FD-GEP
profiles.
here. Although, we used some prior knowledge to eliminate certain values that generate outliers FD-GEP profiles. For example, for σ ≥ 0.6 we observed that some genes were classified in the DES Iso2,1(same expression in cancer and
nor-mal tissues), even if in our dataset the genes are differentially expressed between the two situations (S2) and (S1). We decided after multiple testing, to keep the combination (µ,σ)=(0.3, 0.4) which expects a reasonable number of genes in the obtained profiles. With this pair of values, and from the list of 222 colorectal cancer genes, we extracted the FD-GEP expression profiles presented in Table 2. The number of genes in each profile is displayed in the diagonal of the matrix, while overlaps (due to fuzzy classification) are observed between some profiles in terms of number of shared genes are displayed in the rest of cells of the matrix.
Table 2.Distribution of genes in the obtained expression profiles. Note that if a cell is empty then the two corresponding FD-GEP profiles do not share any gene. The diagonal represents the number of genes in each FD-GEP.
Name of the FD-GEP Definition of the FD-GEP Pr
o fi le 1 Pr o fi le 2 Pr o fi le 3 Pr o fi le 4 Pr o fi le 1 1 Pr o fi le 1 3 Pr o fi le 1 4 Pr o fi le 1 5 Pr o fi le 2 0 Pr o fi le 2 1
Profile 1 Over2,1,Over3,1,Over3,2 51 2
Profile 2 Over2,1,Over3,1,Under3,2 108 17 24 1
Profile 3 Over2,1,Over3,1,Iso3,2 30 1 1
Profile 4 Over2,1,Under3,1,Over3,2 1
Profile 11 U nder2,1,Over3,1,Under3,2 1
Profile 13 U nder2,1,Under3,1,Over3,2 9 1
Profile 14 U nder2,1,Under3,1,Under3,2 7 1
Profile 15 U nder2,1,Under3,1,Iso3,2 5
Profile 20 Iso2,1,Over3,1,Under3,2 56
2.3 Gene Expression Functional Analysis
Calculating Semantic and Functional Similarity between Genes: A lot of functional analysis methods have been proposed using either statistical enrichment [5] or gene functional clustering [6]. In this last case, a semantic similarity is used for grouping genes regarding Gene Ontology (GO) functions [3]. We admit that the performance of the used similarity will have an impact on the clustering results. Recently, we proposed an hybrid functional analysis method combining both fuzzy clustering and statistical enrichment analysis [7,8,9], using our IntelliGO measure [10]. Our second contribution in this paper (after having defined FD-GEP), is to propose a complementary visualization method that should help biologists to investigate interesting genes during the transcriptomic data study. The principle of the technique is detailed below.
In the rest of the experiments, we will use the same list of 222 colorectal can-cer genes, for computing the IntelliGO similarity matrices. As a first step, and in order to have a global overview of the distribution of the biological annotations of the used list of genes, we produced a Heatmap with a two way hierarchical clustering. The results are shown in figure (2). Despite the change in color in-tensity in different regions of the heatmap, several clusters can be distinguished in its diagonal. Homogeneous cluster in the upper left of the heatmap and with very little cross similarity with other genes in the data set has been studied from the point of view of its gene content. The strong functional similarity be-tween these genes can be explained by recurrent Biological Process annotations on transport processes. Transport processes are important in the physiology of the digestive system and cluster genes are already known to be deregulated in colorectal cancer. This is the case of gene AQP8 aquaporin 8 whose expression is no longer detectable in colorectal tumors [11]. In fact AQP8 gene is found in the FD-GEP Profile 14 corresponding to genes under-expressed in tumor vs the normal situation. Another gene (ATP11A) is also present in the functional cluster analyzed here, with an annotation transport of phospholipids, and was recently described as a new predictive marker of metachronous metastasis of colorectal cancer [12]. Associated in our study to FD-GEP Profile 1, it actually appears as over-expressed in tumor position relative to the healthy situation. These two genes can be considered as positive controls, confirming the validity of classification results.
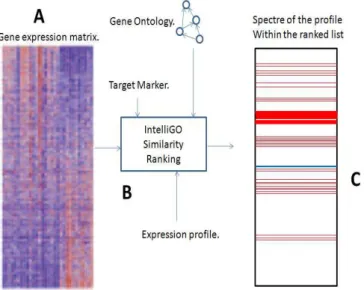
Functional Spectral Representation: A Genes Functional Ranking Ap-proach: As reported above, to enhance the analysis of the transcriptomic data, we propose a new functional spectral representation of genes. The main idea of the proposition is summarized in the Figure (3). Firstly, we proceed by ranking with descending order (from most to less similar) an input list of genes regarding their IntelliGO functional semantic similarity with given well known biological markers. After the ranking step, we identify for a given FD-GEP profile, the position of its genes in the ranked list. The position of each gene of this profile is marked with a red line. Blue line indicates the 0.5 functional similarity thresh-old. The main objective here is to verify if the genes belonging to the profile
90 S. Benabderrahmane
Fig. 2.Generated Heatmap with 222 colorectal cancer
(marked with red lines) are top ranked in the list or not, i.e., the number of red lines over the blue line is important or not. If it is the first case, these genes are judged to be functionally similar to the well-known biological markers and therefore they could be suggested to biologists for further analysis.
In preliminary experiences, we have selected 6 genes involved in target WNT signaling pathway2known as transcriptionally repressed in colorectal cancer [13].
Genes of this pathway are known as contributors in mutations in degenerative diseases and cancers. Namely we have chosen: AXIN2 (The Axin-related pro-tein), CD44 (Cell-surface glycopropro-tein), MET (MNNG HOS Transforming gene), MYC (v-myc myelocytomatosis viral oncogene homolog), SOX9 (SRY (sex de-termining region Y)-box 9) and ASCL2.
Results for FD-GEP profile1 are presented in Figure (4). We can observe that with AXIN2, MET, MYC, SOX9 markers, the blue line (50% of similarity) is positioned in low levels of the ranked list. It means that genes of this profile are very functionally similars to these markers, in particular with MET and MYC (≥60% of genes of the profile) as it is shown in figure 5. We recall that these two biomedical markers are confirmed to be catalyst in the colorectal cancer, and we know that the studied data set is relative to this kind of cancer [14]. Thus, these results confirm the pertinence of the proposed approach. For deepening the analysis, we processed the same analysis for FD-GEP 2, 3, 14, 20 since genes in these profiles are dysregulated in the cancer situation vs normal (either Over or Under in S2vs S1). We calculated for each profile its FSR and also the
average percentage of its genes having functional similarity w.r.t. the used cancer biomedical markers over than 0.50. Results are shown in figure 5. We can observe that all FD-GEPs except Profile 14 have similar functional background regarding the used markers, and it appears very clearly that genes of the used data set share biological processes that are very similar to MET and MYC cancer genes (more than 40 %). Hence, we can suggest to biologists the top positioned genes in the produced ranked lists of the FSRs of each profile, in order to verify their
2
Fig. 3.A Functional Spectral Representation (FSR) overview illustrating the method. A: An expression data matrix is used as input. B: The IntelliGO functional similarity is calculated within all genes of the input list and a given bio-marker. C: The ranked list is displayed by highlighting with red lines genes of a studied expression profiles. A blue line is used to identify the 0.5 functional similarity threshold.
sequence similarity with the used markers. It could be then possible to extend the WNT signaling pathway with those genes, and verify other hypothesis of their involvement in the colorectal cancers.
3
Conclusion and Perspectives
In this paper, we proposed data mining methods combining classification and visualization for analyzing transcriptomic data by an innovative way. In a first step, we propose a new definition of the Fuzzy Differential Genes Expression Pro-files FD-GEP, for classifying genes through fuzzy sets when there are differential physiological relations between biological situations. After the step of profiles extraction, a gene functional analysis is essential to give sense to the affected genes in the profiles. We propose a new functional analysis approach, with a new paradigm for visualizing expression data through a process of semantic ranking regarding interesting disease markers. Indeed, the proposed FSR displays as a bar code, genes of a given FD-GEP w.r.t. disease markers. Genes that are at the top of the sorted list are functionally similar to these markers and can hence be explored by biologists to verify experimental hypothesis.
Further, we would consider the idea of performing the same study on genes belonging to other disease processes. Indeed, the OMIM database (Online
92 S. Benabderrahmane
Fig. 4.Functional Spectral Representation (FRS) using genes of FD-GEP Profile 1
Fig. 5.Average percentage of genes of an FD-GEP having functional similarity w.r.t. a cancer biomedical markers over than 0.50. Values are varying from a marker to another for the considered FD-GEPs. We can observe that majority of the FD-GEP have similar biological behavior regarding their functional similarities with biological functions of the markers.
Mendelian Inheritance in Man)3provides markers for different types of diseases
that are listed in this database. One can test these markers with different lists of gene expression data.
References
1. Eisen, M.B., Spellman, P.T., Brown, P.O., Botstein, D.: Cluster analysis and dis-play of genome-wide expression patterns. Proceedings of the National Academy of Sciences of the United States of America 95(25), 14863–14868 (1998)
2. Khatri, P., Draghici, S.: Ontological analysis of gene expression data: current tools, limitations, and open problems. Bioinformatics 21(18), 3587–3595 (2005)
3. Daniel, B., et al.: The GOA database in 2009–an integrated Gene Ontology Anno-tation resource. Nucl. Acids Res. 37(suppl. 1), D396–D403 (2009)
4. Benabderrahmane, S., Devignes, M.-D., Sma¨ıl-Tabbone, M., Napoli, A., Poch, O., Nguyen, N.-H., Raffelsberger, W.: Analyse de donn´ees transcriptomiques: Mod´elisation floue de profils dexpression diff´erentielle et analyse fonctionnelle. In: INFORSID, pp. 413–428 (2009)
5. Martin, D., Brun, C., Remy, E., Mouren, P., Thieffry, D., Jacq, B.: GOToolBox: functional analysis of gene datasets based on Gene Ontology. Genome Biology 5(12) (2004)
6. Dennis, G., Sherman, B., Hosack, D., Yang, J., Gao, W., Lane, H., Lempicki, R.: David: Database for annotation, visualization, and integrated discovery. Genome Biology 4(9), R60 (2003), A previous version of this manuscript was made available before peer review at http://genomebiology.com/2003/4/5/P3
7. Benabderrahmane, S.: Ontology-based gene set enrichment analysis using an effi-cient semantic similarity measure and functional clustering. In: Proceedings of the 4th International conference on Web and Information Technologies (ICWIT 2012), Sidi Bel Abbes, Algeria, April 29-30, pp. 151–159 (2012)
8. Benabderrahmane, S., et al.: Functional classification of genes using semantic dis-tance and fuzzy clustering approach: evaluation with reference sets and overlap analysis. I. J. Computational Biology and Drug Design 5(3/4), 245–260 (2012) 9. Sidahmed, B., et al.: Ontology-based functional classification of genes: Evaluation
with reference sets and overlap analysis. In: 2011 IEEE International Conference on Bioinformatics and Biomedicine Workshops (BIBMW), pp. 201–208 (November 2011)
10. Sidahmed, B., et al.: Intelligo: a new vector-based semantic similarity measure including annotation origin. BMC Bioinformatics 11(1), 588 (2010)
11. Helene, F., et al.: Differential expression of aquaporin 8 in human colonic epithelial cells and colorectal tumors. BMC Physiology 1(1), 1 (2001)
12. Miyoshi, N., et al.: Atp11a is a novel predictive marker for metachronous metastasis of colorectal cancer. Oncology Reports 23(2), 505–510 (2010)
13. Jiang, X., et al.: Dact3 is an epigenetic regulator of wnt b catenin signaling in colorectal cancer and is a therapeutic target of histone modifications. Cancer Cell 13(6), 529–541 (2008)
14. Hiroya, T., et al.: c met expression level in primary colon cancer a predictor of tumor invasion and lymph node metastases. Clin. Cancer Res. 9(4), 1480–1488 (2003)
3