Quantifying diffusion in biofilms: from model hydrogels
to living biofilms
par
Mahmood Golmohamadi
Département de chimie Faculté des Arts et des Sciences
Thèse présentée à la Faculté des études supérieures et postdoctorales en vue de l’obtention du grade de Ph.D.
en Chimie
Juillet 2012
Faculté des études supérieures et postdoctorales
Cette thèse intitulée:
Quantifying diffusion in biofilms: from model hydrogels
to living biofilms
Présentée par: Mahmood Golmohamadi
a été évaluée par un jury composé des personnes suivantes:
Michel Lafleur, président-rapporteur Kevin J. Wilkinson, directeur de recherche Suzanne Giasson, membre du jury
Reghan Hill, examinateur externe
Résumé
Les biofilms sont des communautés de microorganismes incorporés dans une matrice exo-polymérique complexe. Ils sont reconnus pour jouer un rôle important comme barrière de diffusion dans les systèmes environnementaux et la santé humaine, donnant lieu à une résistance accrue aux antibiotiques et aux désinfectants. Comme le transfert de masse dans un biofilm est principalement dû à la diffusion moléculaire, il est primordial de comprendre les principaux paramètres influençant les flux de diffusion. Dans ce travail, nous avons étudié un biofilm de Pseudomonas fluorescens et deux hydrogels modèles (agarose et alginate) pour lesquels l’autodiffusion (mouvement Brownien) et les coefficients de diffusion mutuels ont été quantifiés. La spectroscopie par corrélation de fluorescence a été utilisée pour mesurer les coefficients d'autodiffusion dans une volume confocal de ca. 1 m3 dans les gels ou les biofilms, tandis que les mesures de diffusion mutuelle ont été faites par cellule de diffusion. En outre, la voltamétrie sur microélectrode a été utilisée pour évaluer le potentiel de Donnan des gels afin de déterminer son impact sur la diffusion.
Pour l'hydrogel d'agarose, les observations combinées d'une diminution du coefficient d’autodiffusion et de l’augmentation de la diffusion mutuelle pour une force ionique décroissante ont été attribuées au potentiel de Donnan du gel. Des mesures de l'effet Donnan (différence de -30 mV entre des forces ioniques de 10-4 et 10-1 M) et l'accumulation correspondante d’ions dans l'hydrogel (augmentation d’un facteur de 13 par rapport à la solution) ont indiqué que les interactions électrostatiques peuvent fortement influencer le flux de diffusion de cations, même dans un hydrogel faiblement chargé tel que l'agarose. Curieusement, pour un gel plus chargé comme l'alginate de calcium, la variation de la force ionique et du pH n'a donné lieu qu'à de légères variations de la diffusion de sondes chargées dans l'hydrogel. Ces résultats suggèrent qu’en influençant la diffusion du soluté, l'effet direct des cations sur la structure du gel (compression et/ou gonflement induits) était beaucoup plus efficace que l'effet Donnan. De même, pour un biofilm bactérien, les coefficients d'autodiffusion étaient pratiquement constants sur toute une gamme de force ionique (10-4-10-1 M), aussi bien pour des petits solutés chargés négativement ou positivement (le rapport du coefficient d’autodiffusion dans biofilm sur
celui dans la solution, Db/Dw ≈ 85 %) que pour des nanoparticules (Db/Dw≈ 50 %),
suggérant que l'effet d'obstruction des biofilms l’emporte sur l'effet de charge.
Les résultats de cette étude ont montré que parmi les divers facteurs majeurs qui affectent la diffusion dans un biofilm environnemental oligotrophe (exclusion stérique, interactions électrostatiques et hydrophobes), les effets d'obstruction semblent être les plus importants lorsque l'on tente de comprendre la diffusion du soluté. Alors que les effets de charge ne semblaient pas être importants pour l'autodiffusion de substrats chargés dans l'hydrogel d'alginate ou dans le biofilm bactérien, ils ont joué un rôle clé dans la compréhension de la diffusion à travers l’agarose. L’ensemble de ces résultats devraient être très utiles pour l'évaluation de la biodisponibilité des contaminants traces et des nanoparticules dans l'environnement.
Mots-clés : agarose, alginate de calcium, autodiffusion, biofilm, cellule de diffusion,
diffusion mutuelle, potentiel de Donnan, spectroscopie de corrélation de fluorescence, voltamétrie sur microélectrode.
Abstract
Biofilms are primarily communities of microorganisms embedded in a complex exopolymer matrix. They are thought to play an important role as diffusive barriers in environmental systems and human health, resulting in increased resistance to disinfectants and antibiotics. Since mass transport in a biofilm is primarily due to molecular diffusion, it is critical to understand the main parameters influencing diffusive fluxes in a biofilm. In this thesis, a Pseudomonas fluorescens biofilm and two model hydrogels, (agarose and calcium alginate), were investigated. Both self-diffusion (Brownian motion) and mutual diffusion coefficients were quantified. Fluorescence correlation spectroscopy was used to measure the self-diffusion coefficients in a ca. 1 m3 confocal volume in the gels or biofilms, whereas a diffusion cell setup was employed for mutual diffusion measurements. In addition, microelectrode voltammetry was used to evaluate Donnan potential of the gels in order to determine its impact on diffusion.
For the agarose hydrogel, the combined observations of a decreasing self-diffusion coefficient coupled with increasing mutual diffusion as a function of a decreasing ionic strength have been attributed to the gel’s Donnan potential. Measurements of the Donnan effect (difference of -30 mV between ionic strengths of 10-4 and 10-1 M) and the corresponding accumulation of ions in the hydrogel (13x enhancement with respect to the bulk solution) indicated that electrostatic interactions can strongly influence the diffusive flux of cations, even in a weakly charged hydrogel, such as agarose. Somewhat surprisingly, for a more highly charged gel such as calcium alginate, varying ionic strength and pH resulted in only small changes to the diffusion of charged probes in the hydrogel. These results suggested that the direct effect of the cations on gel structure (due to an induced swelling or compression) was much more effective than the Donnan effect when influencing solute diffusion. Similarly, for a bacterial biofilm, self-diffusion coefficients were virtually constant across a range of examined ionic strengths (10-4-10-1 M) for both negatively and positively charged small solutes (Db/Dw≈85%) and nanoparticles
(Db/Dw≈50%), suggesting that the obstruction effect of the biofilms again overwhelmed the
The results of this work indicated that among the various major factors affecting diffusion in an oligotrophic environmental biofilm (steric exclusion, hydrophobic and electrostatic interactions), obstruction effects appeared to be the most important when attempting to understand the solute diffusion. While charge effects did not appear to be important to the self-diffusion of charged substrates in the alginate hydrogel or bacterial biofilm, they were key to understanding diffusion through another gel, with numerous biomedical and environmental applications, i.e. agarose. These results should be extremely useful when evaluating the bioavailability of the trace contaminants and nanoparticles in the environment.
Keywords: agarose, biofilm, calcium alginate, Donnan Potential, diffusion cell,
fluorescence correlation spectroscopy, microelectrode voltammetry, mutual diffusion, nanoparticles, self-diffusion.
Table of contents
Chapter 1 Introduction ... 1 1.1. Overview... 1 1.2. Diffusion ... 4 1.2.1 Self-diffusion... 4 1.2.2 Mutual diffusion ... 5 1.3. Diffusion in hydrogels ... 71.4. Donnan potential of a charged hydrogel... 8
1.5. Diffusion models in hydrogels ... 10
1.6. Diffusion in biofilms ... 12
1.7. Techniques for measuring biofilm structure ... 15
1.8. Techniques for diffusion measurements ... 16
1.8.1 Measuring self-diffusion coefficients ... 16
1.8.2 Measuring mutual diffusion coefficients ... 17
1.8.3 Mutual versus self diffusion coefficients ... 19
1.9. Objectives ... 19
1.10. References... 20
Chapter 2 Optimization of the experimental methods used to quantify diffusion... 32
2.1. Overview... 32
2.2. Fluorescence correlation spectroscopy (FCS)... 32
2.2.1 FCS theory... 32
2.2.2 FCS materials and methods... 40
2.2.3 FCS results and discussion... 41
2.3. Determination of the Donnan potentials by microelectrode voltammetry ... 46
2.3.1 Voltammetric theory ... 46
2.3.2 Voltammetric materials and methods ... 48
2.3.3 Voltammetric results and discussion ... 50
2.4. Diffusion equilibration technique (DET)... 52
2.4.1 DET theory... 52
2.4.2 DET materials and methods ... 54
2.5. References... 55
Chapter 3 Diffusion and partitioning of cations in an agarose hydrogel ... 60
3.1. Abstract... 60
3.2. Introduction... 61
3.3. Theory... 62
3.3.1 Measurements of mutual diffusion ... 62
3.3.2 Measurements of self-diffusion... 62
3.3.3 Measurement of Donnan potential and the Donnan partition coefficient .... 63
3.4. Materials and methods... 64
3.4.1 Chemicals ... 64
3.4.2 Diffusion equilibration (mutual diffusion coefficients)... 64
3.4.3 Fluorescence correlation spectroscopy (self-diffusion coefficients) ... 65
3.4.4 Voltammetry (Donnan potential and Donnan partition coefficients) ... 66
3.4.5 Chemical extraction (partition coefficients)... 67
3.5. Results and discussion ... 67
3.5.1 Role of ionic strength on mutual diffusion ... 67
3.5.2 Role of ionic strength on self-diffusion ... 68
3.5.3 Role of ionic strength on Donnan potentials ... 70
3.5.4 Role of pH on Donnan potentials and diffusion ... 72
3.5.5 Comparison of mutual and self-diffusion ... 75
3.6. Conclusion ... 78
3.7. Acknowledgements ... 78
3.8. Supporting information... 78
3.9. References... 79
Chapter 4 Diffusion of ions in a calcium alginate hydrogel-Structure is the primary factor controlling diffusion... 82 4.1. Abstract... 82 4.2. Introduction... 83 4.3. Experimental ... 84 4.3.1. Materials... 84 4.3.2. Hydrogel preparation ... 84 4.3.3. Diffusion measurements ... 85
4.3.4. Swelling measurements... 86
4.4. Results and discussion ... 87
4.4.1. Effect of probe size and gel concentration on diffusion coefficient ... 87
4.4.2. Effect of probe charge on diffusion coefficient... 88
4.4.3. Effect of ionic strength on diffusion and gel structure ... 90
4.4.4. Effect of pH on diffusion ... 94
4.5. Conclusion ... 96
4.6. Acknowledgements ... 97
4.7. References... 97
4.8. Supporting Information ... 102
4.8.1. Debye length calculations in the electrolytes ... 102
4.8.2. Internal solution effect on swelling ... 103
4.8.3. Modeling size effect... 105
4.8.4. Effect of alginate Donnan potentials on solute diffusion... 108
4.8.5. References ... 110
Chapter 5 The role of charge on the diffusion of solutes and nanoparticles (silicon nanocrystals, nTiO2, nAu) in a biofilm ... 112
5.1. Environmental context... 112
5.2. Abstract... 112
5.3. Introduction... 113
5.4. Materials and methods... 115
5.4.1. Preparation of biofilms ... 115
5.4.2. Fluorescence correlation spectroscopy ... 116
5.4.3. Nanoparticles (NP) ... 117 5.5. Results... 118 5.6. Discussion ... 125 5.7. Conclusion ... 128 5.8. Acknowledgements ... 128 5.9. References... 129 5.10. Supporting information... 133
5.10.1. The Structures and optical information on the fluorescent probes ... 133
5.10.3. FCS of the probes and nanoparticles in water and biofilm ... 134
5.10.4. Background fluorescence of the biofilm ... 136
5.10.5. Labelling nanoparticles with oppositely charged probes ... 138
5.10.6. Agglomeration of nanoparticles ... 139
5.10.7. Nature of the biofilm and biofilm measurements... 140
5.10.8. Reference... 141
Chapter 6 Conclusion and future perspectives ... 142
6.1. Overview... 142
6.2. Applications for hydrogels... 143
6.3. Applications for Biofilms ... 147
6.4. Techniques ... 149
6.5. Future perspectives ... 149
List of tables
Table S IV.1. Donnan partition coefficients determined from charge density calculations and from shifts in the voltammetric half wave potential measurements ... 110 Table V.1. Self-diffusion coefficients measured in water (Dsw) by FCS... 119
Table SV. 1. The structure and fluorescence spectra of small fluorescent probes ... 133 Table SV. 2. Diffusion coefficients of nanoparticle of nSi6 in biofilm with and without
List of figures
Figure 1.1. Confocal laser scanning microscopy (CLSM) image of a P. fluorescens
biofilm grown in the presence of 10-5 M Fe(III). ... 2
Figure 1.2. Schematic representation of the potential distribution (blue solid line) near the membrane surface (red dotted line) ... 10
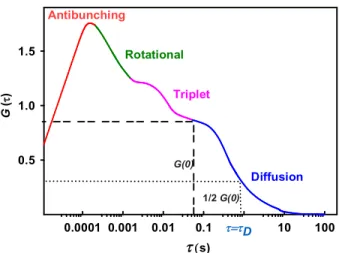
Figure 2.1. Typical autocorrelation function of the fluorescence intensity fluctuations. ... 33
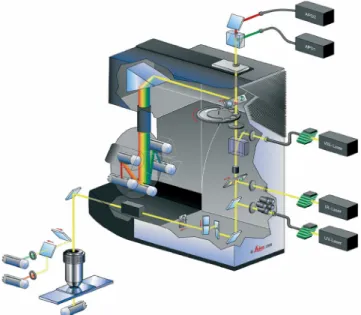
Figure 2.2. The principles of confocal microscopy. ... 34
Figure 2.3. The three dimensional Gaussian distribution assumed to derive the confocal volume function... 39
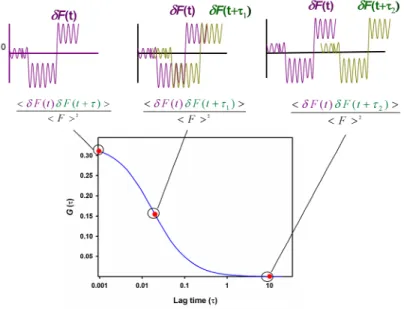
Figure 2.4. The typical correlation curve of FCS from autocorrelation of fluorescence fluctuations. ... 40
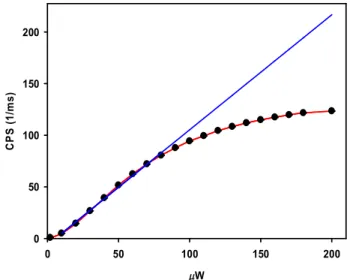
Figure 2.5. Emission intensity (counts per second: CPS) as a function of laser intensity for rhodamine 110 (R110);... 42
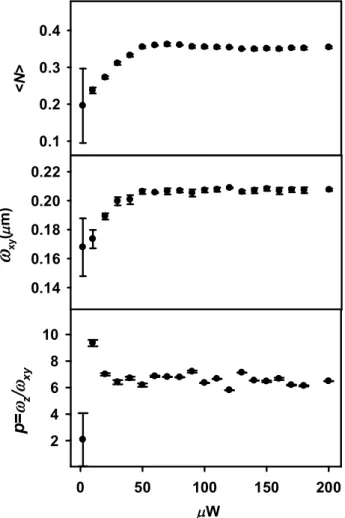
Figure 2.6. The number of fluorescence molecules in the confocal volume, <N>, lateral (xy) dimension of the confocal volume and the ratio, p=z/xy ... 43
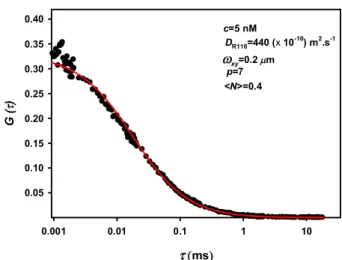
Figure 2.7. Autocorrelation function of 5 nM of R110 for a laser power of 60 μW ... 44
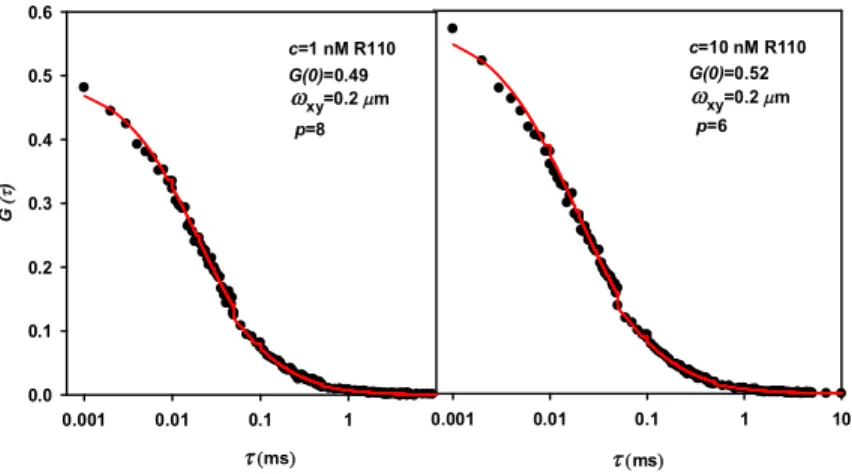
Figure 2.8. Correlation curves for two concentrations of R110 ... 45
Figure 2.9. The dimensions of confocal volume (xy and p=z /xy) for the concentrations of R110 in water from 1-10 nM (I=10-2 M; pH=6).. ... 45
Figure 2.10. The Gold microelectrode in a glass support (r0=25 μm). ... 47
Figure 2.11. The instrument used to polish the gold microelectrode ... 48
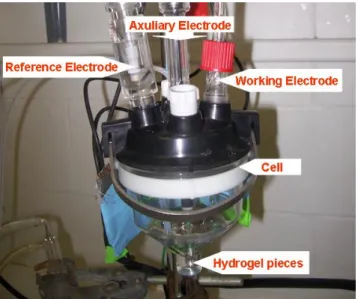
Figure 2.12. Photo of the electrochemical cell for microelectrode voltammetry... 49
Figure 2.13. Metal ion voltammogram obtained from a gel-sol system in Donnan equilibrium. ... 50
Figure 2.14. Current transient for Cd ion reduction at Ed = -0.8 V in the gel and in solution... 51
Figure 2.15. (a) The diaphragm diffusion cell used to measure mutual diffusion coefficients; (b) schematic of the concentration profile in the diffusion cell. . 52
Figure 2.16. Cd concentration in the receiving compartment of a diffusion cell as a function of time; ... 55
Figure 3.1. Apparent mutual diffusion coefficients ( m g
D
) as a function of ionic strength in a low melt (1.5%) agarose ... 68 Figure 3.2. Self-diffusion coefficients for (a) R6G+ in water, s
w
D (◊), and in the low melt (1.5%) agarose hydrogel ... 69 Figure 3.3. (a) Donnan potentials ψD (E) (●); (b) partition coefficients ΠD(E) calculated
from ψD(E) (); and overall partition coefficients (■); (c) Cd
concentrations in the gel ... 71 Figure 3.4. (a) Donnan potential as a function of pH in a low melt (1.5%) agarose gel,
ψD calculated from the half-potential shifts (●)... 73
Figure 3.5. (a) Mutual diffusion coefficients (diffusion cell measurements) of Cd as a function of pH for a low melt (1.5%) agarose... 75 Figure 3.6. Mutual diffusion coefficients as a function of (a) ionic strength (cCd =10-5 M;
pH=7) and (b) pH (cCd =10-5 M; I= 5x10⁻⁴ M) ... 77
Figure 4.1. Diffusion coefficient of dextrans (3-70 kD)in the calcium alginate hydrogel as a function of their hydrodynamic radii, rh... 87
Figure 4.2. Effect of solute charge on diffusion within a calcium alginate hydrogel... 89 Figure 4.3. Diffusion coefficients of the R6G+ in the 1% w/w hydrogel with respect to
that in the water (Dsg/Dsw) as a function of ionic strength ... 90
Figure 4.4. (a) Diffusion coefficients of R6G+ in water (○) and in the alginate... 91 Figure 4.5. (a) Swelling of calcium alginate (1% w/w) in various ionic strengths ... 93 Figure 4.6. (a) Swelling of the calcium alginate (1% w/w) as a function of pH for ionic
strengths of 10-3 M (●) and 10-2 M (○) ... 95 Figure S4.1. (a) Swelling of 1% (w/w) calcium alginate with ( ) and without ( ) the
addition of an intermediate gelation solutions. ... 104 Figure S4.2. Dg/Dw values for dextran probes of various sizes in calcium alginate for an
ionic strength I=10-2 M [Ca/Na=3/1] [Philips model (solid dark line) and Amsden model (solid red line) ... 107 Figure S4.3. Calculated values of Dg/Dw for Cd2+ based upon Donnan partition
coefficients or by using Donnan partition coefficients... 109 Figure 5.1. Dsb/Dsw versus charge of solutes including; TMRM (z=+1), RB (z=0), Org
Figure 5.2. Diffusion coefficients in biofilm normalized by those in water (Dsb/Dsw) as a
function of the ionic strength of the bulk solutions ... 121 Figure 5.3. (a) Diffusion coefficients of the variably charged nSi in the biofilm (●) and
in water (○)... 122 Figure 5.4. Diffusion coefficients of the nanoparticles obtained following their labelling
with a similarly charged fluorescent probe ... 124 Figure 5.5. (a) The diffusion coefficient of polystyrene nanoparticle (dH=51 nm) in
water () and biofilm (○)... 127 Figure S5.1. (a) The fluorescence correlation of Oregon 2C in water () superimposed
on that of biofilm (○) ... 135 Figure S5.2. FCS correlation curves for the diffusion of the nSi6 nanoparticle. ... 137
Figure S5.3. Diffusion coefficients obtained when the nanoparticles were labelled with oppositely charged fluorescent probes... 138 Figure S5.4. FCS cross-correlation curves for the nSi2 nanoparticles in water (pH=7.1,
I=10-3 M) ... 139 Figure S5.5. CSLM images of the Pseudomonas fluorescens biofilm. ... 140 Figure S5.6. CSLM imaging of the Pseudomonas fluorescens biofilm in the XZ
direction. ... 140 Figure 6.1. Schematic of the role of the Donnan potential on mutual diffusive fluxes
through a hydrogel... 144 Figure 6.2. Schematic representation of the Donnan effect on speciation in bulk solution
List of abbreviations
A Surface area
a Activity
b Background factor
CPS Counts per second
c Concentration
cw Concentration in bulk solution
g c Concentration in hydrogel C Coulomb dH Hydrodynamic diameter D Dalton D Diffusion coefficient Ds Self-diffusion coefficient
Dm Mutual diffusion coefficient
w
D Diffusion coefficient in water
g
D Diffusion coefficient in hydrogel
s g
D Self diffusion coefficient in hydrogel
m g
D Mutual diffusion coefficient in hydrogel
DET Diffusion equilibrium technique
DPSS Diode-pumped solid-state laser
F Faraday constant
F Opposing force
FCS Fluorescence Correlation Spectroscopy
GF-AAS Graphite furnace atomic absorption spectrometry
GDL D-glucono-δ-lactone
G() Autocorrelation function
h Hour
Hz Hertz
I Ionic strength
I◦ The peak maximum excitation intensity of laser beam
IL Limiting current
K Boltzman constant kD Kilodalton L Liter m Meter m Mass mV Milivolt mL Mililiter M Molarity
n Number of electrons transferred
n Number of particles in the confocal volume
nM Nanomolar
nTiO2 Titanium oxide nanoparicle
nAu Gold nanoparticle
nSi Silicon nanoparticle
nm Manometer
N Average number of particles in the confocal volume
NA Numeric aperture of objective
NP Nanoparticle
Oregon 1C/Org 1C Oregon green 488 carboxylic acid, succinimidyl ester Oregon 2C/Org 2C Oregon green 488 carboxylic acid
P Pressure
p The confocal volume shape factor
PAA Polyacrylic acid
PDDA Poly diallyl dimethyl ammonium chloride
q Fluorescence quantum efficiency
R The universal gas constant
R6G Rhodamine 6G R123 Rhodamine 123 RB Rhodamine B R110 Rhodamine 110 s Second S Swelling factor
TMRM Tetramethylrhodamine, methyl ester
t Time
T Temperature
Veff The effective confocal volume
V Volume
x Distance
z Charge number of the electrolytes
zg Charge number of the functional groups in the gel
Degree of anomalous diffusion
Viscosity of solution
Absorptivity coefficient
l Gel thickness
μ Micron
W Microwatt
The electrostatic (Donnan) partition coefficient m
g
D
Apparent mutual diffusion coefficient
ρ Volume charge density of the gel
Retardation factor
Delay lag time
T Triplet time
xy Transversal radii of the confocal volume
z Longitudinal radii of the confocal volume
ψD Donnan potential
Zeta potential
Acknowledgements
Special thanks goes to my supervisor, Professor Kevin Wilkinson, for his knowledge and sustainable efforts in creating the opportunity of this Ph.D. for me. I would like to thank him for his prompt feedback, constant guidance, incredible patience and full support in editing my manuscripts.
I would like to take the opportunity to express my sincere gratitude to all the people whose support contributed to the success of this project. I would like to thank my parents, my family, my friends, and also my primary, secondary, high school and university teachers, professors as well as colleagues in Iran and Canada. Also, I would like to think Lana for her lovely support in Canada.
In addition, I extend my appreciation to my fellow colleagues in the research laboratory, all the post-docs and graduate students, who helped me and shared their experiences and knowledge during my Ph.D. project.
I would like to thank the department of chemistry of University de Montreal for their generous support and for providing all the materials needed to accomplish my Ph.D. project. Also thanks to the professors who evaluated my Ph.D. exam, Dr. Robert Prud'homme, Dr. André Beauchamp, Dr. Sébastien Sauvé, Dr Jean-Francois Masson, Dr. Radu Iftimie, and Dr. Karen Waldron.
I would like to thank Jean-François, Martin, Yves, Louis, Cédric, and also Amira and Sylvie for their generous technical support and for providing the necessary materials during my Ph.D. project.
Finally, I would also like to thank the members of the doctoral committee who examined my Ph.D. thesis, Dr. Michel Lafleur, Dr. Suzanne Giasson and Dr. Reghan Hill.
Chapter 1
Introduction
1.1. Overview
Biofilms are important in the fields of human health1, industrial production2 and the natural environment, among others3. In industrial environments, biofilms are often problematic, resulting in the contamination of food industry products or the biocorrosion of equipment. In the public health field, they can be associated with infectious diseases4-6 or infect the surfaces of medical implants7-10. Furthermore, many household surfaces are the target of biofilms, leading to higher incidences of illnesses associated with pathogenic organisms. In natural environments, biofilms are involved with numerous biogeochemical activities, including the immobilisation of toxic metals11 or the creation of oxygen depletion zones12 in lakes and rivers, potentially leading to toxic algal blooms13.
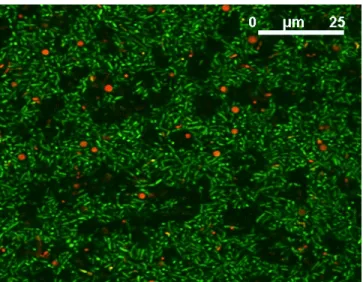
A biofilm is a collection of microorganisms, embedded within a three dimensional matrix of extracellular polymers (EPS)14, 15. The inhomogeneous distribution of cell clusters encapsulated in EPS and the presence of void volumes (water channels) inside the biofilms, have been well documented by confocal laser scanning microscopy (CLSM)16, 17. Indeed, EPS form the backbone of the clusters, water channels and intercluster voids18, 19, all of which contribute to the overall heterogeneous structure of the biofilm. The EPS matrix is often in contact with a surface, where it remains even when cells are removed due to death or shear forces20. Biofilm formation, in general, is a complex biological phenomenon, consisting of a succession of several different steps: reversible then irreversible attachment of biological cells to a surface, formation of microcolonies, coalescence of growing microcolonies to form a macrocolony and cell dispersal. This model21, however, still needs more validation by different experimental techniques. Nonetheless, these observations led to the development of the ‘mushroom-like’ model, which describes the biofilms as a series of mushroom-shaped columns attached to a surface (c.f. Fig. 1.1)22.
Figure 1.1. Confocal laser scanning microscopy (CLSM) image of a P. fluorescens biofilm grown in the presence of 10-5 M Fe(III). Bacterial cells have been stained with the Live/Dead BacLightkit (green-fluorescent SYTO 9 stain / red-fluorescent propidium iodide stain) in order to show viable cells in green and dead cells in red. The sample was excited with the 488 nm line of an Ar ion laser.
Biofilm EPS consists mainly of diverse biomacromolecules including: polysaccharides, peptidoglycans, lipids, polyphenols, proteins, nucleic acids and humic materials. The EPS render the biofilm morphologically diverse, chemically heterogeneous and dynamic. EPS may vary in chemical and physical properties but they mainly consist of polysaccharides. Some of these polysaccharides are neutral and some are polyanionic. Also, uronic acid compounds (D-glucuronic, D-galactouronic and mannuronic) as well as ketal linked pyruvate enhance the anionic properties of EPS. These compounds become important in the presence of ions which can increase the crosslinking between the ionisable functional groups on the polymer backbone. For example, for alginate (and some biofilms), the presence of calcium may serve to strengthen the hydrogel. The hexose residues constitute the backbone of the EPS. Moreover, as the EPS in some biofilms are negatively charged, they can strongly bind water and act as a cation exchanger. The presence of hydrophobic carbon chains can also lead to enhanced local concentrations of organic molecules in the biofilm. Based on the microorganisms and the age of biofilm, the amount of EPS may vary. Furthermore, inside the biofilm, compounds including ions and
macromolecules such as proteins, DNA, lipids and humic substances may also be found. EPS production is, mainly, affected by nutrient status of the growth medium. For example, nitrogen and phosphate limitation can promote the EPS production23.
Mass transport in biofilms has been primarily attributed to molecular diffusion, particularly in the inner part of the biofilm, i.e., in the local zones of EPS far from the surface of the cluster24. The presence of the EPS matrix is thought to increase the resistance of organisms in the biofilm to both environmental stress and antimicrobial agents25-28 when compared to the planktonic forms of the same organisms29. It has been postulated that the increased resistance results from reduced diffusion within the biofilm.30 Indeed, the increased resistance to disinfection31 as well as the increased residence time of a tracer in a bioreactor32 have been attributed to a diffusion limitation. The density, thickness and stickiness of the EPS depend largely on the strain of bacteria and the conditions under which they are grown.
In this thesis, we are interested in quantifying diffusion in a biofilm with respect to both its characteristics and to the nature of the diffusing solutes. Our investigation is designed to help us better understand the diffusion phenomena which are key to understanding biofilm function (both cells and the matrix) with respect to numerous applications. For example, information on diffusion is needed to predict the mobility of the nutrient and metabolic end-products, to determine the activity of biofilms, to characterize antibiotic penetration in biofilms and to better control remediation processes. Nonetheless, given that the biofilm is both chemically and physically heterogeneous, two model polysaccharide hydrogels, prepared from agarose and alginate, were first studied. Although diffusion in biofilms has been investigated by other authors, much of their research has focused on obstruction effects. Little work has been performed on quantifying the role of charge when variably charged solutes interact with the charged EPS in a biofilm. Therefore, in addition to quantifying of the effects due to the sizes of the diffusing solutes, the role of electrostatic interactions between the (mainly) negatively charged EPS and variably charged solutes were examined in more detail. To attain these objectives, a number of modern analytical techniques including the diffusion equilibration cell technique (DET),
microelectrode-based voltammetry and fluorescence correlation spectroscopy have been employed.
1.2. Diffusion
The transport of solutes in the pores of hydrogels and biofilms can be characterized either in terms of Brownian motion (reflected by a self-diffusion coefficient) or by a concentration gradient driven diffusive flux (reflected by a mutual-diffusion coefficient).
1.2.1 Self-diffusion
Self-diffusion (also called intradiffusion33) refers to the diffusion of: (i) a one component system, for example, the diffusion of water in water; (ii) a binary or multicomponent system, such as Na+ in aqueous KCl34. In the latter case, the term tracer diffusion is often used in literature. Indeed, the thermodynamic factor, dlnai/dlnXi, which
appears in equations describing mutual diffusion (where a is the activity and X is the mole fraction of component i, see below), becomes unity for the diffusing species. Brownian forces cause the molecules to undergo some average mean-squared displacement (< r2 >) in dimension (d) over time, t35:
2 s
2
r d D t (1-1)
where Ds is the self-diffusion coefficient. The Stokes-Einstein Equation has been derived from Equation 1-1 with d=2 and Stokes’ law, under the assumption of a solid spherical particle: s H 3 π k T D d
(1-2)where k is Boltzmann constant, T is the temperature, is the viscosity of solution and dH is
particles when the self-diffusion coefficient of the particles and the viscosity of the solution are known.
1.2.2 Mutual diffusion
In contrast, mutual diffusion refers to the relaxation of fluctuations or gradients. The movement of particles between two points in the system occurs in order to attain the equilibrium of chemical potential between two points36. Accordingly, when a substance moves at constant temperature and pressure, the work that is performed can be described with respect to the opposing force, which is considered a thermodynamic force:
i T,P F x (1-3)
where is the chemical potential change in the x direction. The flux of material, J, is i proportional to this force and can be described by:
m i c J D RT x
(1-4)where Dm is the mutual diffusion coefficient, R is the universal gas constant and c is the concentration. Flux is a time independent parameter in this equation. The chemical potential of compound i, μi, is dependent upon the temperature, T, pressure, P, compound
activity, ai, and long range electrostatic interactions37:
0 0 0
i
i
V
i(p p )
RT
ln
a
i
S T T
i(
)
i,el
(1-5)where μi,el accounts for the electrostatic interactions and Si for entropy of component i.
When changes in pressure and temperature are negligible, Equation 1-5 becomes:
0
i
i
RT
ln
a
i
i,el
(1-6)In dilute solutions, the activity can be replaced by the concentration. Combination of equations 1-4 and 1-6 gives:
m
el
c
RT
c
J
D
RT
c
x
x
(1-7)which is Fick’s first law. In Equation 1-7, there are contributions from a concentration gradient and electrostatic charges. If no charges are present, then
el x approaches zero and the equation can be simplified to:m
c
J
D
x
(1-8)In a binary system composed of one type of gel in bulk solution such as the gel-water systems that are studied later in this thesis, the concentration of solute in the gel (ci)
can be related to that in water (caq) by an overall partition coefficient,i38:
i
aq ic
c Φ
(1-9)where i indicates the gel phase (i=1 for one gel in water). Equation 1-9 can be applied to multi-phase systems. For example, for a multi-phase system, consisting of many pieces of different types of gels (each gel considered as a single phase) in one bulk solution, the total concentration of solute in the bulk water will be distributed among the different gel components. Equation 1-9 can be extended to the multi-phase system using Equation 1-10:
i ,total aq i 1 N i
c
c
Φ
(1-10)where ci, total represents the total concentration of the solute which can only be found in gel
phases. As mentioned above, for a binary system (one hydrogel in water),
1 N i i Φ is equal to the overall partition coefficient of the solute in the hydrogel, i.e.,Φ, and it is equal to 1 in the case of no interaction of the solute with the gel. The partition coefficient results from steric (θ), electrostatic ( ) and chemical (α) interactions such that39:
(1-11)where θ, α, and Π are the partition coefficients for purely steric, chemical, and electrostatic interactions, respectively.
A lowering of the ionic strength in the bulk solution can lead to an electrostatic effect (Donnan effect) and deviations from the expected response based upon Equation 1-11. The Donnan effect is due to an electric potential difference of hydrogel with respect to the bulk medium. When the Donnan potential of the gel is significant, especially at lower ionic strengths, the effective diffusion coefficient, De, for a one gel component in water
should be used by taking into account partitioning 39:
m e i
D
D
Φ
(1-12)1.3. Diffusion in hydrogels
Hydrogels are used in a large number of pharmaceutical, biological and environmental applications40-42. The diffusion of solutes into, through and out of gels is often a key to understanding their function. Among key points, it is important to understand how the hindered diffusion of solutes inside the gels is governed by specific and nonspecific interactions.
The rate of steady-state diffusion of solute through a hydrogel depends upon physical (e.g. obstruction43) and chemical (e.g. hydrogen bonding, electrostatic effects39) interactions between the diffusing solutes and the (primarily) carbohydrate matrix of the hydrogel. It will depend upon the physicochemical properties of both the hydrogel and the diffusing molecules, including solute size44 and charge45. Among the additional solute parameters affecting diffusion, it is also necessary to take into account the shape of the solute, its hydrophilic and hydrophobic character, and the hydration of the solute molecules. Moreover, since the charge of the solute is important, the ionic strength and the pH of the bulk solution can also have an important impact on diffusion. With respect to the
hydrogel, its water content (so called volume fraction) and the extent of gel crosslinking46
are the primary factors which control the diffusion and partitioning of solutes. The pore size and the pore size distribution determine the ‘tortuosity’ of the solute displacement in the gel. In addition, hydrodynamic drag –the proximity of solute to the polymer-solvent interface– has an impact on the mobility of the solutes47. Note that for a charged gel, the
“effective proximity” can be modified by the ionic strength of the bulk solution, which affects the thickness of the Debye layer. The latter effect may result in a Donnan exclusion effect, which is especially important at lower ionic strengths. As above, the pH may additionally affect the diffusion by modulating interactions between the solutes and the hydrogel40, 41.
Based upon the above discussion, it is not surprising that mass transport in the hydrogels is influenced by both the pH and ionic strength. For example, it was previously reported that the diffusion of small ions, proteins, and surfactants48, 49 was affected by the ionic strength and pH of the bulk solution50. Furthermore, for highly charged gels such as alginate and polyacrylamide, the Donnan potential difference has been shown to result in a significant partitioning of charged solutes. Nonetheless, the role of the Donnan effect on the diffusion of charged solutes still requires further investigation.
1.4. Donnan potential of a charged hydrogel
A hydrogel such as agarose or alginate can be considered as a membrane with a porous homogeneous matrix. Assuming a uniform distribution of the fixed charges throughout the polymer structure, an electrical potential difference51 is established when the membrane is in equilibrium with a bulk solution. In general, there are two different approaches to model the Donnan effect. The first approach52 considers the electrical difference as a surface potential (Fig. 1.2a). In this model, all the charges are considered to be located at the membrane surface and unable to penetrate into the membrane. This model can be expressed as:
S 1/ 2 r 0 arcsin F 8 RT z c RT (1-13)where is the surface potential, s is the surface charge density of the hydrogel, εr the
relative permittivity of the solution, ε0 the permittivity of a vacuum, z represents the charge
valence of the electrolytes, F is the Faraday constant and c is the concentration of bulk electrolyte.
In the second approach53, the electrical difference is modeled as the Donnan equilibrium potential. This model is mostly used to study mass transport through hydrogels (Fig. 1.2b) and can be expressed as:
g D arcsin F 2 z RT z zc (1-14)
where z represents the charge valence of the electrolytes, zg is the charge valence of the functional groups in the gel, ρ is the charge density of the gel and c is the bulk electrolyte concentration in the medium. The Donnan potential of the hydrogel can be predicted according to Equation 1-1454. The concentration of the charged functional groups of a hydrogel can be measured using an acid-base titration of a piece of hydrogel. The charge density ( ; C/kg) of the hydrogel can be obtained according to Equation 1-15:
F Q
(1-15)
where Q is the concentration of the charged functional groups in the hydrogel54.
Equation 1-14 was later modified based on the assumption of Mauro55, in which a Poisson-Boltzmann distribution was applied, leading to a continuous Donnan potential extending over a distance on the order of 1/κ (κ is the Debye-Hϋckel parameter) on both sides of the sharp interface (Fig. 1.2c). In fact, at the interface between the gel and bulk solution, both the gel segment density and the fixed charge density drop sharply to zero.56
Figure 1.2. Schematic representation of the potential distribution (blue solid line) near the membrane surface (red dotted line) using (a) a surface potential ( ), (b) a discontinuous S Donnan potential ( ), (c) a continuous Donnan potential (D ). D
The Donnan partition coefficient can be estimated according to Equation 1-16 as follows57,58: D 2F RT e
(1-16)where the Donnan partition coefficient, , represents the enhancement of metal ions in the gel that are due to electrostatic effects. The Donnan partition coefficient can be compared to the overall partition coefficient that is obtained by dividing the measured metal concentration that is extracted from an equilibrated hydrogel using nitric acid, [M2+]g,
with that measured in the bulk solution, [M2+]w. Extracted concentrations can be measured
by atomic absorption spectroscopy or inductively coupled plasma mass spectrometry.
1.5. Diffusion models in hydrogels
Mass transport retardation in a gel, due to the blocking of the diffusion path by the gel polymer chains, can be evaluated by a retardation factor:
g
w
D D
(1-17)
A number of models have been developed in order to predict the retardation factor. These models are based upon the solute properties (e.g. hydrodynamic radius), the gel network structure (gel concentration and mesh size59, 60) and solvent properties (e.g. free volume61). The hindered diffusion of solutes has been well documented for agarose59, 62 and alginate43 gels.
Obstruction models consider the gel chains as rigid obstacles that allow the
passage of the diffusing solutes through the openings among the chains. In fact, when the solutes pass through a matrix, they are forced to move around these chains. As a result, the diffusion path tends to be longer than that in free solution, leading to the hindered mobility of solutes. Some models based on the obstruction theory are Maxwell–Fricke’s63, Mackie and Meares’s64, Ogston’s65 and the Hard Sphere Theory66 model. It has been shown that the deviation of theoretical diffusion values from the experimental ones increases as the concentration of the polymer increases43 or when as the solute size67 becomes larger (in which case, hydrodynamic effects are non-negligible).
Hydrodynamic models are based on the Stokes-Einstein relation (Eq. 1-2). In this
case, solutes are considered as spheres that diffuse at a constant velocity in the bulk solution. These models consider a frictional drag close to the polymer chains, which slows down the diffusion of the solutes. Hence, the expression of the magnitude of this effect is the core of the hydrodynamic models. Different models have been developed including Cukier’s68, Altenberger’s69 and Phillies’s70 models in addition to the reptation scaling71 model. Although most of these models can fit experimental data for small size solutes or in dilute solutions, fits often deviated from the theoretical predictions for larger solutes in more concentrated polymer solutions. In addition, the different assumptions used in the models appeared to affect the model fits.
Free volume theory models are based on the random movements of solvent
molecules through void volumes or ‘free volumes’. Solutes are modeled as jumping from void to void. The polymer chains of the hydrogel contribute to the availability of these voids. Accordingly, as the polymer concentration is increased, the concentration of these
voids decreases, leading to more diffusion retardation as compared with that seen in weakly concentrated gel-solvent systems. Also, the mesh size of the polymer network can be determinant in relation to the size of the solutes as solutes can diffuse when their sizes are smaller than the sieves of the polymer network. Fujita’s72, and Peppas and Reinhart’s 73 models have been developed, based on the free volume theory.
1.6. Diffusion in biofilms
In planktonic cultures, the bulk flow of a fluid (convection) rather than the random molecular motion (diffusion) is responsible for the transport of the solutes (except in the immediate vicinity of the cells). In microbial biofilms, diffusion becomes the main mechanism for transport of solutes because biofilms and the substratum to which it is anchored, reduce the fluid flow. This reduction in fluid flow occurs through the locally high cell densities and the presence of EPS in the biofilm. Diffusion is also the predominant transport process within cell aggregates74, 75 and biofilm clusters30, at least for small solutes76. Nonetheless, convection can also be involved in the diffusion process in the voids and water channels of the biofilm77, 78. Solutes in a biofilm are involved in two main events: (i) diffusion into the biofilm; (ii) interaction with the organisms in the biofilm. Generally, nutrient or pollutant species must diffuse through the gel matrix in order to reach the biofilm embedded bacteria, which are often found deep inside the biofilm. Solute transport is hindered79,80 by the presence of bacterial cells, EPS and inorganic materials, which act as obstacles to diffusion (i.e. greater tortuosity), generally leading to the observation of a smaller diffusion coefficient in the biofilm with respect to that in water38. For example, as compared to planktonic cells, the higher resistance of biofilms to heavy metals has been thought to be due to the presence of EPS81. The reduction of the diffusive flux in the biofilm has, in general, been attributed to an exclusion effect due to steric interactions with the EPS82 or to the interaction of solutes with the EPS (binding83 or electrostatic effect84).
A concentration gradient of metabolic substrates and microbial species have been shown to occur during the biofilm formation process85, 86. For example, gradients have been observed for oxygen, nitrite and pH87 using microelectrodes88. Furthermore, the mobility of
solutes (nutrients, oxygen and biocides) have been shown to be significantly hindered by the bacterial clusters, even though these elements diffuse easily in the voids of the biofilms75. Heterogeneous nutrient gradients can lead to the heterogeneous growth of microorganisms into biofilms89 resulting in local microniches90. These local microniches render the biofilm even more complex with diverse coexisting environments. Indeed, the changing microbial community is an adaptive response resulting in a continual reorganization of the EPS matrix91, 92.
In general, the value of the diffusion coefficient in the biofilm will be reduced compared to that in water, due to the presence of microbial cells, extracellular polymers and other materials including the abiotic particles or gas bubbles that are trapped in the biofilm. Generally speaking, diffusion coefficients in the biofilm voids are close to those in the water. Nonetheless, given the presence of soluble EPS in the biofilm voids, increased viscosity may be responsible for a slightly decreased solute mobility93. It would appear that the determining factor for both microbial behaviour (cell-matrix ratio, biofilm thickness) and solute diffusion is more due to the architecture of the biofilm than to its physiological properties. Indeed, it has been shown that the limitations to diffusion in biofilms are primarily caused by the EPS of the biofilm matrix18. Limitations in mass transport are mainly dependent on the biofilm structure (density and porosity of the EPS) rather than, for example, biofilm thickness 94.
Moreover, the compositions of EPS vary in different biofilms, and the free diffusion of solutes is highly dependent upon the biofilm composition. For example, it has been shown that the diffusion of anionic beads larger than 55 nm was hindered in the EPS of S. maltophilia, however in the biofilm of L. lactis, 14 nm anionic beads were slowed18. In addition, different shapes of the fluorescence correlation spectroscopy (FCS) correlation curves in various zones of EPS confirmed the impact of EPS heterogeneity on diffusion84. The compactness of the EPS also increased the diffusion time of the particles, indicating an EPS density effect on the mobility of particles18. Furthermore, the difference in the diffusion of several FITC-dextrans in two different biofilms of S. maltophilia and L. lactis was consistent with the dissimilarity in the spatial architecture of these biofilms. Indeed, the S. maltophilia biofilm had a mushroom-like structure while L. lactis biofilm appeared to be
composed of an assembly of cells embedded in a highly hydrated uniform matrix95. Finally, it recently has been shown that the cell wall properties of genetically engineered hydrophilic and hydrophobic cells of L. lactis had an impact on the diffusion of nanoparticles in biofilms96.
The first mechanism by which the EPS have an impact on the mobility of solutes is via the obstruction effect. Obstruction occurs either by blocking the diffusion path, rendering a longer diffusion path or by the exclusion of solute by the biomass of the biofilm, resulting in a slower diffusion. When using more compact biofilms (larger volume fraction of the biofilm) smaller values were determined for the diffusion coefficients, indicating the role of EPS in hindering the movement of probes in the biofilm38. The impact of the biofilm density on diffusion has been shown for glucose, acetate, phenol, sucrose and lactate. In these cases, the value of Dg/Dw was reduced as a function of the volume fraction
of biofilm38. For fluorescence probes, both the absence of signal and/or quenching of the signal have been observed in biofilm, indicating the impact of EPS on diffusion, due either to exclusion effects or specific interactions97 with the diffusing solutes18. Also, for anionic and cationic beads of various sizes, distortions of FCS correlations in local zones of the EPS indicated the significant impact of particle size on diffusion in the EPS18. A similar effect has been shown for dextrans. In most cases, diffusion values in EPS were smaller than those in water80, 98. Also, when the diffusion of dextrans with a vast range of molar masses were measured by CLSM in the same biofilm, Dg/Dw decreased systematically as a
function of the increasing sizes of the dextrans99. Nonetheless, the difference in diffusion coefficients that were observed for dextran probes with similar sizes strongly suggested that other factors, such as solute charge, were involved in transport of solutes.
Diffusive transport can be hindered by both steric effects and electrostatic interactions with the charged components of the biofilm. As is the case for hydrogels, the polymer matrix of the biofilm consists of variably charged local zones that depend upon the local pH and ionic strength. These local zones can have significant impact on the incoming solutes. For example, a substantial reduction in the relative diffusion coefficients (Dg/Dw)
of the charged ions: NH4+1100, Li+1101, HCO3- and NO3-1102 with respect to non-charged
diffusion of cationic antibiotics103-108, quaternary ammonium compounds82, 83, cationic
amine-modified latex beads18, Zn2+ 81 and silver nanoparticles109 has been attributed to
electrostatic interactions within (negatively charged) biofilms. In addition, the slow diffusion of ceylpyridinium chloride (CPC) into the Streptococcus mutans biofilm appears to be due to charge interactions between ammonium groups of CPC and EPS of the biofilm82. Furthermore, the reduced value of D
g/Dw (0.4) for fluorescein as compared to
that of larger molecules (0.56-0.90) was thought to be due to the electrostatic sorption of the probes to the EPS 98. Large negative Donnan potentials may lead to increased electrostatic interactions of the biofilm with charged solutes110, resulting in higher concentrations of cations in the biofilm as compared to the bulk medium. Numerous functional groups in the biofilm will show a pH dependency over environmentally relevant pH. Conversely, no impact of charge on the diffusion of small charged ions was reported by Siegrist et al.111. In that case, convective mass transport, i.e., the turbulent fluid motions in the upper layers of a flow cell, were thought to predominate.
The diffusion coefficient also depends on the temperature (T) and viscosity (112. Indeed, local variations in the temperature and viscosity can lead to large variations in the diffusion coefficients in various zones of the EPS. These factors and their impact on diffusion have been poorly investigated for biofilms.
Due to the above competing physical, chemical and electrostatic effects in a biofilm, it is no wonder that there are numerous contradictory reports of increased or decreased diffusive fluxes for ions of different charges and biofilms of different natures. Clearly, there is little consensus on the values of diffusion coefficients in biofilms38.
1.7. Techniques for measuring biofilm structure
In order to relate biofilm structure to function, it is necessary to characterize the biofilms. Biofilm development and structure have been analysed using fluorescence microscopy, differential interference contrast (DIC), transmission electron microscopy (TEM), scanning electron microscopy (SEM), atomic force microscopy (AFM) and
confocal laser scanning microscopy (CLSM). Useful information about the surfaces, morphology and arrangement of biofilms have been obtained by transmission electron microscopy (TEM) and scanning electron microscopy (SEM)22. However, the samples need to be dehydrated in order to use these techniques; the risk of the structural misconception arises for the biofilms. In contrast, CLSM can provide researchers with in situ analysis. CLSM gives insights into the structure of biofilm, including cell clusters separated by channels75. Confocal microscopy has also been used in order to measure the diffusion in biofilm based on the imaging of fluorescence markers99. On the other hand, the disadvantage of CLSM is that it requires fluorescence markers in order to stain and visualize the biofilm. In addition, techniques such as particle image velocimetry coupled with CSLM have been used to characterize the biofilm structure, however this technique is only applicable for large size particles (~100 nm)75. The use of specific microelectrodes or ex situ analysis following extraction of polymers has also been reported92, 113. These approaches are invasive and have poor resolution, which renders difficult dynamic observations of biofilms over time.
1.8. Techniques for diffusion measurements
1.8.1 Measuring self-diffusion coefficients
Various techniques such as pulsed-field gradient spin-echo nuclear magnetic resonance (PFG-SE-NMR), fluorescence recovery after photobleaching (FRAP) and fluorescence correlation spectroscopy (FCS), have been used to measure self-diffusion coefficients.
NMR– The technique of PFG-SE-NMR114, 115 has been used as an effective technique to measure diffusion in gels and biofilms. The basic principle of the PFG-SE-NMR technique is the fact that the Larmor frequency of a nucleus is proportional to the local magnetic field116. Two magnetically equivalent nuclei resonate at a different Larmor frequency if the nuclei are located at different positions along the magnetic field gradient. This technique can measure self-diffusion coefficients for all NMR-detectable solutes116.
For biological systems such as biofilms, proton NMR114 is very applicable. However, the water which dominates most biofilms (~ 98%) is mainly measured in the diffusion measurements. The technique is fast, non-destructive, and capable of multicomponent measurements using very small volumes. Furthermore, information about the structure of matrix can be obtained115, 117.
FRAP- An intense but brief laser light is pointed at a spot inside the sample
containing the fluorescent probe118. The recovery of fluorescence in the bleached zone is monitored as a function of time. Diffusion coefficients can be obtained from a two dimensional model describing the recovery profile. FRAP has widely been used in biological systems such as biofilms95, 119 as it is considered a high resolution technique which can provide information about the local structure as well. FRAP is not practical in applications in which very low concentrations (nM) of probe is used. Information about molecules in the diffusion spot is limited given that FRAP measures the Brownian motions of molecules that diffuse from outside the diffusion region29, 95, 120-123.
FCS- This technique has been used in this thesis and its theory is explained in detail
in Chapter 2 (section 2.2).
1.8.2 Measuring mutual diffusion coefficients
Uptake and release from gel beads or slices- In this technique, solutes are first
entrapped in small gel pieces that are placed in a solution that initially contains no solute. Small aliquots of solution are periodically sampled in order to monitor solute concentrations and concentration data, are interpreted with appropriate models in order to obtain the diffusion coefficients124.
Concentration gradient profile techniques- In this technique, concentration
gradients in the matrix are monitored. This monitoring is obtained with (1) destructive methods in which the gel is sliced and the concentration of solute is determined or (2) non-destructive methods in which the concentration profile is scanned over as a function of distance using NMR imaging125, fluorescence126, UV-VIS127, Raman128 or IR techniques.
Concentrations in the matrix are measured and plotted versus time or distance and the appropriate model is used to determine the diffusion coefficients124.
Microelectrode Voltammetry- This technique has been explained in detail in
Chapter 2 (section 2.3). It can be used to measure diffusion in hydrogels and biofilms. It only determines diffusion of the electrosensitive molecules indirectly. It has mainly been used for measuring diffusion in gels.
Diaphragm cell- This technique has been used in this thesis and is explained in
Chapter 2 (section 2.4).
Fluorescence correlation spectroscopy129 (FCS) constitutes a powerful tool for the study of molecular dynamics. In this technique, a small number of molecules in a micro-volume (confocal micro-volume) are excited and the emitted signal is analyzed. FCS is a non-invasive technique which is appropriate to study the biological media130-132. The small concentration of probes and the vast range of probes are the other advantages of this technique. The important events that should be considered in FCS measurements are the photodamage and photobleaching phenomena. These factors can be minimised by modifying the laser intensity and by using a two photon excitation system instead of classical confocal detection133.
In recent years, optical microscopy allowed for the in situ observation of EPS. For example, one can track the mobility of the free molecules over time with time lapse imaging. However, this technique measures the average diffusion coefficients over the macrostructure distance and thus molecular diffusion is hard to evaluate134. Furthermore, fluorescence recovery after photobleaching (FRAP) has been developed in order to study mass transport phenomenon in biofilm matrix29, 95, 98, 99. This technique is limited to very low concentrations of fluorescence probe.
1.8.3 Mutual versus self diffusion coefficients
A major difference between mutual and self-diffusion measurements is related to the different time and length scales for each technique. The time and length scales are generally shorter for self-diffusion than mutual diffusion coefficient measurements. For example, for FRAP and FCS, the diffusion spot volume is on the order of femtoliters and the diffusion time occurs on the scale of ms-s. For NMR, this time is even shorter. In contrast, for mutual diffusion techniques, the times and distances are longer, e.g., hours and millimetres (uptake and release technique) or days and centimetres (concentration gradient technique, Raman spectroscopy135).
1.9. Objectives
The overall objective of this dissertation was to better understand the effects of both particle and matrix charge on the diffusion of solutes and nanoparticles in a biofilm. Given the complexity of biofilms, two polysaccharide hydrogels, agarose and alginate, were first used as the simple models of the biofilm matrix in order to better relate structure to function (i.e. diffusion) in a biofilm. Both the self and mutual diffusion were examined in the hydrogels in order to better understand the contributions of electrostatic, obstruction, hydrodynamic or specific (binding) effects on the diffusion mechanism. Results observed for model gels were used to explain some of the behaviour observed for solute diffusion in the more complex biofilms.
In Chapter 3, the weakly charged agarose hydrogel was studied. Both self and mutual diffusion were characterized (using diffusion cells and fluorescence correlation spectroscopy). Microelectrode voltammetry was used to quantify the Donnan effect. In Chapter 4, self-diffusion coefficients were measured in a highly charged, calcium alginate hydrogel, which was very representative of biofilm EPS. Self-diffusion was measured under several conditions of ionic strength, pH and medium composition using FCS. In addition, the roles of cations on the structure of the hydrogel were carefully quantified. Finally, in Chapter 5, a P. fluorescens biofilm was produced and self-diffusion coefficients
were measured for a number of physicochemical conditions including solute charges and sizes.
1.10. References
1.Beikler, T.; Flemmig, T. F. Oral biofilm-associated diseases: trends and implications for quality of life, systemic health and expenditures. Periodontology 2000 2011, 55, 87-103. 2.Li, X. Z.; Hauer, B.; Rosche, B. Single-species microbial biofilm screening for industrial applications. Applied microbiology and biotechnology 2007, 76, 1255-1262.
3.Lebert, I.; Leroy, S.; Talon, R. Effect of industrial and natural biocides on spoilage, pathogenic and technological strains grown in biofilm. Food microbiology 2007, 24, 281-287.
4.Suzuki, T.; Yamazaki, Y. The biofilm formation in infectious diseases. Rinsho Biseibutshu Jinsoku Shindan Kenkyukai Shi 2005, 16, 165-167.
5.Hamal, P.; Ostransky, J.; Dendis, M.; Horvath, R.; Ruzicka, F.; Buchta, V.; Vejsova, M.; Sauer, P.; Hejnar, P.; Raclavsky, V. A case of endocarditis caused by the yeast Pichia fabianii with biofilm production and developed in vitro resistance to azoles in the course of antifungal treatment. Medical mycology 2008, 46, 601-605.
6.Costerton, J. W. Anaerobic biofilm infections in cystic fibrosis. Molecular cell 2002, 10, 699-700.
7.Steinberg, D.; Blank, O.; Rotstein, I. Influence of dental biofilm on release of mercury from amalgam exposed to carbamide peroxide. Journal of biomedical materials research. Part B, Applied biomaterials 2003, 67, 627-631.
8.Seneviratne, C. J.; Zhang, C. F.; Samaranayake, L. P. Dental plaque biofilm in oral health and disease. Chinese Journal of Dental Research 2011, 14, 87-94.
9.Latorre, A. A.; Van Kessel, J. S.; Karns, J. S.; Zurakowski, M. J.; Pradhan, A. K.; Boor, K. J.; Jayarao, B. M.; Houser, B. A.; Daugherty, C. S.; Schukken, Y. H. Biofilm in milking equipment on a dairy farm as a potential source of bulk tank milk contamination with Listeria monocytogenes. Journal of dairy science 2010, 93, 2792-2802.
10.Juhler, S.; Revsbech, N. P.; Schramm, A.; Herrmann, M.; Ottosen, L. D.; Nielsen, L. P. Distribution and rate of microbial processes in an ammonia-loaded air filter biofilm. Applied and environmental microbiology 2009, 75, 3705-3713.