HAL Id: hal-01769061
https://hal-mines-albi.archives-ouvertes.fr/hal-01769061
Submitted on 17 Apr 2018
HAL is a multi-disciplinary open access
archive for the deposit and dissemination of
sci-entific research documents, whether they are
pub-lished or not. The documents may come from
teaching and research institutions in France or
abroad, or from public or private research centers.
L’archive ouverte pluridisciplinaire HAL, est
destinée au dépôt et à la diffusion de documents
scientifiques de niveau recherche, publiés ou non,
émanant des établissements d’enseignement et de
recherche français ou étrangers, des laboratoires
publics ou privés.
Hydrothermal carbonization of off-specification compost:
A byproduct of the organic municipal solid waste
treatment
Daniele Basso, Elsa Weiss-Hortala, Francesco Patuzzi, Daniele Castello,
Marco Baratieri, Luca Fiori
To cite this version:
Daniele Basso, Elsa Weiss-Hortala, Francesco Patuzzi, Daniele Castello, Marco Baratieri, et
al..
Hydrothermal carbonization of off-specification compost: A byproduct of the organic
mu-nicipal solid waste treatment.
Bioresource Technology, Elsevier, 2015, 182, pp.217 - 224.
Hydrothermal carbonization of off-specification compost: A byproduct
of the organic municipal solid waste treatment
Daniele Basso
a, Elsa Weiss-Hortala
b, Francesco Patuzzi
c, Daniele Castello
a, Marco Baratieri
c,
Luca Fiori
a,⇑aDICAM, Department of Civil, Environmental and Mechanical Engineering, University of Trento – via Mesiano 77, 38123 Trento, Italy bUniversité de Toulouse, Mines Albi, CNRS, Centre RAPSODEE, Campus Jarlard, F-81013 Albi Cedex 09, France
cFaculty of Science and Technology, Free University of Bolzano – Piazza Università 5, 39100 Bolzano, Italy
h i g h l i g h t s
!HTC of off-specification compost at 180, 220, 250!C and 1, 3, 8 h reaction time RT. !The increase in hydrochar HHV with respect to raw feedstock from 7% to 61%. !Hydrochar elemental composition similar to that of peat and lignite for T = 250!C. !Hydrochar thermal stability greatly increased at T = 250!C and at T = 220 !C when RT = 8 h. !HTC results were highly dependent on T, while the effect of RT was much lower.
Keywords:
Hydrothermal carbonization Hydrochar
Organic waste Municipal solid waste Biofuel
a b s t r a c t
The possibility to apply the hydrothermal carbonization (HTC) process to off-specification compost (EWC 19.05.03) at present landfilled was investigated in this work. The aim was to produce a carbonaceous solid fuel for energy valorization, with the perspective of using HTC as a complementary technology to common organic waste treatments. Thus, samples of EWC 19.05.03 produced by a composting plant were processed through HTC in a batch reactor. Analytical activities allowed to characterize the HTC products and their yields. The hydrochar was characterized in terms of heating value, thermal stability and C, H, O, N, S and ash content. The liquid phase was characterized in terms of total organic carbon and mineral content. The composition of the gas phase was measured. Results show that the produced hydrochar has a great potentiality for use as solid fuel.
1. Introduction
Nowadays, the need for clean and renewable energy is a strong and relevant issue worldwide. The shortage of fossil resources and the concern for the state of the environment have boosted the attention towards the development of new energy sources, which could reduce or even substitute fossil ones. Among them, biomass, both virgin and residual, is one of the most suitable candidates. Indeed, when handled in a proper way, biomass is fully renewable and, at the same time, it is able to reduce net carbon emissions. The strong interest by both policy makers and the majority of the pop-ulation is a strong driving force for the investigation of new and affordable technologies.
Hydrothermal carbonization (HTC) has the potentialities to meet these requirements. HTC is a thermochemical conversion process, consisting in reacting wet organic substrates (i.e. with a moisture content even higher than 80 wt.%) at hydrothermal con-ditions, that is in hot pressurized liquid water. Process conditions are quite mild: temperatures range between 180!C and 250 !C and pressures are those required to maintain water at liquid state (10–40 bar). Typical residence times range between a few to sev-eral hours. Hot pressurized water exhibits a higher ion product than at ambient conditions, behaving as an acid/base catalyst pre-cursor and acting as both a solvent and a reactant (Kruse and Dinjus, 2007). Such peculiar properties result in a very reactive behavior, which is able to promote the transformation of the organic matter and its enrichment in carbon. The main product of the process is called hydrochar, a carbonaceous solid with a car-bon content usually higher than 80 wt.%. Its chemical composition ⇑ Corresponding author. Tel.: +39 0461 282692.
is very similar to low rank coals, such as peat or lignite (Schuhmacher et al., 1969). The interest on hydrochar is motivated by the wide range of potential applications it could have: as a solid fuel (Lu et al., 2011; Hwang et al., 2012; Román et al., 2012; Castello et al., 2014), as a soil improver (Berge et al., 2011), as a sor-bent (Demir-Cakan et al., 2009), as a highly functionalized carbon material (Titirici and Antonietti, 2010), or as an activated carbon precursor (Unur, 2013). Up to now, HTC process has been widely studied by many authors (Funke and Ziegler, 2010; Libra et al., 2011; Stemann et al., 2013).
The typical process parameters, such as the temperatures and the pressures involved, and the type of products obtained make HTC interesting for several industrial applications. With respect to other thermochemical processes, such as supercritical water gasification (Fiori et al., 2012), a HTC plant would require much reduced investment and operating costs, as well as easier solutions to face safety issues. Moreover, if compared to common organic waste treatments (e.g. composting or anaerobic digestion), HTC involves much lower residence times, which would result into reduced volumes of the equipment. HTC is also capable of manag-ing possible variations of the chemical and physical characteristics of the input feedstock, which would be detrimental for biochemical processes. This is a crucial aspect when dealing with waste mate-rials, which usually present a high grade of heterogeneity. There-fore, to date, many authors have studied the possibility to exploit hydrothermal carbonization for organic waste management and treatment (Berge et al., 2011; Hwang et al., 2012; Liu and Balasubramanian, 2012; Lu et al., 2012).
Nevertheless, in all these works the substrate was treated ‘‘as it is’’. HTC has thus been regarded as a possible substitute for the state-of-art biochemical technologies for organic waste treatment. In the present study, a completely novel approach was followed. Indeed, HTC was not investigated as a stand-alone process, but as a complementary treatment for the organic fraction of municipal solid waste (OFMSW), capable to enhance the whole efficiency of the waste management and treatment chain. In the region where the research group operates (i.e. North-Eastern Italy), at present the disposal of the OFMSW is accomplished through composting. However, not all the materials produced from the composting pro-cess are eligible to be used as fertilizers. Indeed, the regulations state that the bio-stabilized organic matter can be accepted as agri-cultural compost only if its size is lower than 10 mm. The fraction that does not meet such requirement is named ‘‘off-specification compost’’ (hereinafter referred to as OSC) and it is coded by the European Waste Catalogue (EWC) as EWC 19.05.03. This material is currently discarded and landfilled, with further costs. The amounts are non negligible, as they represent around 3% of an OFMSW composting plant throughput.
This work focuses on the application of HTC to OSC. Such pro-cess could be highly beneficial, since it allows obtaining both a reduction of the amounts of waste sent to landfills and the produc-tion of a valuable energy carrier. Addiproduc-tionally, an integrated HTC/ composting process is potentially more advantageous with respect to a fully HTC-based process. As a matter of fact, it would be pref-erable to obtain compost for agricultural use, while choosing a mere energy valorization only for that fraction of composted mate-rial which is not able to meet law prescriptions to be considered as a fertilizer. Therefore, the envisaged integrated process would maximize the benefits of both technologies and it could potentially lower the overall cost for waste disposal.
In the present study, batch HTC tests involving OSC were carried out at different temperatures and residence times. Gaseous, liquid and solid products were collected and fully characterized. Consid-erations about the utilization of the produced hydrochar as a solid fuel were traced.
2. Methods
The experimental activities performed in this work involved the utilization of OSC, a feedstock coming from OFMSW composting, which was utilized to feed a bench-scale HTC batch reactor. In the present sections, details about the feedstock, the apparatus and the experimental and analytical procedures are provided. 2.1. Feedstock characteristics
The feedstock was provided by the company Contarina S.p.A., which operates a composting plant in North-Eastern Italy. Here, the organic waste undergoes bio-oxidation and post-maturation processes at aerobic conditions. Afterwards, the bio-stabilized material is sieved and the fraction with a particle size larger than 10 mm is discarded, being it not compliant with law specifications. Such fraction is defined as ‘‘off-specification compost’’ (EWC 19.05.03), OSC for brevity. As regards the composition, the feed-stock is mainly composed by ligno-cellulosic materials and stabi-lized organic materials.
Due to its high heterogeneity, OSC was milled by a grinder (Sun-beam Osterizer blender) to homogenize the samples as much as possible, before the HTC process. Subsequently, several 10 g sam-ples were collected and stored in a freezer at "24 !C until use. The substrate was fully characterized: seeTable 2in Section3.4.
The moisture content of the raw substrate was experimentally measured by drying 5 samples of substrate at 105!C in an oven for 8 h. The difference between the initial weight of the samples and their weight after drying allowed the determination of the moisture content (30.3% ± 0.1). Details about the other analytical procedures utilized for feedstock characterization are reported in Section2.3.
2.2. HTC apparatus and experimental procedure
A HTC experimental apparatus was designed and constructed. It consisted of a stainless steel (AISI 316) batch reactor with an inter-nal volume of about 50 mL. The reactor was designed for a
maxi-mum temperature and pressure of 300!C and 140 bar,
respectively.Fig. 1a shows the piping and instrumentation diagram (P&Id) of the experimental system.
Two piping lines (internal diameter: 2 mm) were connected to the reactor. Referring toFig. 1a, the left pipe ended with a needle valve (named V1). Along this pipe, a pressure transmitter (PT) and a pressure gauge (PI) were placed. Between the main pipe and the PI, a rupture disc (rupture pressure = 120 bar) was placed for safety reasons. One end of this pipe was connected to a rubber hose, through which an inert gas (N2) was fluxed to purge the reac-tor from the presence of air, before the beginning of each HTC test. To prevent the contact between hot fluids from the reactor and the PT or the PI, the pipe was forced to pass through a water bath. The right pipe was intended to evacuate the gaseous products formed during the carbonization, once the experimental run was termi-nated. Another needle valve (V2) guaranteed the closure of the reactor, while performing the HTC run. The right pipe was also con-nected to the apparatus used for both the measurement of the gas volume and the GC analyses. Finally, a double thermocouple (TT) was embedded inside the reactor, passing through the reactor flanged cover. The thermocouple was positioned to detect the tem-perature near the center of the inner volume of the reactor. Both the thermocouple and the pressure transmitter sent data to the HTC control panel, which supplied temperature and pressure data to a temperature recorder (TR) and to a pressure recorder (PR), respectively. The HTC temperature indicator and controller (TIC) was connected to a band heater, in order to heat the reactor and
to hold its temperature at the desired set point. Reactor sealing was realized through a copper gasket, housed between the reactor top flange and the flanged cover.
The temperature trend which was recorded during the experi-mental runs is shown inFig. 1b. It can be observed that the appa-ratus took about 20–25 min to reach the set temperature. Additionally, it took 15–20 min to cool down from set temperature to room temperature, once the experimental run was stopped. Thus, hereinafter, the parameter ‘‘residence time’’ (RT) will refer to the time between these two transients, i.e. from the instant at which the set-point temperature was reached for the first time to the moment the cooling down began, as it is highlighted in
Fig. 1b. It can be also noticed that a slight peak of temperature occurred just after the set-point was reached. This can be explained with the time delay due to heat transfer between the temperature measured by the thermocouple and the thermal input of the band heater, which caused a slight local inaccuracy in tem-perature control.
Experimental runs were conducted at three different residence times (1, 3 and 8 h) and three different temperatures (180, 220 and 250!C). Each run was repeated at least twice, to ensure reproduc-ibility. In each test, the reactor was loaded with 3 g of OSC (as received) and 30 g of deionized water, in order to obtain a biomass to water ratio (B/W) of 0.1 (B/W was equal to about 0.07 when con-sidering the amount of OSC on a dry basis). The reactor was then closed by means of the flanged cover, nuts and bolts, paying partic-ular attention to maintain the copper gasket in an effective posi-tion, to guarantee perfect sealing. To purge the reactor from the air, N2 was fluxed into the system through valve V1 for about
5 min, sometimes pressurizing it by closing valve V2. Valves V1 and V2 were then closed and the system was heated up by means of the band heater (seeFig. 1b). After the desired residence time, the band heater was turned off and the reactor was quenched through a massive stainless steel disc at "24 !C, which was posi-tioned at the bottom of the reactor. Quenching was helped by blowing compressed air over the reactor walls. The quenching was stopped when TIC indicated 30!C.
To measure the amount of gas formed during the HTC process, a plastic graduated cylinder with the lower part submerged into water was used (Fig. 1a). Before the measurement, vacuum was created inside the cylinder by means of a pump, raising the water meniscus up to the zero of the graduated scale. The zero is posi-tioned on the upper part of the cylinder and the graduated scale (in cm) is facing downwards. Thus, after the reactor quenching, valves V2 and V3 were opened and the gas flowed inside the cylin-der, causing the water level to decrease. The difference between the initial and the final position of the meniscus allowed the calcu-lation of the volume of gas produced during the experimental run. Once the gas was measured, the reactor was opened and weighed. The liquid phase was separated by filtration, using 45
l
m paper filters. The liquid was collected in vials for further analyses, and stored in a refrigerator at 4!C. The vials were closed trying to avoid as much as possible the presence of air inside them. Parafilm was used to better seal them. After the removal of the liquid from the reactor, most of the solid remained inside the reac-tor. The reactor with the wet solid inside and the wet paper filter were then placed in an oven at 105!C for at least 8 h for drying. The mass of solid produced after the process was calculated bydif-Fig. 1. (a) P&Id of the HTC apparatus and gas sampling system; (b) typical trends of the temperature during experimental runs performed at 180, 220 and 250!C: closed circles indicate the moment from which residence time starts to be computed, open circles correspond to the end of the computed residence time.
ference between the weight of the reactor after drying and the tare of the reactor, previously measured. Small amounts of solid were also detected on the paper filter after the drying process. Thus, by weighing the dried filter and subtracting its tare, it was possible to determine the amount of these residues, which was added to the weight of solids previously measured.
2.3. Analytic procedure
With the experimental apparatus reported inFig. 1a, it was not possible to measure both the volume of the gas and its composition for the same experimental run. Therefore, the determination of the gas composition was performed in separate tests. To this purpose, once the reactor was quenched, the produced gas was made to flow along another pipe through valve V4, after having rinsed this pipe with N2. Gas analysis was performed by means of a portable gas chromatograph (3000 micro-GC, SRA Instruments"), equipped with two columns: a Molsieve"column able to detect He, H
2, O2, N2, CH4
and CO and a Plot-U"column able to detect CO
2, C2H4, C2H6and
C3H6/C3H8(C3’s).
The liquid phase was characterized in terms of total organic car-bon (TOC) concentration. The total carcar-bon (TC) and the total inor-ganic carbon (TIC) were measured in a TOC-Analyzer (Shimadzu, TOC V-CSH). The TOC was deduced by subtracting the TIC value from the TC value. TC concentration (mg of C L"1) was obtained by combustion in synthetic air of the solution at 720!C on a plat-inum fixed bed catalyst. The CO2released from organics combus-tion and carbonate volatilizacombus-tion was then measured by Fourier transform infrared (FTIR) spectroscopy. A second analysis con-sisted in the acidification by phosphoric acid coupled with outgas-sing to remove carbonates as CO2: in this way the TIC value was measured.
The mineral content in the liquid phase was measured using inductively couple plasma optical emission spectroscopy (ICP-OES, ICP JOBIN YVON-ULTIMA 2).
The solid phase was firstly characterized in terms of C, H, N, and S mass fractions (Thermo NA 2100). The ash content was deter-mined by incineration at 550!C according to EN 14775 procedure. The O content was then deduced by difference. The high heating value (HHV) of the hydrochars was measured using a calorimetric bomb (IKA 5005). Moreover, a thermo-gravimetric analysis (TGA) of the solids was carried out in a LabSys Evo (Setaram): about 20 mg of sample was heated from 25 to 800!C in a nitrogen atmo-sphere at 5!C min"1. Finally, hydrochars were observed using a digital microscope (VHX-1000, Keyence) using a high-performance zoom lens (20–200X, VH-Z20W).
3. Results and discussion
In this section, the results obtained from the HTC experimental runs are presented. The results include the mass balance and the
characterization of the liquid, gaseous and solid products from the process.
3.1. Mass balance
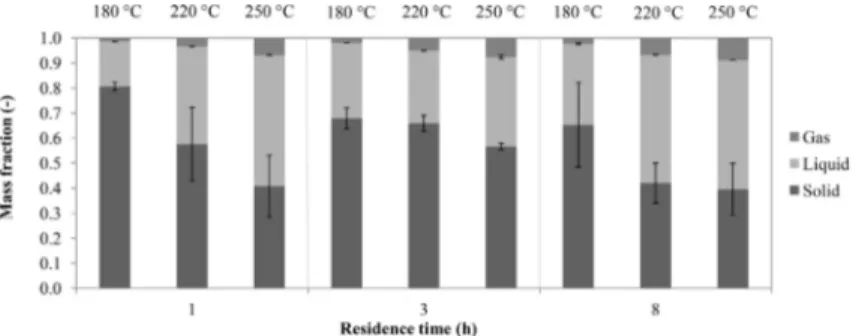
Fig. 2shows the total mass balance obtained following the mea-surement procedure described in Section2.2. The solid yield was determined in terms of amount of solid recovered with respect to the amount of dry substrate initially loaded into the reactor
(ghydrochar/gdry feedstock). The gas yield (ggas/gdry feedstock) was
calcu-lated considering the volume of gas directly measured and the gas average molar mass computed considering the gas composition (Section3.3). The amount of raw biomass degraded and transferred into the liquid phase was determined by difference. Thus, the error bars ofFig. 2refer to the solid and gas phases only.
As reported in other works (Funke and Ziegler, 2011; Gajic´ et al., 2012; Liu and Balasubramanian, 2012), temperature greatly influ-ences the yield of solids. As obtained from the micro-GC analyses (Section3.3), at higher temperatures decarboxylation and decarb-onylation reactions are more pronounced, bringing to higher CO2 and CO production, while lowering the hydrochar yields. Moreover, an enhancement of the temperature promotes the dissolution of carbonaceous products into the aqueous phase (Section3.2), fur-ther decreasing the solid yields. As it was also found by Lu and Berge (2014), at higher temperatures larger fractions of carbon are measured within the liquid and more gases are produced. Con-versely, the influence of the residence time on the hydrochar yield seems to be less important (Fig. 2), in agreement with previous results (Dinjus et al., 2011; Heilmann et al., 2011; Erlach et al., 2012; Müller and Vogel, 2012). This could be a clue that most reac-tions involved in HTC take place in the first hours of residence time. Similar results concerning product distribution within the three phases were obtained by several authors (Goto et al., 2004; Sevilla and Fuertes, 2009; Berge et al., 2011; Hwang et al., 2012). It is worth noticing that solid yield values were affected by a remarkable scattering, due to the heterogeneous nature of the OSC. Gas yield scattering was much lower than solid yield scatter-ing, and almost negligible.
3.2. Liquid products
Table 1 reports the TOC of the liquid phase obtained down-stream the HTC process. TOC values are in the range 7–13 g L"1 corresponding to 27–48% of the initial carbon present in the solid feedstock. Such TOC values are comparable to the values obtained byGao et al. (2011)when processing at 300!C for 30 min different real biomass and biomass model compounds: the authors mea-sured TOC values in the range 4–4.7 g L"1(about half of the values measured here) when working with a biomass to water ratio of 0.05 (about half of the value used here).
TOC is strongly dependent on the temperature: operating at higher temperature results in a higher value of TOC. Indeed, the temperature enhances the decomposition of the biomass into the liquid phase, which is consequently richer in organic compounds. As far as residence time is concerned, the TOC shows a slight increase from 1 h to 3 h of residence time, while being almost sta-ble (or even decreasing) for longer residence times. However, this trend is not very evident and the residence time seems to play a quite marginal role. TOC data testify that the organic matter passes from the solid to the liquid phase in the initial stage of the HTC process: the TOC concentration does not change to an appreciable extent in the range of reaction times studied.
It is worth noticing that the data show a very good reproducibil-ity, which is witnessed by the small values of the standard devia-tion (SD). For all the data but one, the relative standard deviadevia-tion (RSD) ranges between 0.7% and 4.1%. The only exception is repre-sented by the run at 3 h and 250!C, whose RSD is equal to 17.5%. Besides the organic compounds dissolved in the liquid, it is important to analyze the presence of ions in the aqueous phase. Such piece of information was obtained by means of ICP analyses. Also these results are shown inTable 1. The total minerals concen-tration in the liquid phase was calculated from the large spectra of elements quantified. The main significant concentrations where those of K, Ca, Si, Mg, S and Fe, also reported inTable 1. The fifth column ofTable 1evidences the percentages of minerals coming from the raw feedstock and dissolved in the liquid phase: these values were obtained accounting for the mass of solid utilized in the experimental runs and its ash content (Table 2). From 12% to 17% of the initial ash content was recovered in the liquid phase. This percentage increases with temperature and, to a lower extent, reaction time. This behavior resembles that of TOC. Although water at these HTC conditions is a suitable solvent for minerals, their transfer from the solid seems quite limited. In general, it is not pos-sible to appreciate a trend about the release of K, Ca, Si, Mg, S and Fe with respect to the process conditions. The only exception is represented by phosphorous, whose concentration tends to decrease with both residence time and temperature (data not shown).
3.3. Gaseous products
It is possible to have an indirect measure of gas production dur-ing HTC by observdur-ing the trend of pressure inside the reactor as a function of residence time. Such result was reported inFig. 3a.
During the heating up, pressure steadily increases. Once the set temperature has been reached, each curve presents a peak of pres-sure (corresponding to the peak of temperature shown inFig. 1b) which drops when the temperature stabilizes. During the whole initial temperature transient, the system pressure coincides with the vapor pressure of water at the variable temperature. As the time goes on, although the temperature is constant, pressure increases due to gas formation: gases are formed throughout the whole duration of the process. The rate of gas production appears to be higher in the first hours of reaction, while it generally tends to stabilize for longer residence times. The trends ofFig. 3a testify the very good reproducibility of the gas pressure results, which reflect in the very good reproducibility of the gas yields, as pointed out in Section3.1.
As far as gas composition is concerned, the results from GC analyses showed that, for all the samples analyzed, more than 90 vol.% of the gas was composed by CO2, followed by CO, which amounts at 3–8 vol.%. As a whole, more than 98 vol.% of the pro-duced gas was composed by CO2and CO, the remaining part being represented by H2 and CH4. Traces of light hydrocarbons were detected in the gas formed at the most severe process conditions. This is in agreement withLu et al. (2012, 2013), who reported that other permanent gases like ethylene, ethane, propene and butane are produced in small to negligible amounts.
Fig. 3b shows the specific gas yields per unit dry feedstock as a function of the process conditions. Since the other gaseous prod-ucts are yielded only in negligible amounts, only CO2and CO were included in the graph. The production of gases increases with both temperature and residence time. The large amounts of CO2 pro-duced allow concluding that decarboxylation is the main reaction involved in the production of gaseous products. However, at high temperatures or at long residence times, CO starts being produced in not negligible amount. This could be caused by the occurrence of
Table 1
TOC and mineral content in the aqueous phase from HTC at different operating conditions. Residence time (h) Temperature (!C) TOC ± SD (g L"1)
Total minerals in liquid (mg L"1)
% of minerals from initial ash
Concentration in liquid phase (mg L"1)
K Ca Si Mg S Fe 1 180 7.0 ± 0.2 1556.2 12.0 1096.0 221.5 112.1 80.3 31.1 6.6 1 220 8.8 ± 0.2 1641.25 12.7 1059.7 348.0 100.6 84.4 33.3 9.1 1 250 12.2 ± 0.2 2027.15 15.7 1236.9 570.3 110.6 71.5 29.1 3.2 3 180 7.5 ± 0.1 1644.4 12.7 1162.8 257.1 90.7 87.2 34.2 7.2 3 220 10.5 ± 0.4 1929.35 14.9 1231.5 443.5 106.0 104.1 34.7 5.4 3 250 12.7 ± 2.2 2066.75 16.0 1433.8 308.0 155.2 133.7 22.3 10.5 8 180 7.3 ± 0.1 1643.7 12.7 1093.9 335.6 86.2 90.0 26.0 9.2 8 220 11.2 ± 0.3 1911.5 14.8 1198.1 468.9 117.5 94.0 24.8 5.0 8 250 12.0 ± 0.2 2239.1 17.3 1253.7 827.9 102.4 35.7 16.2 0.8 Table 2
Elemental analysis: values in wt.%. OSC data are reported on dry basis.
Residence time (h) Temperature (!C) C H O N S Ash EY ED 1 180 44.08 5.40 36.03 1.26 0.07 13.17 0.60 1.07 1 220 45.01 4.76 35.41 1.81 0.00 13.00 0.52 1.31 1 250 49.32 4.58 23.72 2.51 0.04 19.84 0.41 1.45 3 180 44.01 5.44 36.11 1.56 0.00 12.88 0.59 1.26 3 220 48.72 4.95 25.05 2.05 0.00 19.24 0.67 1.47 3 250 52.58 4.38 19.74 2.02 0.00 21.28 0.59 1.50 8 180 45.02 4.92 33.49 1.60 0.00 14.97 0.60 1.33 8 220 52.53 4.87 19.31 2.70 0.00 20.60 0.43 1.46 8 250 53.84 5.10 12.91 2.46 0.00 25.69 0.44 1.62 OSC 37.72 4.80 36.13 2.79 0.00 18.56 – –
decarbonylation, through which the organic compounds with a carbonyl group (i.e. aldehydes and ketones) loose oxygen by releas-ing a molecule of CO.
3.4. Solid products
Fig. 4shows the higher heating value (HHV) of the produced hydrochar as a function of the hydrochar yield. The point having a yield equal to one actually refers to the HHV of the raw substrate (OSC).
There is a net increase of the HHV of hydrochar if compared to that of the raw substrate. The effect is more evident in correspon-dence of low solid yields. As the solid yields reduce, the HHV of hydrochar increases. Similar trends have been reported previously in the literature (Dinjus et al., 2011; Heilmann et al., 2011; Mumme et al., 2011). This is a consequence of the carbon enrich-ment which takes place during HTC. The enrichenrich-ment in carbon is due to the migration of oxygen and hydrogen, originally included in the solid matter, into the liquid and gaseous phases. As a result, when hydrochar has a high carbon concentration, which also implies a high HHV, solid yields are necessarily lower. From the points inFig. 4, it is possible to obtain a linear correlation between the hydrochar yield and its HHV:
HHV ¼ 22:37 " 10:64Y ð1Þ
where Y is the solid yield (i.e. hydrochar yield). The regression is quite satisfactory, with a mean relative error of 5.2%.
Some conclusions can be stated as far as the dependence on the operating conditions is taken into account. For the tests at 180!C, the points are arranged on a straight line, in order of residence time. As the residence time increases, solid yields are lower and HHV is higher. Such strong correlation could not be observed at the other temperatures. However, it can be generally concluded that an enhancement of the severity of the process in terms of both residence time and temperature implies a stronger energy densifi-cation of the final solid substrate. Similarly to the results byPala et al. (2014), the HHV of the hydrochar produced here is compara-ble to that of peat and lignite. The HHV increase with respect to raw feedstock ranges from 7% to 61%.
It is now interesting to analyze the produced hydrochar in terms of elemental composition:Table 2.Table 2reports also the values of energy densification (ED), defined by Eq.(2), and energy yields (EY), defined by Eq.(3):
ED ¼HHVHHVhydrochar
OSC ð2Þ
EY ¼HHVhydrochar& masshydrochar
HHVOSC& massOSC as received ð3Þ
The HHV of the hydrochar and hence ED increase with the increase in the severity of the process, i.e. for higher temperatures and higher residence times: the data fully respect this (Table 2). Conversely, EY decreases with the increase in the severity of the process: the trend is clear even if in this case the data are more scattered, due to the scatter affecting hydrochar yield (Fig. 2).
In Fig. 5the experimental data from ultimate analysis were arranged in a van Krevelen’s diagram. Such analysis allows under-standing the evolution of the solid composition. HTC acts as a pro-cess for concentrating the carbon content of biomass. As a consequence, both H/C and O/C atomic ratios are expected to decrease due to the treatment. The results confirm such trend. Notably, the raw feedstock presents a very high O/C atomic ratio, due to the fact that it previously underwent a long oxidation pro-cess like composting. For many experimental points the reduction of the O/C ratio does not appear to be very high. As a consequence, despite the HTC treatment, many samples may be still classified as ‘‘biomass’’, without significant carbonization effects. This is partic-ularly true for the mildest process conditions, that is for all the points obtained at 180!C and for those obtained at 220 !C with a residence time up to 3 h.
On the contrary, harsher process conditions allow obtaining a significant increase of hydrochar quality, with the experimental points falling in the regions of peat and lignite.
These observations are in accordance with TGA results.Table 3
summarizes mass losses andFig. 6reports the derivative mass loss (DTG) relevant to OSC and the hydrochars obtained at the four limit conditions (RT = 1 h, T = 180!C; RT = 8 h, T = 180 !C; RT = 1 h, T = 250!C; RT = 8 h, T = 250 !C).
Table 3shows that the mass loss between 150 and 800!C is quite similar for the OSC and the hydrochars obtained at 180!C. Conversely, the mass loss relevant to hydrochars obtained at higher HTC temperatures is lower. The data show a univocal trend, but significant scatter occurs.
The DTG depicted inFig. 6shows that a large part of the solid constituents is degraded between 200 and 400!C. The peaks of the DTG are centered on about 330!C. A slight shift of the peak
Fig. 4. Hydrochar HHV vs. hydrochar yield.
Fig. 5. van Krevelen’s diagram.
Table 3
TGA experimental results: mass losses. Residence time (h) Temperature (!C) Total mass loss (%) Mass loss up to 150!C (%) Mass loss 150–800!C (%) 1 180 "60.97 "4.14 "56.83 1 220 "54.90 "3.20 "51.70 1 250 "53.83 "1.88 "51.95 3 180 NAa NAa NAa 3 220 "56.67 "2.80 "53.87 3 250 "47.64 "0.87 "46.77 8 180 "64.47 "3.34 "61.13 8 220 "48.18 "2.47 "45.71 8 250 "47.99 "0.47 "47.52 OSC "62.08 "6.85 "55.23
aNA, not available.
from 313!C (OSC) to 348 !C (RT = 1 h, T = 180 !C) and 327 !C (RT = 8 h, T = 180!C) indicates that the organics were only slightly modified during HTC occurring at 180!C. The hydrochars obtained at a higher HTC temperature (250!C) show a greater thermal sta-bility: the compounds degraded between 200 and 400!C are sig-nificantly reduced as the DTG is less intense and the peaks are shifted to higher temperatures (Fig. 6). A new peak appears cen-tered on 468!C for the hydrochar obtained at RT = 1 h and T= 250!C. This indicates that new compounds were formed during HTC performed at 250!C even at a short residence time. Increasing the HTC residence time makes these new compounds more stable, as indicated by the new peak at about 600!C relevant to the hydro-char obtained at RT = 8 h and T = 250!C.
As a whole, the higher was the severity of the HTC treatment, the higher the thermal stability of the hydrochar produced. In par-ticular, the thermal stability of the hydrochar (and thus its organic composition) was far from that of the raw feedstock (OSC) for RT = 8 h and T = 220!C and for T = 250 !C whatever was the resi-dence time, which is totally in agreement withFig. 5.
As far as appearance of the solid substrates is concerned (visual observation by digital microscope), OSC exhibit numerous fibers that wrap wood pieces, which confirms its heterogeneous nature. The width of the fibers was statistically determined at about 20
l
m. By increasing the severity of the process, at first fibers reduced in length, then completely disappeared (RT = 3 h and T= 220!C). The microscopic observations also reveal a significant transformation of the wood pieces: as long as the carbonization process proceeded, they moved from their natural brown color, to a darker color, till they became completely black. During such carbonization path, the statistical size of wood pieces reduced and bright spots started to appear on the hydrochar surface, prob-ably due to the presence of minerals at the surface.Thus, increasing the severity of the HTC process on the one hand reduces EY (Table 2), on the other hand allows obtaining a product, hydrochar, whose thermal and chemical characteristics make it suitable for utilization as a fuel, differently from the original OSC. The hydrochar produced at such severe conditions could be thus potentially utilized as a solid fuel in common coal burners. It is worth noticing that, when operating at 250!C, a solid comparable to peat can be obtained after only 1 h of treatment. This opens interesting perspectives for the energy valorization of off-specifica-tion compost, with possible economic benefits for the whole cycle of organic municipal waste. Future work should analyze the eco-nomic feasibility of such process, by taking into account the capital and operating costs and the optimal configuration of the plants. 4. Conclusions
In this work the HTC of OSC (EWC 19.05.03) was performed at several process conditions. Solid, liquid and gaseous products were collected and fully characterized. The results confirm that the hydrochar produced is suitable for energy purposes, as a HHV as high as 19 MJ/kg can be achieved. Moreover, its elemental compo-sition is similar to that of peat and lignite, thus the hydrochar could be used in co-combustion with other fossil coals. HTC thus opens new and interesting perspectives for the energy valorization of OSC, whose disposal is currently a challenging issue.
Acknowledgements
The authors want to acknowledge Contarina S.p.A. ( www.cont-arina.it) for financial support and for having provided the substrate EWC 19.05.03 analyzed in this paper. The authors want also to thank Celine Boachon and Jean-Marie Sabathier for their support in some solid characterizations.
Appendix A. Supplementary data
Supplementary data associated with this article can be found, in the online version, athttp://dx.doi.org/10.1016/j.biortech.2015.01. 118.
References
Berge, N.D., Ro, K.S., Mao, J., Flora, J.R.V., Chappell, M.A., Bae, S., 2011. Hydrothermal carbonization of municipal waste streams. Environ. Sci. Technol. 45, 5696–5703.
Castello, D., Kruse, A., Fiori, L., 2014. Supercritical water gasification of hydrochar. Chem. Eng. Res. Des. 92, 1864–1875.
Demir-Cakan, R., Baccile, N., Antonietti, M., Titirici, M.-M., 2009. Carboxylate-rich carbonaceous materials via one-step hydrothermal carbonization of glucose in the presence of acrylic acid. Chem. Mater. 21, 484–490.
Dinjus, E., Kruse, A., Tröger, N., 2011. Hydrothermal carbonization – 1. Influence of lignin in lignocelluloses. Chem. Eng. Technol. 34, 2037–2043.
Erlach, B., Harder, B., Tsatsaronis, G., 2012. Combined hydrothermal carbonization and gasification of biomass with carbon capture. Energy 45, 329–338.
Fiori, L., Valbusa, M., Castello, D., 2012. Supercritical water gasification of biomass for H2production: process design. Bioresour. Technol. 121, 139–147. Funke, A., Ziegler, F., 2010. Hydrothermal carbonization of biomass: a summary and
discussion of chemical mechanisms for process engineering. Biofuels Bioprod. Biorefin. 4, 160–177.
Funke, A., Ziegler, F., 2011. Heat of reaction measurements for hydrothermal carbonization of biomass. Bioresour. Technol. 102, 7595–7598.
Gajic´, A., Ramke, H.-G., Hendricks, A., Koch, H.-J., 2012. Microcosm study on the decomposability of hydrochars in a Cambisol. Biomass Bioenergy 47, 250–259.
Gao, Y., Chen, H.-P., Wang, J., Shi, T., Yang, H.-P., Wang, X.H., 2011. Characterization of products from hydrothermal liquefaction and carbonation of biomass model compounds and real biomass. J. Fuel Chem. Technol. 39, 893–900.
Goto, M., Obuchi, R., Hirose, T., Sakaki, T., Shibata, M., 2004. Hydrothermal conversion of municipal organic waste into resources. Bioresour. Technol. 93, 279–284.
Heilmann, S.M., Jader, L.R., Sadowsky, M.J., Schendel, F.J., Keitz, M.G.V., Valentas, K.J., 2011. Hydrothermal carbonization of distiller’s grains. Biomass Bioenergy 35, 2526–2533.
Hwang, I., Aoyama, H., Matsuto, T., Nakagishi, T., Matsuo, T., 2012. Recovery of solid fuel from municipal solid waste by hydrothermal treatment using subcritical water. Waste Manage. 32, 410–416.
Kruse, A., Dinjus, E., 2007. Hot compressed water as reaction medium and reactant 2. Degradation reactions. J. Supercrit. Fluids 41, 361–379.
Libra, J.A., Ro, K.S., Kammann, C., Funke, A., Berge, N.D., Neubauer, Y., Titirici, M.-M., Fühner, C., Bens, O., Kern, J., Emmerich, K.H., 2011. Hydrothermal carbonization of biomass residuals: a comparative review of the chemistry, processes and applications of wet and dry pyrolysis. Biofuels 2, 89–124.
Liu, Z., Balasubramanian, R., 2012. Hydrothermal carbonization of waste biomass for energy generation. Procedia Environ. Sci. 16, 159–166.
Lu, L., Namioka, T., Yoshikawa, K., 2011. Effects of hydrothermal treatment on characteristics and combustion behaviors of municipal solid wastes. Appl. Energy 88, 3659–3664.
Lu, X., Jordan, B., Berge, N.D., 2012. Thermal conversion of municipal solid waste via hydrothermal carbonization: comparison of carbonization products to products from current waste management techniques. Waste Manage. 32, 1353–1365.
Lu, X., Pellechia, P.J., Flora, J.R.V., Berge, N.D., 2013. Influence of reaction time and temperature on product formation and characteristics associated with the hydrothermal carbonization of cellulose. Bioresour. Technol. 138, 180–190.
Lu, X., Berge, N.D., 2014. Influence of feedstock chemical composition on product formation and characteristics derived from the hydrothermal carbonization of mixed feedstocks. Bioresour. Technol. 166, 120–131.
Müller, J.B., Vogel, F., 2012. Tar and coke formation during hydrothermal processing of glycerol and glucose. Influence of temperature, residence time and feed concentration. J. Supercrit. Fluids 70, 126–136.
Mumme, J., Eckervogt, L., Pielert, J., Diakité, M., Rupp, F., Kern, J., 2011. Hydrothermal carbonization of anaerobically digested maize silage. Bioresour. Technol. 102, 9255–9260.
Pala, M., Kantarli, I.C., Buyukisik, H.B., Yanik, J., 2014. Hydrothermal carbonization and torrefaction of grape pomace: a comparative evaluation. Bioresour. Technol. 161, 255–262.
Román, S., Nabais, J.M.V., Laginhas, C., Ledesma, B., González, J.F., 2012. Hydrothermal carbonization as an effective way of densifying the energy content of biomass. Fuel Process. Technol. 103, 78–83.
Schuhmacher, J.P., Huntjens, F.J., Van Krevelen, D.W., 1969. Chemical structure and properties of coal XXVI – studies on artificial coalification. Fuel 39, 223–234.
Sevilla, M., Fuertes, A.B., 2009. The production of carbon materials by hydrothermal carbonization of cellulose. Carbon 47, 2281–2289.
Stemann, J., Putschew, A., Ziegler, F., 2013. Hydrothermal carbonization: process water characterization and effects of water recirculation. Bioresour. Technol. 143, 139–146.
Titirici, M.-M., Antonietti, M., 2010. Chemistry and materials options of sustainable carbon materials made by hydrothermal carbonization. Chem. Soc. Rev. 39, 103–116.
Unur, E., 2013. Microporous and mesoporous materials functional nanoporous carbons from hydrothermally treated biomass for environmental purification. Microporous Mesoporous Mater. 168, 92–101.