UNIVERSITE DE GENÈVE FACULTÉ DES SCIENCES
Département de chimie minérale, Professeur J. Buffle analytique et appliquée Dr. K. J. Wilkinson
Bio-physicochemical Parameters Influencing Cadmium Uptake by the
Unicellular Green Alga Chlamydomonas reinhardtii
THÈSE
Présentée à la Faculté des sciences à l’Université de Genève pour obtenir le grade de Docteur ès sciences, mention chimie
par
Heliana KOLA
de Tirana (Albanie)Thèse No 3601
GENÈVEAtelier de reproduction de la Section de Physique 2005
REMERCIEMENTS
Ma reconnaissance va en premier lieu à M. le Docteur Kevin Wilkinson, co-directeur de thèse, pour ses précieux conseils, sa disponibilité constante et la bienveillance qu’il n’a cessé de me témoigner durant l’élaboration de ce travail.
Je tiens aussi à remercier très chaleureusement M. le Docteur Augusto Porta pour ses encouragements, sa confiance envers moi et l’institut BATTELLE pour son assistance financière; leur soutien m’a été indispensable.
Mes remerciements s’adressent également à MM. les Professeurs Herman van Leeuwen et Jacques Buffle, qui, par l’intérêt qu’ils ont porté à ce travail, m’ont permis de le mener à terme! Les discussions avec eux étaient précieuses.
J’ai en outre bénéficié de l’assistance technique de MM. les Docteurs Michel Martin, Luis M. Laglera, Michel Pelletier et Mme les Docteurs Nalini Parthasarathy et Cécile Gehin-Deval. Que tous soient ici vivement remerciés!
Ma gratitude s’adresse aussi au Docteur M. Michel Goldschmidt-Clermont et à M. le Professeur M. Bill Zerges et Mmes les Professeures Sabine Waffenschmidt et Elizabeth Harris pour les discussions fructueuses que j’ai pu avoir avec eux et qui m’ont aidé à mieux comprendre le comportement des algues.
J’aimerais exprimer ma sincère reconnaissance au Dr. Klaus Müller pour son aide initiale dans la compilation de la bibliographie et M. Jacques Auger pour son aide occasionnelle au laboratoire.
Je tiens à remercier également les Dr. Christel Hassler, Dr. Vera Slaveykova, Dana Simon, Isabelle Worms, Dr. Alain Reinhardt et Cristina Lamellas qui ont partagé avec moi leurs connaissances pratiques et théoriques.
Ma reconnaissance va enfin à ma famille et mes proches ainsi qu’à toutes les personnes qui m’ont soutenue – et supportée – ! – durant ce long périple.
DETAILED LIST OF CONTENTS
ACKNOWLEDGEMENTS i
GLOSSARY iv
FRENCH SUMMARY vii
1-INTRODUCTION 1
1.1 - Chemical speciation of metals in natural waters 2 1.2 – Physicochemical interaction of metals with aquatic organism 3 1.3 - Models used in the kinetics of metal adsorption and internalization 7
1.4 - Factors influencing metal uptake 11
1.5 - The case of cadmium and C. reinhardtii 12 1.5.1 - Levels of Cd in the environment 12
1.5.2 - Metal adsorption 14
1.5.3 - Metal internalization 19
1.5.4 - Effects of metals on growth and assimilatory pathways 24 1.5.5 - Morphologic changes in the presence of metals 29 1.5.6 - Genetic mutation in response to heavy metals 29 1.6 - Implications of using algae in bioavailability studies 31
2- OBJECTIVES 36
3-MATERIALS AND METHODS 38
3.1 - Cell culture maintenance, growth and isolation 38
3.2 - Uptake experiments 40
3.2.1 - Experimental conditions 40
3.2.2 – Adsorbed Cd 41
3.2.3 - Cellular and carrier bound Cd 41
3.2.4 - Competition experiments 42
3.2.5 - Cd uptake fluxes in the presence of a fulvic acid 43
3.2.6 - Cd efflux 44
3.3 - Lability calculations 44
3.4 - Cd speciation measurements 45
3.4.1 - PLM measurements 45
3.4.2 - ASV measurements 45
3.5 - Quantification and characterization of algal exudates 46
3.5.1 - Bradford assay 46
3.5.2 - SDS-PAGE 47
3.5.3 - Total organic carbon and nitrogen analysis 47 3.6 - Algal membrane lipidic permeability and metabolism 48 4 - METHOD OPTIMIZATION AND PRELIMINARY EXPERIMENTS 49 4.1 - Optimization of the EDTA wash to distinguish cellular and adsorbed Cd 49
4.2 - Comparison of bioaccumulation methods 55
4.4 - Bioaccumulation experiments 59 4.4.1 - Cd internalization fluxes in the presence of hardness cations 60 4.4.2 - Competition effects on biouptake: Cu, Zn 62 4.4.3 - Ligand effects on Cd internalization fluxes 65 5 - CADMIUM INTERACTION WITH CHLAMYDOMONAS REINHARDTII
AND ITS CELL WALL PROTEINS 70
5.1 - Results and Discussion 71
5.1.1 - Cd adsorption by C. reinhardtii WT and CW-2 strains 71
5.1.2 - Exudate release 75
5.1.3 - Cd (II) speciation measurements: PLM and ASV 77 5.1.4 - Implications for bioaccumulation studies 78
5.2 - Conclusion 80
6 - CADMIUM UPTAKE A GREEN ALGA CAN BE PREDICTED BY
EQUILIBRIUM MODELLING 81
6.1 - Results and Discussion 83
6.1.1 - Cd internalization 83
6.1.2 - Cd efflux 86
6.1.3 - Carrier bound Cd (WT strain) 87
6.1.4 - Competition studies 88
6.1.5 - Influence of pH 90
6.1.6 - Role of a fulvic acid in Cd uptake fluxes 92
7 - SUMMARY AND CONCLUSIONS 94
8 - REFERENCES 96 9 - ANNEXES 112 112 9.1 - Cadmium 9.1.1 - Cadmium in environment 112 9.1.1.1 - Cadmium emissions 112 9.1.1.2 - Cadmium in air 113 9.1.1.2 - Cadmium in soils 113 9.1.2 - Uses of Cd in industry 114
9.1.3 - Implications for the future 116
9.1.4 - Cd exposure and human health 117 9.1.4.1 - Factors determining levels of human exposure 118
9.1.4.2 - Human intake of Cd 118
9.1.4.3 - Human health effects of Cd 120 9.2 - Biological interaction of trace metals with Chlamydomonas 121
9.2.1 - Unicellular green algae 121
9.2.2 - Different strategies to control the availability of essential metals 123
9.2.3 - Protein induction 124
9.3 – Biosensors 129
9.3.1 - Microorganisms as a sensing component 131
GLOSSARY
AAP Algal Assay Procedure medium AAS flame atomic absorption spectrometry
APS ammonium persulfate
ASV anodic stripping voltammetry
ATSDR Agency for Toxic Substances and Disease Registry BLM biotic ligand model
CW-2 cell wall-less strain of C. reinhardtii CaM calmodulin
Dave average diffusion coefficient of metal species: function of DML, DM, KS
DM diffusion coefficient of metal
DML diffusion coefficient of metal species
DETA diethylen triamine
DGA diglycolic acid
EDTA ethylenediamine-tetraacetic acid
EPM electrophoretic mobility measurements FIAM free ion activity model
∆G° change in the Gibbs free energy of the system (under a set conditions)
∆Gads change in the Gibbs free energy for the adsorption reaction
GS glutamine synthetase GSH glutathione
HEPES N-2-hydroxyethylpiperazine-N’-2-ethanesulfonic acid HEPPS N-2-hydroxyethylpiperazine-N’-3-propanesulfonic acid
HEPPSO N-[2-hydroxyethyl]piperazine-N’-2-hydroxypropanesulfonic acid 8-HQ 8-hydroxyquinoline-5-sulfonic acid
HMW high molecular weight
HRGP hydroxyproline-rich glycoproteins ∆H° change in the enthalpy of the system
I ionic strength
IDA iminodiacetic acid
ICP-MS inductively coupled plasma mass spectrometry ISE ion selective electrode
Jdiff diffusion flux
Jint metal internalization flux (uptake rate)
Jmax maximum metal internalization flux
Kads equilibrium constant for metal adsorption to binding sites
ka rate constant for the formation of the transport site complex
kd rate constant for the dissociation of the transport site complex
Kcond conditional stability constant
kint first order rate constant for the transfer of the bound metal into the cell
KD equilibrium dissociation constant (KD = kd / ka)
KH Henry constant
KM Michaelis-Menten half-saturation constant
KM-Rcell affinity constants of the metal for the transporter
KS stability constant of the M-L(z-n) complex
L lability of the complexes Ln- free ligands
LMW low molecular weight
M metal
Mz+ free metal ion
ML or M-L(z-n) metal species (complexes)
M0 metal at the vicinity of the microorganism
Mcell internalized metal
[M]diss dissolved metal
M-Rcell transport sites bound by M
µ reaction layer thickness
MES 2-[N-morpholino] ethanesulfonic acid MOPS morpholino propane sulphonic acid
mt metric tonnes
NTA nitrilotriacetic acid
NIST National Institute of Standards and Technology NiR nitrite reductase
OECD Organization for Economic Co-operation and Development
PC phytochelatin
pKa affinity constant of the proton of the binding sites
POPSO piperazine-N, N’-bis[hydroxypropanesulfonic acid] POR protochlorophyllide reductase
PTWI provisional tolerable weekly intake PVC polyvinylchloride
R gas constant
R0 radius of the microorganism
Rcell transport binding sites
Rcell-tot total transport sites
SDS-PAGE sodium dodecyl sulphate – polyacrylamide gel electrophoresis ∆S° change in the entropy of the system
SRFA Suwannee River fulvic acid δ thickness of the diffusion layer
T temperature
TAP tris-acetate-phosphate TETA triethylen tetramine
TEMED N, N, N', N'-tetramethyl-1-,2-diaminomethane
TN nitrogen content
TOC total organic carbon
TRIS tris-(hydroxymethyl)aminomethane TRX thioredoxins (small ubiquitous proteins)
ΓMeq metal amount adsorbed to the binding sites at equilibrium at [Mz+].
Γmax maximum amount of metal adsorbed to the binding sites
τ time to diffuse through the diffusion layer and the cell wall
Xcell non-specific binding sites
WT wild type
W1 to W7 layers of the cell wall of C. reinhardtii green algae WHO World Health Organization
RESUME DE LA THESE EN FRANCAIS
1 - INTRODUCTION
La pollution par les métaux toxiques dans l'environnement aquatique est un des problèmes auxquels doit faire face la société actuelle. Ces métaux entrent dans les systèmes aquatiques par des sources ponctuelles et tendent à s'accumuler dans les sédiments et à se concentrer dans les chaînes alimentaires aquatiques. La biodisponibilité et la toxicité des métaux traces présents en milieu aquatique dépend de leur type et de leurs formes chimiques (spéciation des métaux). Dans les eaux naturelles, les métaux peuvent exister sous différentes formes: cations libres, métaux complexés à la matière organique dissoute, à des ions inorganiques et à des particules solides (i.e. colloïdes, microorganismes).
Pour des métaux bivalents étudiés au laboratoire en milieux artificiels, il existe beaucoup d’exemples que la réponse biologique provoquée par le métal dissous dépend de la concentration de l'ion métallique libre, Mz+. Pour un organisme aquatique donné, les effets biologiques d'un métal dissous vont également dépendre de divers facteurs environnementaux (i.e., pH, dureté, [Ca], concentration en matière organique dissoute). Ces facteurs physico-chimiques peuvent en principe agir de deux manières: (i) directement sur l'organisme, en influençant sur la physiologie et donc la sensibilité au métal; (ii) indirectement, en influençant notamment la spéciation du métal dans le milieu. Dans ce contexte, le sujet de thèse est orienté vers la compréhension des mécanismes de transferts de métaux depuis la solution aqueuse vers les microorganismes. Etant donné que l'effet de ces différents facteurs varie selon le métal étudié ainsi que d'une espèce à l'autre, une étude plus spécifique est nécessaire. Le but de ce travail est d’établir un lien entre la biodisponibilité du cadmium et les effets biologiques chez l’algue verte unicellulaire Chlamydomonas reinhardtii. Le "Modèle de l'Ion Libre" (MIL, ou "Free Ion Activity Model", FIAM), compte tenu de sa capacité à expliquer la grande majorité des données toxicologiques obtenues en laboratoire dans des milieux artificiels, a été choisi comme point de départ pour prédire la biodisponibilité du cadmium. Le MIL suppose un processus d’internalisation suffisamment lent qui implique l’existence d’un équilibre entre la surface de l’organisme et la solution. Dans cette étude sont testées les limites du MIL dans des conditions relativement réalistes, notamment en ce qui concerne le pH, [Ca2+], et la présence de ligands organiques naturels (par exemple : acides fulviques). Cette validation du modèle a été rigoureusement vérifiée par des expériences de prise en
charge ("uptake") où on suit de près la cinétique des réactions impliquées (adsorption du métal sur la parois membranaire et aux sites de transport, son transport à travers la membrane plasmique). De plus, dans cette étude, la prise en compte de la matière organique relâchée par l’algue est indispensable pour comprendre la spéciation et la biodisponibilité potentielle du Cd dans les milieux naturels.
Etant donné que la mesure de la spéciation des métaux traces dans les eaux naturelles demande des techniques de manipulation élaborées et très propres, il est hautement souhaitable de mettre au point et d'utiliser des techniques possédant une sélectivité pour les espèces chimiques étudiées. Pour cela cette étude permettra d’améliorer les évaluations de la biodisponibilité ou toxicité des métaux chez les organismes aquatiques.
2 - Résultats et discussion
2.1 - Croissance des algues
Deux souches de C. reinhardtii ont été utilisées durant de cette étude: une souche sauvage (WT) et une souche qui ne possède pas de parois cellulaires (CW-2). Dans un premier temps, les algues sont mises en croissance dans un milieu de culture standardisé (Tris-Acétate-Phosphate, TAP). Afin d’éviter l’agrégation entre les cellules, les concentrations des micro- et macro-nutriments du milieu de TAP ont été diluées 4 fois. Le milieu modifié (TAP) paraît optimal pour la croissance de C. reinhardtii du point de vue de la concentration algale en phase exponentielle (2 x 10⁻⁶ cellules mL-1) et du taux de croissance.
2.2 - La prise en charge (« uptake ») du Cd
Afin de tester le MIL, les algues ont été resuspendues dans une solution contenant seulement le tampon biologique (MOPS, pH = 7.0), les sels inorganiques (i.e., NaNO3) afin de pouvoir
ajuster la force ionique à 10-2 M, ainsi que le cadmium et les ligands (tampons métalliques). L’accumulation de Cd y est mesuré sur un intervalle de temps court (25 min) afin de limiter la diminution du Cd en solution dû à la forte adsorption ainsi que les effets biologiques dûs à la
présence du métal (par exemple, mortalité des cellules) et l’absence de nutriments (par exemple, relâchement des exudats). Les algues ont été récupérées de la solution de croissance par centrifugation et utilisées pour l’expérience de bioaccumulation. Les concentrations de Cd adsorbées (Fig. vf.1a), internalisées (Fig. vf.1b) et dissoutes (Fig. vf.1c) sont mesurées en fonction du temps pour [Cd2+] en solution variant de 10-11 M à 10-3 M. Le flux d’internalisation, Jint, est calculé à partir de la pente de l’augmentation linéaire du Cd cellulaire en fonction de temps ; l’intercept donne la concentration du Cd lié aux transporteurs, {Cd-Rcell} (Fig. vf.1b). Le Cd adsorbé sur les parois cellulaires de l’algue est donné par la quantité de Cd désorbée par le lavage à l’EDTA (10 min).
[C d]ads (x 10 11 mol cm -2 ) 0 1 2 3 Temps (min) 0 5 10 15 20 25 [Cd ] di ss (x 10 7 M) 1 2 3 4 (b) Temps (min) 0 5 10 15 20 25 30 [Cd ]int (x 10 11 mo l cm -2 ) 0 2 4 6 (a) (b) pente = J (c) int intercept = {Cd-Rcell}
Figure vf.1: Cd adsorbé (a), internalisé (b) et dissout (c) pour les souches WT (●) et CW-2 (○).
Un lavage à l’EDTA de 10 minutes s’est avéré suffisant pour désorber le Cd de la surface de l’algue. Afin de distinguer les deux processus possibles (désorption et efflux) qui pourraient avoir lieu pendant le lavage à l ‘EDTA, les expériences de désorption ont été conduites avec des algues contenants différents concentrations de Cd (Fig. vf.2)
Temps (min) 0 10 20 30 40 [Cd] int (x 10 10 mo l cm -2 ) 0.0 0.2 0.4 0.6 0.8 1.0 1.2
Figure vf.2: Cd cellulaire après 10 (●), 30 (○) et 40 (▼) minutes d’exposition au 4 x 10⁻⁷ M Cd en fonction du
temps de contact avec EDTA. Les lignes pleines, interrompues et pointillées représentent une diminution en Cd cellulaire de premier ordre avec kd = 4 x10⁻² min-1.
En effet, la diminution du Cd cellulaire, [Cd]int, pour différents concentrations initiales de
[Cd]int en présence de EDTA, n’a pas pu être décrite par un simple processus de premier ordre
(voir en Fig. vf.2 que les points expérimentales ne suivent pas l’équation de diminution exponentielle du premier ordre), témoignant que probablement deux processus sont présents, au moins initialement. L’efflux de Cd pendant le lavage à l ‘EDTA (10 min.) a été considéré négligeable par rapport au flux d’internalisation et les calculs ont démontrés que l’erreur dûe à ce processus était < 5%.
Adsorption du Cd. Les concentrations de Cd adsorbées par les deux souches augmentent avec le temps, ce qui implique qu’un équilibre entre le Cd en solution et celui lié à la surface de l’algue n’est pas atteint (Fig. vf.1a). Une augmentation plus faible de Cd adsorbé (10 min) en fonction du [Cd2+] que celle prédite par une relation de premier ordre est observée (Fig. vf.3a). De plus, aucune saturation des sites de liaisons sur les parois n’a été observé, témoignait de la forte capacité de C. reinhardtii d’adsorber le Cd. Plusieurs hypothèses ont été émises afin de comprendre ces observations: i) cinétique d’adsorption lente, ii) désorption lente de l’EDTA, iii) production des nouveaux sites d’adsorption (i.e., protéines des parois cellulaires).
log [Cd2+] -9 -8 -7 -6 -5 (a) log [Cd2+] -10 -9 -8 -7 -6 -5 -4 -3 log [ C d]ads (mol cm -2 ) -13 -12 -11 -10 -9 (a) (b)
Figure vf.3: a) Log Cd adsorbé (10 min) par le souches WT (cercle plein) et CW-2 (cercle vide) de C.
reinhardtii en fonction du Log [Cd2+] (pente = 0.5, R2 = 0.98). b) Log Cd adsorbé (WT) en fonction du (log)
[Cd2+] pour la souche WT exposé pendant 5 (○), 20 (□) et 60 (∆) minutes au Cd.
Dans le cas d’un taux d’adsorption limitant, la pente de Cd adsorbé en fonction du [Cd2+] devrait diminuer progressivement avec l’augmentation des temps d’exposition au Cd, ce qui n’est pas le cas (pente ~0.6 in Fig. vf.3b). De plus, les calculs basés sur les valeurs de ka,
[site]tot, KH, DMCd et R0 ont démontrés que la désorption est un processus rapide (kd =10-2 –
10-4 s-1) et que l’équilibre entre Cd en solution et celui lié à la surface de l’algue devrait être atteint en moins de 2 minutes pour [Cd2+] = 2 x 10⁻⁷ M, ce qui n’est pas le cas (voir Fig. vf.1a).
L’hypothèse de la production de nouveaux sites non-spécifiques semble être la meilleure explication de l’augmentation du Cd adsorbé en fonction du temps, ce qui implique que l’adsorption du Cd à la surface de Chlamydomonas est un processus dynamique dans les conditions étudiées. Néanmoins, ce résultat n’a aucun effet sur l’application du MIL puisque le Cd lié aux sites non-spécifiques des parois n’est pas responsable de son internalisation. C’est plutôt l’adsorption spécifique (i.e. Cd lié aux transporteurs) qui est responsable pour le transport de Cd à l’intérieur de la cellule.
Internalisation du Cd. Une relation linéaire comme prédit par MIL (i.e., pente de 1 en échelle Log-Log) entre les flux d’internalisations de Cd et sa concentration en solution est observée pour n’importe quel [Cd2+] et tampon métallique utilisé pour les deux mutants de C. reinhardtii (Fig. vf.4a). De plus, le flux d’internalisation de Cd était un ordre de grandeur plus petit que le flux de diffusion de Cd2+. A cause de la nature limitante du flux d’internalisation,
les différences du flux de diffusion de Cd2+ (<10 fois) dues à la parois cellulaire n’auront aucun effet sur la bioaccumulation du Cd.
log J in t (m ol cm -2 mi n -1 ) -15 -14 -13 -12 -11 log [Cd2+] (M) -10 -9 -8 -7 -6 -5 -4 log {Cd-R cel l } (mol cm -2 ) -14 -13 -12 -11 -10 (a) (b)
Figure vf.4: Flux d’internalisation (a) et d’adsorption spécifique (b) du Cd en absence (triangle en bas) ou présence d’acide citrique (cercle), diglycolique (carré) et NTA (triangle en haut) pour C. reinhardtii WT (symbole plein) et CW-2 (symbole vide). La droite correspond au flux de diffusion de Cd2+. L’équation de
Michaelis-Menten est représentée par la ligne pleine (WT: KM = 10-6 M and Jmax = 1.3 x 10⁻¹¹ mol cm-2 min-1)
et interrompue (CW-2: KM = 2 x 10⁻⁷ M and Jmax = 2.3 x 10⁻¹² mol cm-2 min-1). La ligne pointillée représente
l’isotherme de Langmuir (Kads = 106.2 M-1 et Rcell-max = 3.2 x 10⁻¹¹ M mol cm-2.
Le flux d’internalisation maximal, Jmax, pour le WT était 5-fois plus grand (1.3 x 10⁻¹¹ mol cm-2 min-1) que pour la souche sans parois cellulaire (2.3 x 10⁻¹² mol cm-2 min-1). De plus, la constante de stabilité pour l’adsorption du Cd aux sites de transport de la souche CW-2 était 5-fois plus grande (106.7 M) que celle du WT (106 M). Etant donné que les flux d’internalisation pour [Cd2+] < 10-7 M sont similaires pour les deux souches, la plus grande affinité du Cd pour les transporteurs du CW-2 suggère que la souche WT contient un plus grand nombre de transporteurs. Comme observé pour le Jint, l’adsorption spécifique du Cd à la souche WT était un processus saturable et le nombre maximal des sites spécifiques était de 3.2 x 10⁻¹¹ M mol cm-2 (Fig. vf.4b). Cela a permis de calculer la constante de vitesse d’internalisation de Cd par le WT (kint = 2.8 x 10⁻¹ min-1).
2.3 - Paramètres physico-chimiques influençant la bioaccumulation du Cd.
Dans le but de vérifier le MIL dans les conditions naturelles, la présence de compétiteur (Ca, Cu, Zn), l’effet du pH et de la matière organique (par exemple acide fulvique) sur l’accumulation et les flux d’internalisation du Cd ont également été étudiés. Par exemple, les effets de Cu (Fig. vf.5a), Zn (Fig. vf.5) et Ca (Fig. vf.6a) ont été prévisible par le MIL en utilisant des constantes de stabilité 105.6 M-1, 105.2 M-1, 104.5 M-1, respectivement.
Cu (x 104 M) 0 1 2 3 4 5 [C d]in t (x 10 11 mo l c m -2) 0 1 2 3 4 5 Zn (x 104 M) 0 1 2 3 4 5 (a) (b)
Figure vf.5: L’effet du Cu (a) et Zn (b) dans l’accumulation du Cd par la souche WT après 10 minutes d’exposition à 4 x 10⁻⁷ M Cd. Prédictions du Cd cellulaire par le MIL (K
Cu-Rcell = 105.6 M-1: ligne pleine; K
Zn-Rcell = 105.2 M-1: ligne interrompue).
L’interaction du transporteur avec deux protons est mieux prédite par le MIL (ligne interrompue dans Fig. vf.6b) que celle avec un seul proton (ligne pleine dans Fig. vf.6b). Par contre, les hautes concentrations de Cd2+ et H+ rendent difficile la prédiction de l’effet compétiteur du proton sur Jint. L’effet de la matière organique (acide fulvique: SRFA), quant
à lui, est prévisible par le MIL dans le cas de basses concentrations mais pas dans le cas [SRFA] > 20 mg L-1.
log [Cd2+] (M) -7 -6 -5 -4 -3 log J in t (m ol c m -2 min -1 ) -14 -13 -12 -11 -10 pH 5 6 7 8 Jint (x 1 0 13 mol cm -2 mi n -1) 0 2 4 6 (a) (b)
Figure vf.6: a) Flux d’internalisation de Cd par la souche WT exposée aux différent [Cd2+] en présence de Ca:
0 M (▲), 10-4 M (○) or 10-3 M (■). Les lignes représentent les prédictions de J
int par le MIL utilisant a KCa-Rcell
= 104.5 M-1. b) Flux d’internalisation de Cd en fonction de pH (WT) pour [Cd2+] = 5 x 10⁻⁸ M). La ligne pleine
(KH-Rcell = 105.2 M-1) et interrompue (KH2-Rcell = 1011.3 M-1) représentent les prédictions de Jint par le MIL.
2.4 - L’influence des exudats dans la spéciation du Cd
Dans le but d'étudier l'influence de la composition du milieu d'expérience sur la production d’exudats, différents tampons biologiques ont été utilisés pour reproduire la même expérience de bioaccumulation. La quantité de protéines relâchées dans le milieu durant d'expérience de bioaccumulation diffère selon le type de tampon utilisé. Les algues relâchent plus de protéines quand l’expérience est faite dans des tampon de Good, comme par exemple MOPS et HEPES (Fig. vf.7a). La séparation par électrophorèse sur gel de polyacrylamide (7.5%) de l'ensemble des protéines extracellulaires de C. reinhardtii retrouvées dans le milieu d’expérience a révélé qu'une partie de ces protéines provenaient de la couche extérieure de la parois cellulaire (Fig. vf.7b). De plus, la présence ou l'absence du Cd n'a eu aucun effet sur leur production, témoignant ainsi d'un stress induit plutôt par le tampon biologique que par le métal (Fig. vf.7b). Ce résultat pourrait en partie expliquer la production de nouvelles protéines (sites) incorporées dans la parois cellulaire de l’algue. En effet, la cellule est stimulée à produire plus de protéines pour remplacer celles relâchées dans le milieu.
Temps (min) 0 10 20 30 40 50 60 Prot éines ( µg cm -2 ) 0.2 0.4 0.6
Figure vf.7: a) Protéines relâchées dans le milieu d'expérience en présence de différents tampons sans Cd: 10-2
M KH2PO4 / K2HPO4 (●), 10-2 M HEPES (○) et 10-2 M MOPS (▼). b) SDS PAGE des surnageant de C.
reinhardtii concentrés en présence (+) et absence (-) de 10-7 10 (1), 20 (2), 30 (3) et 60 (4) minutes (mw: masse
molaire; w6: protéines purifiées de la couche W6 de la parois cellulaire).
Dans le but de vérifier la capacité de complexation de Cd par les exudats, des techniques analytiques de spéciation permettant de mesurer l’ion libre (PLM) ainsi que le métal labile ont aussi été utilisées. Dans ce cas, une diminution du Cd libre ou labile a été observée au cours de l'expérience de bioaccumulation (Fig. vf.8a). De plus, Cd2+ et [Cd]labile ont progressivement
diminuées quand Cd a été ajouté aux suspension d'algues obtenues à différent temps d'exposition à une solution sans Cd. Ces résultats confirment que la production d’exudats n’est pas induite par le Cd (Fig. vf.8b).
Temps (min) 0 10 20 30 40 50 60 [Cd] la bile ou [Cd 2+ ] (% du Cd d is sout ) 0 20 40 60 80 100 (b) Temps (min) 0 10 20 30 40 50 60 [Cd] la bile ou [Cd 2+ ] (% du Cd di sso ut ) 0 20 40 60 80 100 (a)
Figure vf.8: (a) [Cd] labile (●) et libre (▲) normalisé par Cd dissout dans le milieu d'expérience (densité = 2.5 cm2 mL-1). (b) [Cd] labile (●) et libre (▲) en fonction du temps de contact des algues avec le milieu
d'expérience sans Cd après avoir ajouté Cd à une concentration finale de 50 nM (densité = 1.5 cm2 mL-1).
33 kDa 45 kDa 66 kDa 97 kDa GP3 GP2 GP1 mw w6 +1 +2 +3 +4 - 1 -2 -3 -4
3 - Conclusions
L’adsorption du Cd par les deux souches de C. reinhardtii ne peut pas être régie par les isothermes de Langmuir. Le processus d'adsorption de Cd se déroule en une étape rapide au cours de laquelle plus que 50% du Cd est adsorbés en moins de 5 minutes suivie d'une autre étape plus lente. L'analyse des données cinétiques montre aussi que le processus d'adsorption semble plutôt être contrôlé par la production de nouveaux sites que par la diffusion ou les réactions d’échanges ioniques sur la parois cellulaire.
La majorité des résultats présenté dans ce travail permet de mettre en évidence que l’internalisation du Cd par C. reinhardtii pourra être prédite par les modèles basés sur les équilibres thermodynamiques des métaux traces près de la surface des miroorganismes. Ceci implique que le Model de l’Ion Libre pourra être utilisé pour relier les concentrations ou la vitesse d’accumulation (flux d’internalisation) du Cd par C. reinhardtii aux concentrations de ce métal dans un système aquatique relativement simple. Même si des déviations du MIL ont été observées pour des concentrations élevées de matière organique, de Cd et de proton, ces concentrations ne sont généralement pas représentatives de la majorité des milieux naturelles. Néanmoins, ce modèle demande à être testé in situ, comme par exemple pour eaux naturelles présentant des caractéristiques physico-chimiques variées, afin d’assurer son application générale pour une large gamme de conditions.
1 - INTRODUCTION
Water is a crucial compound in the evolution of living organisms since their biochemical systems are all adapted to function in aqueous media. Five m3 of water are used by a single
individual each day (Moss B.; 1980). Some of this water comes from relatively uncontaminated upland lakes and rivers but in the lowlands, water must be used and reused many times as it passed ultimately from atmosphere to land and sea in the hydrological cycle. The most common water pollutants are high levels of organic matter, plant nutrients, suspended mineral particles, heavy metals, pesticides, organic chemicals, acids and radioactive substances.
The concentrations of trace metals in continental waters are primarily controlled by atmospheric deposition and by weathering processes on soils and bedrock. The atmosphere, in particular has become a key source for the transfer of trace metals to remote aquatic ecosystems. The fluxes of trace metals into freshwaters have increased, mainly due to anthropogenic influences on the important pathways and processes. Domestic and industrial wastewater, sewage discharge and urban runoff contribute large quantities of metal pollution to the aquatic environment.
One of the key problems of environmental chemistry and toxicology remains how to best relate metal exposures to their biological effects. When describing the interaction of trace metals with aquatic biota, at least three important aspects must be considered: (i) the chemical speciation of these metals in the external environment, (ii) interactions of the metal with the biological membrane leading to biological internalization and (iii) the resulting biological effects. Although, some steady-state models attempt to relate the biological response either to the free-metal ion concentration in solution, (basis of the Free Ion Activity Model, FIAM, (Morel F.M.M. and Hering J.G.; 1993; Campbell P.G.C.; 1995)) or to the metal bound to sensitive sites at the surface of the organism, (basis of the Biotic Ligand Model, BLM, (Playle R.C.; 1998)), they do not always take into account the complexity of the environmental processes that are at the interface of physics, chemistry and biology. The work presented here is an attempt to bring together all of these disciplines in order to improve our understanding of the important microscopic processes that determine trace metal bioavailability.
1.1 - Chemical speciation of metals in natural waters
Chemical speciation is of utmost importance when evaluating the reactivity of a metal in biological and environmental processes. Trace metals exist in aquatic systems in a variety of chemical species. Only a small portion of the overall dissolved metal is generally present as free hydrated cations. Most metal ions form stable complexes by interacting with dissolved inorganic and organic ligands or inorganic (e.g. colloids) and organic (e.g. phytoplankton, bacteria) particles. The dissolved inorganic complexes present in natural waters are mainly chloro-, carbonato-, sulfato-, oxo-, and hydroxo complexes (Boyle E.A., Scalter F. et al.; 1976) whose distribution can generally be well characterized through the use of thermodynamic models.
Less is known about metal complexation with organic matter of biological origin and with organic pollutants, although this situation is changing with the development of sensitive metal speciation techniques. Organic matter contents vary from approximately 0.3 to 3 mg L-1 of
carbon in open seas to 1 to 10 mg L-1 in rivers, lakes and estuaries (Cosovic B., Ciglenecki I.
et al.; 2000). Organic compounds released by living organisms, or resulting from their decomposition can have a well-characterized structure (e.g., amino acids, hydroxyl acids, monosaccharides) but more frequently cannot be separated or characterized except into fractions with similar properties (e.g., fulvic acid, humic acids, polysaccharides, polypetides, lipids, and proteins). Organic matter appears to play an important role in the chemical speciation of metal ions in aquatic natural systems. For example, about 50% of dissolved Pb (Pitts L.C. and Wallace G.T.; 1994) and >90% of dissolved zinc (Bruland K.W.; 1989) is usually complexed with natural organic ligands in seawaters. In the case of cadmium, the tendency to form inorganic and organic complexes is relatively small, such that the ratio of [Cd2+] to total dissolved [Cd] is often approximately 0.5 (Stumm W. and Morgan J.J.; 1996).
Many metal effects on biological species can be explained in terms of the free-ion activity model (FIAM). Indeed, a dependence of trace metal uptake, phytoplankton growth and metabolism on the free-ion activity has been observed since the late 70s (Sunda W.G. and Guillard R.R.L.; 1976; Anderson M.A., Morel F.M.M. et al.; 1978). Nevertheless, complex calculations and measurements are generally needed in order to determine the concentration of the free metal in solution, especially in natural waters. For example, for calculations, total metal concentrations, pH, the concentrations of all ligands and the concentrations of other
ionic and molecular species must be known (Borgmann U.; 1982; Simkiss K. and Taylor M.G.; 1989). Other factors such as the concentration and nature of dissolved and suspended organic matter and suspended colloidal inorganic matter are important but cannot, as yet, be included into calculations (Campbell P.G.C.; 1995). A precise determination of metal speciation is a key to better understanding trace metal availability to biota.
1.2 – Physicochemical interaction of metals with aquatic organism
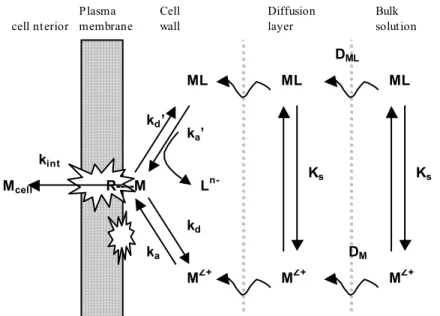
Biologically active metal species must reach the cell surface of the target biospecies before they can exert any effects. A schematic representation of the important processes involving metal species in the vicinity of the cell is shown in Figure 1 (Tessier A., Buffle J. et al.; 1994; Campbell P.G.C.; 1995). cell nterior Plasma membrane Cell wall Diffusion layer Bulk solution ML ML ML MZ+ MZ+ MZ+ Ks kint kd’ ka’ kd ka L n-R----M Ks DML DM Mcell
Figure 1: Schematic representation of the metal transport across the plasma membrane of an organism (Tessier A., Buffle J. et al.; 1994).
Metal diffusion. The first transport step from the bulk solution towards the cell is diffusion, which is driven by the concentration gradient of the metal between the bulk solution and the cell wall. For small organisms, radial diffusion occurs only via molecular diffusion as described by the Fick's first law. At steady-state the diffusive flux, Jdiff, can be described by Equation 1 (Buffle J., Altmann R.S. et al.; 1990):
[ ] [ ]
(
0)
0 1 1 M M R D J ave z diff ⋅ − + = + δ (1)where Dave depends on the diffusion coefficient of the metal (M) and its complex (ML), the stability constant defining the relationship between M and ML, the radius of the microorganism (R0) and the thickness of the diffusion layer (δ) (Fig. 1). The diffusive flux can
be increased by decreasing the thickness of the boundary layer, by increasing the metal concentration gradient or by decreasing the size of the microorganism (Eq. 1). The thickness of the boundary layer (δ) is a function of the movement of the cell relative to the bulk solution and it is estimated to be 20 to 30 µm for large algal cells (Tessier A., Buffle J. et al.; 1994). In natural waters, small freely suspended microorganisms move with the bulk solution, so that no flux enhancement will occur due to fluid motion for the uptake of a typical small solute (Wilkinson K.J. and Buffle J.; 2004) such as metal ions.
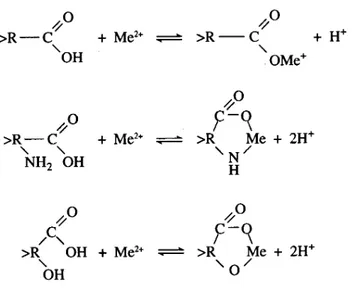
Nature of the cell surface. The metal, after being transferred from the external medium to the vicinity of the algal cell, will first react with cell wall, which protects the cell interior from its environment. The plant cell wall is a complex polymeric sheath, consisting of a network of cellulose microfibrils glued together by a polysaccharide and glycoproteinic matrix. The polysaccharide and glycoproteinic macromolecules that are the main structural components of the cell wall have surface groups such as -COOH, -OH, -NH2 (Crist R.H., Oberholser K. et
al.; 1981; Xue H.B., Stumm W. et al.; 1988; Cho D.-Y., Lee S.-T. et al.; 1994; Stumm W., Sigg L. et al.; 1994; Kiefer E., Sigg L. et al.; 1997) that, depending on pH, will be ionized. As a consequence, positively charged metal ions, Mz+, can bind to the cell surface by electrostatic or ionic forces (Fig. 2).
Figure 2: Surface complex formation of metals with the non-specific binding sites of the cell wall (>R represents the remainder of a cell wall glycoprotein).
The number of cell wall binding sites is assumed to be constant for a given cell at a given life stage as it depends only on the cell wall structure and its chemical composition. In the literature of the plant cell growth, two traditional time scales related to cell wall stretching are known: (i) a long time scale associated with the biosynthesis of wall components, spanning presumably a period of hours to days and (ii) a short time scale associated with cell expansion at a given composition spanning a period from seconds to hours (Veytsman B.A. and Cosgrove D.J.; 1998). The new wall material synthesized by the growing cell and secreted into the extracellular space is integrated into the extending wall, largely by the noncovalent mechanism of polymer adhesion, although some covalent cross-linking may occur. For a unicellular alga such as C. reinhardtii with a fast growth rate, these two time scales cannot be separated easily. For example, Goodenough and Heuser (Goodenough U.W. and Heuser J.E.; 1985) observed a newly synthesized primitive outer layer of the cell walls of C. reinhardtii <1 hour after the addition of autolysin, a cell wall disrupting agent.
The plasma membrane, which separates the cell wall from the cytoplasm, is best described as a phospholipid bilayer composed of various cholesterol, phospholipids, glycolipids and proteins (Albert B., Bray D. et al.; 1994) (Fig. 3). This bilayer is a physical barrier with a selective permeability allowing small hydrophobic molecules to pass through it while ions use the proteinic channels, pumps or carriers that traverse the membrane.
Figure 3: The fluid mosaic model of biological membranes.
Metal binding events and its transport. In the steady-state models such as the Free-Ion Activity Model (FIAM) or the Biotic Ligand Model (BLM) the metal and its complexes are supposed to be in equilibrium (pseudo-equilibrium) with a corresponding equilibrium constant, KS (Eq. 2).
Mz+ + Ln- ↔ M-L(z-n) (2)
The metal, after being transferred from the external medium to the vicinity of the cell, may react with non-specific sites such as the cell wall or with cell surface transport sites, Rcell, (see first reaction in Eq. 3).
ka kint
Mz+ + Rcell ↔ M-Rcell → Mcell
kd
(3)
where ka and kd are the rate constants for the formation and dissociation of the membrane
transport site complex and kint is the first order rate constant for the transfer of the bound
metal from the membrane imbedded transport complex into the cytoplasm. Depending on the stability of the complex and rate constants, M-L(z-n) can react with Rcell in a ligand exchange reaction (Eq. 4):
ka' kint
M-L(z-n) + Rcell ↔ M-Rcell + Ln- → Mcell
kd'
(4)
where kf' and kd' are the analogous rate constants for ligand exchange. The cell wall binding
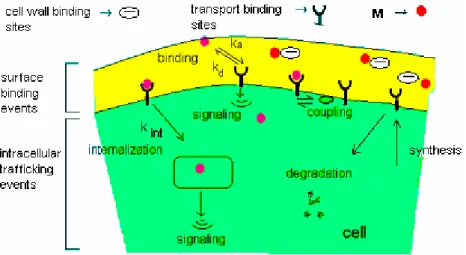
sites (non-specific) are physiologically inert such that the binding of the metal to these sites has no particular effect on the cell, whereas the transport binding sites (specific) are physiologically active and may be perturbed when a toxic metal is bound (Fig. 4). It is generally assumed that the internalization of the metal is responsible for indirect effects on the cell metabolism (Tessier A., Buffle J. et al.; 1994; Campbell P.G.C.; 1995). The transport binding sites (proteinic carriers) possess an extracellular domain for binding the metal, a transmembrane domain and an intracellular or cytoplasmic domain (Fig. 3). Sites bound to metal can activate various intracellular enzymes and entire cascades of intracellular reactions and be recycled, synthesized or degraded (Fig. 4).
Figure 4: Levels of complexity of transport binding sites and their location in the cell during metal adsorption and internalization (Lauffenburgar D.A. and Linderman J.J.; 1993).
Metal binding phenomena are influenced by a variety of extrinsic variables that are defined by the experimental system. Primary among these factors are the temperature and medium composition, including the pH and ionic strength. Generally speaking, carrier/solute binding processes are generally exothermic, i.e. ∆H° < 0, although many are driven by positive entropy changes, ∆S° > 0 (Klotz I.M.; 1985). When ∆S° term dominates, there may be only minor variation of equilibrium binding with temperature whereas if the ∆H° term dominates, there will be a strong temperature effect. Interpretation is greatly complicated by the fact that
∆S° and ∆H° vary significantly with temperature, most likely due to changes in three-dimensional conformation of proteinic carriers. Hence, van’t Hoff plots of the log of equilibrium dissociation constant (KD) versus 1/T are rarely linear. In addition, the conditional stability constant for the adsorption decreases as the pH decreases below 7.0 (Kaplan J.; 1985; Lauffenburgar D.A. and Linderman J.J.; 1993), although it is not clear whether this is due to a decrease in ka, an increase in kd, or both.
1.3 - Models used to describe the metal adsorption and internalization
Metal adsorption. In the case of a single homogeneous adsorption site, a Langmuir isotherm can be employed as a simple adsorption model (Eq. 5) (Rhee G.Y. and Thompson P.A.; 1992; Tessier A., Buffle J. et al.; 1994; Kiefer E., Sigg L. et al.; 1997):
[ ]
[ ]
+ − + + Γ = Γ z ads z eq M M K M 1 max (5)where ΓMeq and Γmax are the amount and maximum amount of metal ion adsorbed to the binding sites at equilibrium and Kads is the equilibrium constant for the adsorption (Eq. 6).
[
]
[ ][ ]
∆− = − = + RTG M R R M K ads z cell cell ads exp (6)where ∆Gads is the change in the Gibbs free energy of the system that occurs during the adsorption reaction, which is equal to the difference between the change in the enthalpy of the system and the change in the product of the temperature times the entropy of the system. In the case when [Mz+] << 1 / Kads, the Langmuir equation can be simplified to Equation 7:
[ ]
+≅
Γeq H z
M K M (7)
where KH is the Henry constant (Eq. 8):
ads
H K
K =Γmax (8)
There are two important conditions for the validity of the Langmuir isotherm: equilibrium must exist up to the formation of the monolayer (with 1:1 stoichiometry) and ∆Gads must be
independent of site occupancy, implying that all sites should have an equal activity. In reality, the tendency to form surface complexes decreases with increased metal loading of the surface because the metal ions bind first to the surface groups with highest affinity and subsequently to groups with lower affinities (Xue H.B., Stumm W. et al.; 1988; Buffle J., Altmann R.S. et al.; 1990). Thus, other types of isotherms are often better able to describe the adsorption phenomena. For instance, the Freundlich isotherm represents a monolayer adsorption on a heterogeneous surface (Eq. 9):
ΓMeq = m [L]n (9)
where m and n are fitting constants, which do not necessarily have any physical meaning. Adsorption models with additional interactions between the adsorbed species lead to more complex isotherms (e.g. Frumkin-Fowler-Guggenheim isotherm) (Stumm W. and Morgan J.J.; 1996), however, this type of binding will not be considered here.
Metal adsorption by the cell is generally a rapid process that precedes metal internalization. The kinetics of adsorption are determined mainly by the concentration of the metal active form (Mz+ or ML) and by the concentration and affinity of binding sites on the cell surface. The dependence of metal adsorption to the cell wall with time, Г(t), can be given by Equation 10 (van Leeuwen H.P.; 1992): τ τ τ t t t t eq + − = + = Γ Γ 1 1 1 1 ) ( (10)
where τ is the time that it takes for the metal to diffuse through the diffusion layer and the cell wall prior to adsorption (Eq. 11).
Cd H D R K 0 = τ (11)
It should be noted that the relaxation time increases with microorganism size and decreases
with mobility.
Metal transport. Metal internalization generally is relatively slower than metal adsorption, and hence considered to be rate-determining with respect to the overall metal uptake process (Mason A.Z. and Jenkins K.D.; 1995). Under steady-state conditions (local equilibrium between metal species in the bulk solution and those at the cell surface), the flux (rate) of metal uptake can be described by the Michaelis-Menten hyperbolic rate law (that was initially developed for enzyme kinetics and nutrient uptake, Eq. 12) (Pasciak W.J. and Gavis J.; 1974):
[ ]
[ ]
+ + + = z M z M K M J Jint max (12)where Jmax (Jmax = kint {Rcell}tot) is the maximum uptake rate achieved when all of the transport sites, {Rcell}tot, are bound by metal and KM is the half-saturation constant equal to the available metal concentration at which half of the sites are complexed (KM = {kd + kint} / ka) (Morel F.M.M.; 1986; Sunda W.G. and Huntsman S.A.; 1992; Sunda W.G. and Huntsman S.A.;
1998). Under steady-state conditions, the half-saturation constant is inversely related to the affinity of the uptake sites for a given metal. It is possible to distinguish between two extreme cases of steady-state conditions:
(i) When kd >> kint (KM = kd / ka), the uptake rate is slow as compared to the establishment of all other complex formation equilibria and uptake is controlled by the (thermodynamic) equilibrium in solution, since the flux of metal ions into the cell is proportional to the product of kint and {M-Rcell} (Morel F.M.M. and Hering J.G.; 1993). Therefore, uptake is rate-limiting
in the case of a small kint and a fast mass transport. A large value of kd implies weak binding
of the metal to Rcell since kd = ka / KM (Sunda W.G. and Huntsman S.A.; 1998).
(ii) When kint >> kd (KM = kint / ka), the uptake rate may be controlled by the rate of formation of the surface complexes, M-Rcell, and by the dissociation of complexes ML in solution (kinetic control) (Hudson R.J.M.; 1998) or other important processes such as mass transfer (i.e., diffusive flux). The kinetically controlled situation is favored at low metal concentrations because the (few) metal ions arriving at the cell surface will readily find a free transport channel and thus be incorporated into the cell.
Jmax may vary depending on the prior exposure of an algal cell to a given metal ion or its starvation with respect to the metal (Price N.M., Ahner B.A. et al.; 1994). When the concentration of metal is much higher than the Michaelis-Menten constant, the sites may become saturated and the uptake flux becomes independent of [Mz+] (Jint = Jmax). Nonetheless, in natural waters, where the concentration of heavy metals is generally much lower than KM, most of the sites will be available for metal binding and thus the uptake rate should be proportional to the concentration of the free metal (Jint = Jmax [Mz+] / KM), the basis of the FIAM (Morel F.M.M. and Hering J.G.; 1993). If internalization is faster than the complex formation reaction of Mz+ with Rcell, the FIAM cannot be valid. Also, when the diffusion of the metal to the surface is rate-determining, the above proportionality is not assured, since {M-Rcell} is practically zero whatever the free-metal concentration in the solution (Hudson R.J.M. and Morel F.M.M.; 1993).
A summary of the key assumptions of the steady-state uptake models (i.e. FIAM, BLM) are (Campbell P.G.C.; 1995; Wilkinson K.J. and Buffle J.; 2004):
- metal transport toward the cell surface and the surface complexation reactions occur faster than metal internalization (steady-state)
- plasma membrane is the primary site for metal interaction - a single 1:1 binding site is involved during metal transport
- the transport sites have an homogeneous distribution of charges and they undergo no significant modification during the experiment
- the transport sites does not posses regulatory sites
1.4 - Factors influencing metal uptake
Competition. Since metal uptake depends on the transport sites on the surface of the microorganism, theoretically, a second metal could act antagonistically (compete), synergistically (reinforce), additively (superimpose), or remain without any effect relative to the adsorption and uptake of the first metal by a given alga and to the physiological and morphological changes produced by the first metal in a given alga (Visviki I. and Rachlin J.W.; 1994). Competition can occur because the metal coordination sites in microorganisms are never entirely specific for just a single metal and because the competing metals have similar ionic radius i.e., coordination geometries. The competition may concern nutrient metal transport sites, active sites of metalloproteins, or intracellular feedback control sites such as those regulating the number or activity of specific membrane transport proteins (Sunda W.G. and Huntsman S.A.; 1998). By modifying different simplifying assumptions of FIAM, it is possible to predict the biological response (i.e., Jint) of a metal, M, in the presence of a second metal, C, when both metals compete antagonistically for the same transport site (Eq. 13).
1 ] [C ] [M ] [M n z max int= + + − + − + − + Rcell C Rcell M Rcell M z K K K J J (13)
where [Cn+] is the concentration of a competing metal or proton, KM-Rcell and KC-Rcell are values of the affinity constants for the interaction of the metal of interest and a competing metal or proton and Jmax is the maximal uptake flux of the metal of interest.
pH. The acidity of aquatic environments is also a very important abiotic factor affecting metal uptake, growth, physiology and reproduction of aquatic organisms. Low pH can alter nutrient uptake (Gensemer R.W., Smith R.E.H. et al.; 1993), facilitate the toxic action of aquatic
pollutants (Sunda W.G. and Guillard R.R.L.; 1976; Anderson M.A., Morel F.M.M. et al.; 1978; Rachlin J.W. and Grosso A.; 1991) and modify the composition and richness of algal communities, resulting in local extinction of sensitive species (Turner L.J., Howell E.T. et al.; 1991; Anderson N.J., Blomqvist P. et al.; 1997). Changes in environmental pH can influence the uptake of metals in at least two ways: (i) by affecting the metal speciation and (ii) by its effect on the biological surface uptake sites (Campbell P.G.C. and Stokes P.M.; 1985).
1.5 – The case of cadmium and C. reinhardtii
Cadmium is ubiquitous in our environment. Thanks to its unique chemical and physical properties, Cd is widely used in alloys, pigments, stabilisers, coatings and, accounting for almost 70% of its use, in rechargeable nickel-cadmium batteries. Cd is regarded as one of the most toxic trace elements in the environment because of its easy uptake by plants, its tendency to accumulate in crops in the food chain and its persistent nature once in the environment (Dudka S. and Adriano D.C.; 1997). Nearly 60% of the total input of Cd in air and 30% in water comes from smelting and mining (Nriagu J.O. and Pacyna J.M.; 1988). In fact, for 1000 kg of mined zinc, 3 kg of Cd are produced (Ohnesorge F.K. and Wilhelm M.; 1991). Fortunately, Cd emissions to the environment have been decreasing significantly since 1960's. This has resulted in decreasing levels of cadmium in air, water and food. The potential risks to human health have been extensively studied and are now well controlled. Indeed, the current daily Cd intake of the general population is at the lower end of the range 10-25 µg day-1, while WHO has set the provisional tolerable daily intake at 60-70 µg day-1 (WHO;
1992).
1.5.1 - Levels of Cd in waters
Cd is a natural, usually minor constituent of surface and groundwater. Levels from 9 x 10-11 M to 3.6 x 10⁻⁷ M have been quoted in the literature depending on specific location and whether or not total cadmium or dissolved cadmium is measured (Elinder C.-G.; 1985; WHO; 1992; OECD; 1994). Buffle (Buffle J.; 1988) reported a range of 10-13 M to 4 10-10 M for total cadmium in freshwaters, with an average of 4 10-12 M. Rivers containing excess Cd can contaminate surrounding land, either through irrigation for agricultural purposes, dumping of dredged sediments or flooding. It has also been demonstrated that rivers can transport cadmium for considerable distances, up to 50 km, from the source (WHO; 1992). For river
waters, dissolved Cd concentrations of 8.8 x 10⁻¹² M to 1.2 x 10⁻¹⁰ M (Shiller A.M. and Boyle E.A.; 1987) have been reported. Nonetheless, studies of cadmium contamination in major river systems over the past twenty to thirty years have conclusively demonstrated that cadmium levels in these rivers have decreased significantly since the 1960s and 1970s (Elgersma F., Anderberg B.S. et al.; 1992; Van Assche F.J. and Ciarletta P.; 1992; Cook M.E. and Morrow H.; 1995; Mukunoki J. and Fujimoto K.; 1996). For example, studies on the Rhine River Basin from 1973 through 1987 indicated that the point source cadmium discharges to the Rhine River decreased from 130 to 11 metric tonnes (mt) per year over that 14-year time span, a reduction of over 90% (Elgersma F., Anderberg B.S. et al.; 1992). Similarly, data on total cadmium and dissolved cadmium at the Dutch/German border over the period from 1971 to 1987 have shown comparable reductions (van Urk G. and Marquenie J.M.; 1989).
Cadmium emissions to water arise, in decreasing order of importance, from phosphate fertilisers, non-ferrous metals production, and the iron and steel industry (Van Assche F.J. and Ciarletta P.; 1992; OECD; 1994). The average Cd content in the world's oceans has variously been reported as low as < 4.5 x 10⁻¹¹ M (WHO; 1992; WHO; 1992) and 4.5 x 10⁻¹¹ - 1.8 x 10
-10 M (Jensen A. and Bro-Rasmussen F.; 1992; WHO; 1992; OECD; 1994) to as high as 10-9
M (Cook M.E. and Morrow H.; 1995) and 9 x 10-11 to 9 x 10⁻¹⁰ M (Korte F.; 1983; Elinder C.-G.; 1985). Higher levels have been noted around certain coastal areas (Elinder C.-C.-G.; 1985) and the vertical distribution of dissolved cadmium can be characterized by a surface depletion and deep-water enrichment (Boyle E.A., Scalter F. et al.; 1976; OECD; 1994). This distribution is assumed to result from the internalization of Cd by phytoplankton in surface waters and its transport to depth, incorporation into biological debris, and subsequent release.
Cadmium may also enter aquatic systems through weathering and erosion of soils and bedrock, atmospheric deposition direct discharge from industrial operations, leakage from landfalls and contaminated sites and the dispersive use of sludge and fertilisers in agriculture. Much of the cadmium entering fresh waters from industrial sources may be rapidly adsorbed by particulate matter, and thus sediment may be a significant sink for cadmium emitted to the aquatic environment (WHO; 1992). Indeed, Cd levels of up to 4.46 10-3 mol kg-1 have been reported in river and lake sediments (Korte F.; 1983). These quantities are an important reserve of potential contamination by redissolution. Some data shows that recent sediments in lakes and streams contain from 1.8 x 10⁻³ to 8 x 10⁻³ mol kg-1 in contrast to the levels of
generally less than 8.9 x 10⁻⁴ mol kg-1 found in freshwater sediments (Cook M.E. and Morrow H.; 1995). Partitioning of cadmium between the adsorbed state and dissolved state is therefore an important factor as to whether the Cd is able to enter the food chain and affect human health.
1.5.2 – Metal adsorption
C. reinhardtii cell wall. The cell wall of C. reinhardtii is a seven-layered structure with three conspicuous layers, W2, W4 and W6 (separated by spaces W3 and W5) composed mainly of fibers and glycoproteins (Roberts K., Gurney-Smith M. et al.; 1972; Roberts K.; 1974; Goodenough U.W., Gebhart B. et al.; 1986). The whole wall is approximately 320 nm wide (Davis R.D. and Plaskitt A.; 1971). The outer cell-wall layers are crystalline and can be solubilized in chaotropic agents, e.g. NaClO4 and LiCl solutions, while the inner wall layer
has been found to be amorphous and insoluble (Voigt J.; 1985; Voigt J.; 1988). All cell layers are very similar with respect to the amino acid and sugar composition. The cell wall of Chlamydomonas does not contain cellulose but consists mainly of hydroxyproline-rich glycoproteins (HRGP) of high molar mass that have a strong binding affinity for metal ions (Crist R.H., Martin J.R. et al.; 1994). In fact, the HRGP of the outer-wall are not covalently cross-linked (crystalline arrays), while those of the inner-wall are covalently cross-linked as in higher plants. Moreover, a HRGP subgroup, called chimeric extensions, has both fibrous and globular domains (Kilz S., Waffenschmidt S. et al.; 2000). It is suspected that the former anchor the protein to the cell wall, while the later mediate the sugar- binding activity. Sugar part (up to 10 residues) can be linear (Fig. 5b) or branched (Fig. 5c). Arabinose, galactose and mannose are the major sugar components (Catt J.W., Hills G.J. et al.; 1976; Roberts K.; 1979).
Figure 5: Hydroxyproline-bond with sugar side chains. Relative abundance in the GP1, which is a glycoprotein found in the W6 layer of the cell wall of C. reinhardtii: a) 22.8%, b) 7.9% and c) 0.9% (Ferris P.J., Woessner J.P. et al.; 2001).
Potentiometric titrations of live C. reinhardtii cells have indicated two types of protonatable functional groups in the cell wall with average pKa values of 4.9 and 9.1 (I = 10-2 M) (Kiefer E., Sigg L. et al.; 1997), likely corresponding to carboxylic and amino groups. Adhiya et al. (Adhiya J., Cai X. et al.; 2002) found similar pKa values of 4.7±0.5 and 9.6±0.3 at I = 10-2 M and 4.7±1.1 and 9.3±0.3 at I = 10-1 M (KCl) when performing potentiometric titrations on
lyophilized cells. The high ionic strengths appear to lower the effective pKa values by screening the surface charge so as to reduce the interactions among functional groups thereby weakening the bonds between the surface sites and H+. Maximal proton binding capacities were 9.1 x 10⁻⁴ mol g-1 algae (dry wt.) (Kiefer E., Sigg L. et al.; 1997).
Adsorption. The adsorption of heavy metals is affected by the nature (chemical composition and structure) of the cell wall. For example Cd adsorbed varied greatly for algal species (arranged in decreasing order of Cd per unit algal surface): C. vulgaris > C. reinhardtii > C pyrenoidosa (Khoshmanesh A., Lawson F. et al.; 1997). This suggests that C. vulgaris has a larger number of surface sites and/or a higher affinity for Cd than the other species tested. Adhiya et al. (Adhiya J., Cai X. et al.; 2002) demonstrated that the conditional stability constant of Cd to the cell wall binding sites (i.e., mere adsorption sites) of C. reinhardtii was 102.2 (pH 7 and I = 10-1 M), across the concentration range of 1 x 10⁻⁴ to 5 x 10⁻³ M Cd (Fig. 6) with a one-site model providing a good fit to the sorption data.
Figure 6: One-site Gaussian distribution model for Cd sorption, SCd, by C. reinhardtii biomass at pH 7.0, in 0.1
M KCl.
In fact these Cd concentrations are not environmentally relevant conditions and the low value of the stability constant of Cd with the cell wall binding sites was probably due to the high ionic strength and high [Cd].
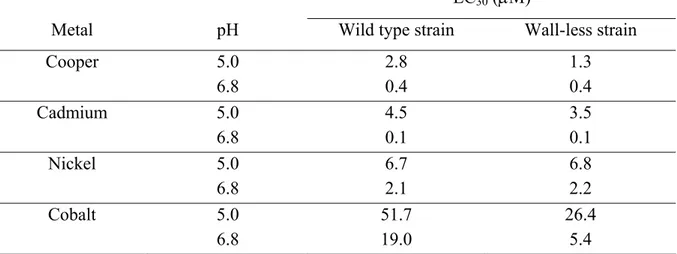
The role of the cell wall in the accumulation of different heavy metals has been studied by several authors by comparison between a wild-type strain of the algae and a wall-less mutant that continuously disassembles the cell wall and releases it into the bulk media (Davis R.D. and Plaskitt A.; 1971; Goodenough U.W. and Heuser J.E.; 1985; Voigt J., Hinkelmann B. et al.; 1997). For example, adsorbed Cd by the walled strain was nearly 2x higher than that of the cell wall-less mutant (Macfie S.M. and Welbourn P.M.; 2000) (Table 1), suggesting that the number of transport sites is higher than the total number of adsorption sites. On the other hand, the results of adsorbed Cu suggest that the number of transport is nearly equal to the total number of adsorption sites (Table 1).
Table 1: Mean concentrations (± SE) of adsorbed metals of wild-type and wall-less Chlamydomonas reinhardtii
strains at the end of a 24-hour metal uptake experiment in HSM (high-salt medium).
Strain Cd (mg g-1) Cu (mg g-1) Ni (mg g-1) Co (mg g-1) Wild type 3.16 ± 0.38 1.58 ± 0.40 0.21 ± 0.19 0.56 ± 0.42 Cell wall-less 1.49 ± 0.32 2.14 ± 0.56 0.00 ± 0.04 0.04 ± 0.01
The adsorption of Cd and Cu to the wall-less strain was explained by the binding of the metal to the plasma membrane and to cell wall material yet not detached from the membrane surface (Hyams J. and Davies D.R.; 1972). Based on relative affinity for carboxylate groups (Neiboer E. and Richardson D.H.S.; 1980), the metal affinity for the cell wall was predicted to increase in the order: Ni > Co > Cd > Cu. It is interesting to note that this order almost corresponded to the total metal content of the cells (see Table 2 for cellular metal). The similarity might reflect relative binding affinities for sites on the plasma membrane or for chelating molecules inside and/or outside the plasma membrane.
Cd adsorption to lyophilized cells of C. reinhardtii (CC2137) increased in the pH range from 2.0 - 8.0 and remained constant when the pH was increased to 10.0 (Adhiya J., Cai X. et al.; 2002). A similar pH effect was observed as the pH was increased from 2.0 to 4.0 for C. vulgaris exposed to 8.9 x 10⁻⁴ M with an increase in Cd binding capacity from 1.0 x 10⁻⁴ to 5.7 x 10⁻⁴ mol g-1 (Aksu Z.; 2001). In those cases, the effect of pH was due to a higher competition of hydrogen ions for Cd binding sites at low pH. On the other hand, for three different algae (M. aeruginosa, S. quadricauda and A. granulata) exposed to different combinations of heavy metals, no reduction of adsorbed Cd was observed suggesting that
those metals did not compete for the Cd binding (Guanzon N.G., Nakahara H. et al.; 1995). Cd adsorption also increased by 15% when the ionic strength decreased from 5 x 10⁻¹ to 5 x 10⁻³ M (sodium perchlorate was used to adjust the ionic strength) at a fixed pH value (Chen et al., 1997) as a result of the higher effective value of the stability constant. Na+ and K+, as typical “hard” cations found in natural waters are not expected to form coordinate complexes with the negatively charged binding sites of the cell wall of organisms, but rather to be electrostatically attracted by them screening the negative charge (Nederlof M.M., De Wit J.C.M. et al.; 1993). It should be mentioned that high salt concentrations can also cause flocculation of the algal biomass, possibly resulting in diminished availability of reactive sites. On the other hand, Ca2+ and Mg+, which may form specific, coordinate bounds, might have even stronger influence on heavy metal ion binding, since they can not only screen the surface charge but also compete with other metal ions at the surface sites. For exemple, Xue et al. (Xue H.B., Stumm W. et al.; 1988) examined the reduction of Cd adsorption by C. reinhardtii in the presence of Ca2+. One mM of Ca2+ was required to reduce binding at 1 µM Cd2+, implying that the binding of calcium was much weaker than that of cadmium. On the
other hand, since calcium ions are much more abundant in natural waters (seawater, hard freshwater), this particular type of surface competition may be of some environmental importance.
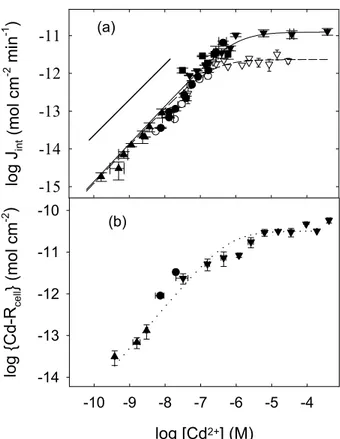
The surface of C. reinhardtii has been well characterized with regard to its interaction with copper. Kiefer et al. (Kiefer E., Sigg L. et al.; 1997) concluded that Cu adsorption to the cell wall of C. reinhardtii followed a Langmuirian isotherm with a maximal Cu(II) binding capacity of 6.2 x 10⁻⁶ mol g-1 at pH = 6.9 (Kiefer E., Sigg L. et al.; 1997). A somewhat lower binding capacity, 1.3 x 10⁻⁶ mol g-1, found by Xue et al. (Xue H. and Sigg L.; 1990) at pH = 6.5, was probably due to a slightly increased proton competition (Fig. 7a). In that study, differential pulse polarography was used to measure labile Cu(II) and to evaluate the complexation of copper by ligands in solution. In the pH range 5.0-6.5 and pCu range 9 to 12, the binding of Cu(II) to algal exudates had a more significant effect on copper speciation then did the binding to the algal surfaces. The authors concluded that the extracellular ligands played an important role in decreasing the concentration of free copper ion, thus mitigating the potential toxic effects on the organisms.
In another study using C. reinhardtii, uranium (U) adsorption to the cell wall was thought to reach local equilibrium within minutes (<15 min) (Fortin C., Dutel L. et al.; 2004). Uranium adsorption was correlated with the free uranyl ion concentration in solution but did not appear to be a saturable process (Fig. 7b). In the both studies, there was no clear evidence from the experimental points that the saturation was reached at the relatively low metal concentrations that were used.
Figure 7: a) Cu(II) adsorption to the surface of Chlamydomonas reinhardtii at pH = 6.5 (Xue H. and Sigg L.; 1990). b) Uranium adsorption after 30 min of exposure at various measured total uranium concentrations (Fortin C., Dutel L. et al.; 2004). Lines represented Langmuir isotherms.
The reaction of metal complexation with the surface binding sites of the algal cell is normally exothermic thus adsorption will generally increase with decreasing temperature. Indeed, Cd adsorption on the dried green alga C. vulgaris increased with decreasing temperature to an observed maximum value at 20°C (5.7 10-4 mol g-1) (Fig. 8) (Aksu Z.; 2001). Moreover, equilibrium between Cd adsorbed and Cd in solution was reached in shorter times at low temperature.
1.5.3 - Metal internalization
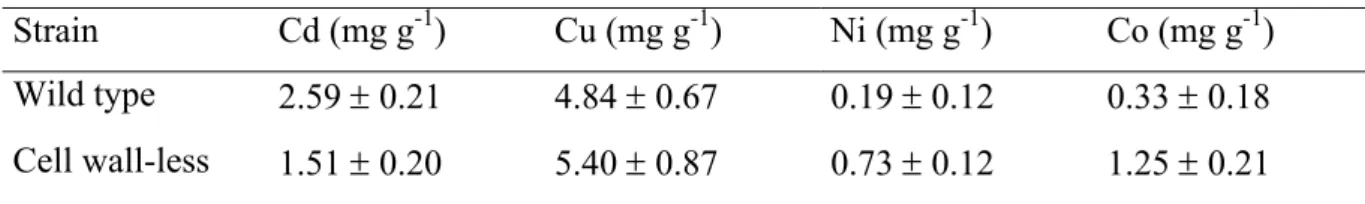
The biological uptake of heavy metals is affected by both the nature of the cell wall and the transport sites. For example, Cd uptake varied greatly among algal species (arranged in decreasing order of Cd per unit dry algal weight): Chlamydomonas reinhardtii > Chlorella regularis > Scenedesmus bijuga >Scenedesmus oblicuus > Chlamydomonas angulasa > Scenedesmus chlorelloides (Sakaguchi T., Tsuji T. et al.; 1979). In another study, C. reinhardtii also showed a higher total and intracellular uptake per unit surface area for Cd as compared to two other algal species: C. vulgaris and C pyrenoidosa (Khoshmanesh A., Lawson F. et al.; 1997). The role of the cell wall on Cd internalization was investigated by using a wild-type strain and a cell wall-less strain of the same species, C. reinhardtii (Macfie S.M. and Welbourn P.M.; 2000). Cd internalized by the wild-type strain was nearly 2 fold higher than that of the cell wall-less mutant with a cellular Cd that was nearly proportional to the adsorbed Cd for both strains (Table 1, 2). Surprisingly, the cell wall-less strain accumulated more Cu, Ni and Co than the wild type strain though no explanation for this observation was given by the authors.
Table 2: Mean concentrations (± SE) of internalized metals of wild-type and wall-less Chlamydomonas
reinhardtii strains at the end of a 24-hour metal uptake experiment in HSM (high-salt media).
Strain Cd (mg g-1) Cu (mg g-1) Ni (mg g-1) Co (mg g-1) Wild type 2.59 ± 0.21 4.84 ± 0.67 0.19 ± 0.12 0.33 ± 0.18 Cell wall-less 1.51 ± 0.20 5.40 ± 0.87 0.73 ± 0.12 1.25 ± 0.21
In another study, Cu internalization fluxes by both Cu-deficient and fully Cu-supplemented cells of C. reinhardtii fitted the Michaelis-Menten hyperbolic equation (Hill K.L., Hassett R. et al.; 1996). The Jmax of Cu-deficient cells (1.0 x 10⁻¹³ mol min-1 cell-1) was 20 fold greater than that for the fully Cu-supplemented cells. On the other hand, Michaelis-Menten half saturation constant was not affected (KM = 2 x 10⁻⁷ M), demonstrating that the same Cu
uptake system was likely operating in both copper replete and copper supplemented cells and that C. reinhardtii likely possesses inducible, high-affinity copper transport sites.
Uranium uptake by C. reinhardtii was correlated with the free uranyl ion concentration as predicted by the free-ion activity model (FIAM) with a value of KM of 5 x 10⁻⁷ M and a Jmax =
![Figure vf.6: a) Flux d’internalisation de Cd par la souche WT exposée aux différent [Cd 2+ ] en présence de Ca:](https://thumb-eu.123doks.com/thumbv2/123doknet/2205664.12981/15.892.121.708.151.374/figure-flux-internalisation-cd-souche-exposee-different-presence.webp)
![Figure vf.8: (a) [Cd] labile (●) et libre (▲) normalisé par Cd dissout dans le milieu d'expérience (densité = 2.5 cm 2 mL -1 )](https://thumb-eu.123doks.com/thumbv2/123doknet/2205664.12981/16.892.137.730.814.1035/figure-labile-libre-normalise-dissout-milieu-experience-densite.webp)