HAL Id: hal-01867409
https://hal.archives-ouvertes.fr/hal-01867409
Submitted on 7 Sep 2018
HAL is a multi-disciplinary open access
archive for the deposit and dissemination of
sci-entific research documents, whether they are
pub-lished or not. The documents may come from
teaching and research institutions in France or
abroad, or from public or private research centers.
L’archive ouverte pluridisciplinaire HAL, est
destinée au dépôt et à la diffusion de documents
scientifiques de niveau recherche, publiés ou non,
émanant des établissements d’enseignement et de
recherche français ou étrangers, des laboratoires
publics ou privés.
Data analysis of a Google data center
Pascale Minet, Eric Renault, Ines Khoufi, Selma Boumerdassi
To cite this version:
Pascale Minet, Eric Renault, Ines Khoufi, Selma Boumerdassi. Data analysis of a Google data center.
CCGRID 2018 : 18th IEEE/ACM International Symposium on Cluster, Cloud and Grid
Comput-ing, May 2018, Washington Dc, United States. pp.342 - 343, �10.1109/CCGRID.2018.00049�.
�hal-01867409�
Data Analysis of a Google Data Center
Pascale Minet
∗Eric Renault
´
†Ines Khoufi
∗and Selma Boumerdassi
‡∗Inria, 2 rue Simone Iff, CS 42112, 75589 Paris Cedex 12, France. Email: [email protected]
† SAMOVAR, Telecom SudParis, CNRS, Universite Paris-Saclay, 91011 Evry, France. Email: [email protected]
‡CNAM/CEDRIC, 292 rue Saint Martin, 75003 Paris, France. Email: [email protected]
Abstract—Data collected from an operational Google data center during 29 days represent a very rich and very useful source of information for understanding the main features of a data center. In this paper, we highlight the strong heterogeneity of jobs. The distribution of job execution duration shows a high disparity, as well as the job waiting time before being scheduled. The resource requests in terms of CPU and memory are also analyzed. The knowledge of all these features is needed to design models of jobs, machines and resource requests that are representative of a real data center.
I. CONTEXT AND MOTIVATION
In High Performance Computing (HPC), on the one hand all machines are assumed to be homogeneous in terms of CPU and memory capacities, and on the other hand, the tasks comprising jobs have similar resource requests. It has been shown in [1] that this homogeneity related to both machines capacities and workloads that has been validated for HPC is no longer valid in data centers. This explains why the publication of data gathered in an operational Google data center during 29 days [2] has raised a large interest among researchers.
For jobs and tasks, researchers want to characterize their submission, their structure and the workload requested. For machines, they study the distribution of the off-periods. They also highlight periodic patterns and tendencies, if any. They detect correlations between memory usage and CPU usage if such correlations exist. More generally, they validate or invalidate some simplifying assumptions usually made when reasoning on models. Such results are needed to make the models more accurate for jobs and tasks as well as for available machines. These models being validated on real data centers are then used for extensive evaluation of placement and scheduling algorithms and more generally for resource allocation (i.e. CPU and memory). These algorithms can then be applied in real data centers.
Another possible use of this data set is to consider it as a learning set in order to predict some feature of the data center like for instance the workload of hosts or the next arrival of jobs.
As a conclusion, it is crucial to have real traces of a Google data center publicly available that are representative of the functioning of real data centers. Our goal in this paper is to analyze the collected data and to draw pertinent conclusions about jobs and tasks as well as resource usage. In a further step, these results will be integrated in models used in a general framework designed for a high performance resource allocation in a data center.
II. ANALYSIS OF JOBS AND TASKS
The J obs events table and the T ask events table describe the events related to a job and a task, respectively. These events are submit, schedule, evict, fail, finish, kill, update pending and update running. The T asks events table also contains the scheduling class, the priority, the resource request in terms of CPU and memory, as well as some placement constraint of each task. This table has a size of 15.4 GBytes.
Before being analyzed, data are cleaned. Any record with missing information is discarded. The outliers are discarded, like for instance the events occurring at time 0 that have been artificially added by the measurement process. To make faster the processing of records, the columns in the different tables that are not analyzed are withdrawn.
From the T ask Event table, we compute the distribution of the number of tasks per job, the CPU request and memory request per job, the job execution time and the job schedule time.
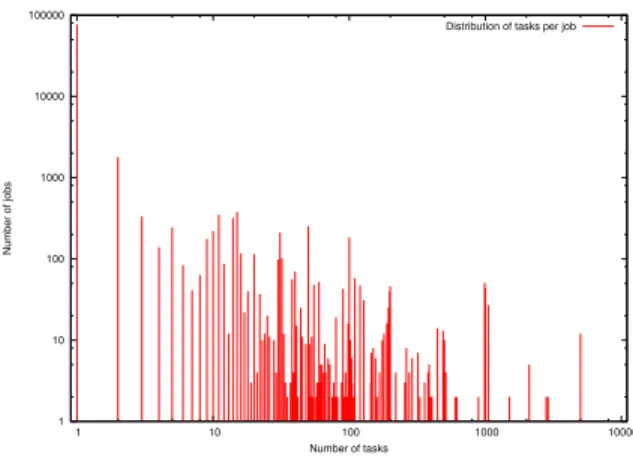
The number of tasks per job is represented in Fig. 1 in a logarithmic scale on both axes. 92.05% of jobs have a single task. 95.75% of jobs have less than 10 tasks, 98.6% of jobs have less than 50 tasks and 99% of tasks have less than 92 tasks. We also notice that 1 job has a number of tasks equal to 10500 and 12 jobs have a number of tasks equal to 5000. The number of tasks per job is frequently a multiple of 10.
1 10 100 1000 10000 100000 1 10 100 1000 10000 Number of jobs Number of tasks
Distribution of tasks per job
Fig. 1. Distribution of the number of tasks per job.
From the Task Event table, we compute the distribution of CPU request and memory request per job that is represented in Fig. 2. We observe that all tasks of a same job request the
same amount of CPU and the same amount of memory. We notice that:
• 1.54% of jobs have a CPU request higher than or equal
to 10%.
• 1.74% of jobs have a memory request higher than or
equal to 10%.
• 0.11% of jobs have a memory request and a CPU request
higher than or equal to 10%.
On Fig. 2, where the x-axis and the y-axis are represented with a log base 2 scale, we notice that lots of CPU and memory requests are ”aligned”. This means that some specific values are preferred over the other. An in-depth analysis shows that most of the ”lines” are powers of 2. In other words , memory requests and CPU requests are often expressed as powers of 2. 9.53674e-07 3.8147e-06 1.52588e-05 6.10352e-05 0.000244141 0.000976562 0.00390625 0.015625 0.0625 0.25 1 0.000976562 0.00390625 0.015625 0.0625 0.25 1 Memory request CPU request
Distribution of CPU and memory request
Fig. 2. Distribution of CPU and memory requests.
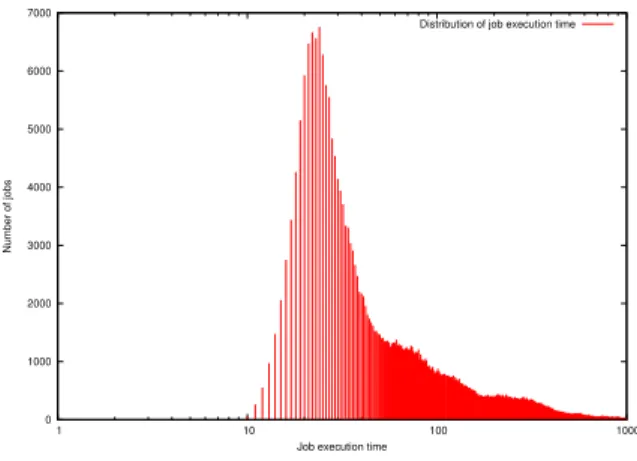
The distribution of the job execution times is illustrated in Fig. 3. 35122 jobs do not finish in the considered 29 days in the dataset. 384362 jobs finish successfully, corresponding to 91.62% of jobs. 4 jobs have an execution duration less than 10 seconds. About 36000 jobs, representing 9% of jobs have an execution duration in the interval [20, 25] seconds. Most jobs, 49%, have an execution duration less than 100 seconds. 90% of jobs have a duration less than 1000 seconds. We observe that the number of jobs with an execution duration equal to 1000 × n, with n a positive integer, is approximately divided by two, each time n is increased by 1.
To explain these large values of job execution durations, we focus on the waiting time of jobs before being scheduled. This time is called job schedule time. The distribution of job schedule times is depicted in Fig. 4. 60% of jobs wait 1 second before being scheduled. 94.25% of jobs wait less than 10 seconds. Surprisingly, there are 50 (0.013%) of jobs that wait more than 1000 seconds. A possible explanation could be that they request specific resources that are not immediately available.
III. CONCLUSION
The data set provided from an operational data center during 29 days contains very interesting information. Data analysis allows us to draw the following conclusions.
0 1000 2000 3000 4000 5000 6000 7000 1 10 100 1000 Number of jobs
Job execution time
Distribution of job execution time
Fig. 3. Distribution of job execution time.
1 10 100 1000 10000 100000 1e+06 1 10 100 1000 10000 100000 1e+06 Number of jobs
Job schedule time
Distribution of job schedule time
Fig. 4. Distribution of job schedule times.
• 92.05% of jobs have a single task. 95.75% have less than
10 tasks. But 12 jobs have to 5000 tasks and 114 jobs have around 1000 tasks.
• With regard to resource requests, 0.11% of jobs have a
memory request and a CPU request higher than or equal to 10%.
• 49% of jobs have an execution duration less than 100
seconds.
• 94.25% of jobs wait less than 10 seconds before being
scheduled. However, some of them wait more than 1000 seconds. Such large values could be explained by the existence of placement constraints for the jobs making them harder to place and schedule.
These features should be reflected in the job sets and the models used to evaluate the performances of scheduling place-ment algorithms in data centers.
REFERENCES
[1] C. Reiss, A. Tumanov, G. R. Ganger, R. H. Katz, and M. A. Kozuch, “Heterogeneity and dynamicity of clouds at scale: Google trace analysis,” in ACM Symposium on Cloud Computing (SoCC), San Jose, CA, USA, Oct. 2012. [Online]. Available: http://www.pdl.cmu.edu/PDL-FTP/CloudComputing/googletrace-socc2012.pdf
[2] J. Wilkes, “More Google cluster data,” Google research blog, Nov. 2011, posted at http://googleresearch.blogspot.com/2011/11/more-google-cluster-data.html.