HAL Id: tel-03208444
https://pastel.archives-ouvertes.fr/tel-03208444
Submitted on 26 Apr 2021HAL is a multi-disciplinary open access archive for the deposit and dissemination of sci-entific research documents, whether they are pub-lished or not. The documents may come from teaching and research institutions in France or
L’archive ouverte pluridisciplinaire HAL, est destinée au dépôt et à la diffusion de documents scientifiques de niveau recherche, publiés ou non, émanant des établissements d’enseignement et de recherche français ou étrangers, des laboratoires
To cite this version:
Martin Quinn. Three essays in economics of online advertising. Economics and Finance. Télécom ParisTech, 2018. English. �NNT : 2018ENST0040�. �tel-03208444�
T
H
È
S
E
EDITE - ED 130Doctorat ParisTech
T H È S E
pour obtenir le grade de docteur délivré par
TELECOM ParisTech
Spécialité « Economie »
présentée et soutenue publiquement par
Martin QUINN
le 16 Juillet 2018
Three Essays in
Economics of Online Advertising
Directeur de thèse :Patrick WAELBROECK
Jury
M. Paul BELLEFLAMME,Professeur, CORE, Université Catholique de Louvain Rapporteur
M. David BOUNIE,Professeur, SES, Telecom Paristech Examinateur
Mme Grazia CECERE,Professeure, LITEM, IMT Business School Rapporteur
M. Regis RENAULT,Professeur, THEMA, Université de Cergy-Pontoise Examinateur M. Patrick WAELBROECK,Professeur, SES, Telecom Paristech Directeur de Thèse
L’auteur permet le prêt de cette thèse par Télécom ParisTech à d’autres institutions ou indi-vidus dans un but académique.
L’auteur autorise également Télécom ParisTech à reproduire, intégralement ou en partie, cette thèse par photocopie ou par tout autre moyen à la demande d’institutions ou d’individus dans un but académique
The thesis presents an economics analysis of three new subjects related to the economics of online advertising using both empirical and theoretical methodologies.
Chapter 1introduces the context of the thesis as well as the main results developed in the following chapters.
In Chapter2, the thesis shows through a theoretical model how transparency related to on-line advertising purchase modifies market equilibria. In a context of advertising avoidance, the chapter shows that introducing such technologies can affect welfare in various ways.
Chapter 3 tackles the economic relevance of profiling technologies that allow websites to adapt their advertising level to user’s sensitivity. The chapter builds a theoretical model to draw key implications on how such technologies modify advertising intensity and welfare.
With Chapter4, the thesis highlights how a privacy policy that lets users opt-out from behav-ioral targeting has economic implications on the online advertising market. The chapter presents a new computational methodology that estimates the effect of such opt-outs on prices of ads sold at auctions. The results differ from previous work and show that the impact may strongly depends on website’s characteristics as well as other selling channels attractiveness.
The thesis concludes in Chapter5and points out how key points developed across the chap-ters carry economic significance as they partly explain how prices and demand for advertising spaces are shaped. It also draws attention on how these new subjects stimulate relevant future research for economists.
There is not enough time to aknowledge all the people who helped me during my PhD to the extent they deserve. I hope people will undertand the brevity of this part.
First of all, i would like to express my extreme gratitude to my doctorate advisor Prof. Patrick Waelbroeck for giving me the opportunity to start a research career. I greatly benefited from his guidance during these three years and gained unvaluable insight under his supervision. I also thank him for giving me the freedom to pursue my own research. Secondly, i would like to express my deepest appreciation to Prof. David Bounie for his helpful discussions, valuable sug-gestions and wise advices. Thirdly, I am grateful to Yann Balgobin, Mattias Mano and Antoine Dubus for the hard work and unvaluable brainstormings. Fourthly, I also would like to thank the Chair VPIP for indispensable financial support and its members for the insightful comments and for trusting me to conduct research. Fifthly and foremost, I would like to thank the members of the jury for accepting to review the manuscripts and participate to the defense of this thesis.
I had the chance to pursue my PhD in a great environment, surrounded by an awesome research team and helpful people. To that, i thank the SES department of Telecom Paristech and all the people whose path i may have crossed. I am appreciative of the help from researchers in University Paris Sud. I particularly show my respect to Fabrice Leguel who passed me on his passion for digital economics during my second year of Master at Telecom Paristech. I also thank members of the CESP for their great insights that appeared to be an important part of the thesis developement.
At last but not least, i would like to dedicate this thesis to my family and friends. This is particularly directed to Charlotte, as she has been the co-author of my life for many chapters, and to my parents and brothers who know how much i owe them.
I declare that the thesis has been composed by myself and that it has not been submitted for any other degree or professional qualification. I confirm that the work submitted is my own, except where work which has formed part of jointly-authored publications has been included. My contribution and those of the other authors to this work have been explicitly indicated below. I confirm that appropriate credit has been given within this thesis where reference has been made to the work of others.
The work presented in Chapter2has benefited from the co-authorship of Prof. David Bounie and Valérie Morisson. The work presented in Chapter3is a joint work with Prof. David Bounie and Antoine Dubus. Finally, Chapter4is an interdisciplinary work coauthored with Dr. Vincent Toubiana.
1 Introduction 8
2 The Economics of Online Advertising Viewability 18
2.1 Introduction . . . 18
2.2 Ad Viewability: Definition and Market Insights . . . 22
2.3 Related Literature . . . 26
2.4 A Theoretical Model of Online Ad Viewability . . . 28
2.4.1 Model Setup . . . 28
2.4.2 Equilibria . . . 31
2.5 Welfare Analysis of Ad Viewability . . . 36
2.6 Extensions. . . 38
2.6.1 Competition . . . 38
2.6.2 Ad-viewability and ad-blockers . . . 41
2.7 Conclusion . . . 43
2.8 Appendix . . . 49
3 Targeting Advertising Preferences 60 3.1 Introduction . . . 60
3.2 Description of the Model . . . 63
3.2.1 Online Users . . . 64
3.2.2 Advertisers . . . 65
3.2.3 Platform . . . 66
3.3 Baseline Model Without Profiling Technology . . . 66
3.3.2 Stage 1 . . . 67
3.4 Equilibrium with Profiling Technology . . . 71
3.4.1 Stage 2 . . . 72
3.4.2 Stage 1 . . . 72
3.5 Some considerations about the volume of ads in equilibrium . . . 75
3.6 Winners and Losers of the Profiling Technology . . . 78
3.6.1 Internet user surplus . . . 78
3.6.2 Advertiser surplus . . . 79
3.6.3 Profits of the platform . . . 80
3.6.4 Total welfare . . . 80
3.7 Strategic implications and conclusion . . . 82
3.8 Appendix . . . 86
4 Privacy protection and online advertising market: Opt-out impact on ad prices. 90 4.1 Introduction . . . 90
4.2 Related literature . . . 93
4.3 Methodology . . . 94
4.3.1 Real Time Bidding auctions . . . 94
4.3.2 Recovering ad prices using a computational process. . . 95
4.3.3 Empirical Methodology . . . 98
4.4 Empirical analysis. . . 99
4.4.1 Modeling an opt-out choice . . . 99
4.4.2 Descriptive statistics . . . 100
4.4.3 Econometric analysis . . . 109
4.5 Conclusion and limitation. . . 117
4.6 Appendix . . . 120
5 Conclusion 126 6 Résumé de la thèse 131 6.1 Introduction . . . 131
6.2 Chapitre 1 : Mesure de visibilité publicitaire et marché de la publicité en ligne -une analyse économique . . . 139
6.3 Chapitre 2 : Analyse économique de l’introduction d’une technologie de dis-crimination par la nuisance publicitaire. . . 142
6.4 Chapitre 3 : Impact d’une régulation de la vie privée “opt-out”sur le marché de la publicité en ligne . . . 146
Introduction
Since the seminal work ofStigler(1961), advertising has been considered an important subject of research for economists. The approach developed byStigler(1961) and later byNelson(1974) was among the first to perform an economic analysis of advertising as informative, while adver-tising had been mostly considered as persuasive in the literature. Stigler(1961) considers in his analysis that advertising is an important pillar of information transmission that stimulates more efficiency by informing consumers of the different competitive options on the market. As pointed out byBagwell(2007), a large body of literature has been built upon informative advertising1,
hence providing the basis to understanding the economics of advertising, especially on media markets coordinating the interplay between advertisers and audiences.
However, much of advertising spending is now done on Internet Media. Online advertising revenue has kept growing during the last ten years, establishing at $72B in 2016 according to the
IAB (internet advertising revenue report, 2016). Moreover, Adage, 2017points out that online ad-spending has surpassed TV’s for the first time, rising to number one investment in advertis-ing. Such figures have stimulated a new body of literature on the economic stakes of online advertising. According to Peitz and Reisinger (2015), technological progress has given firms unprecedented opportunities to inform Internet users about their product, using new techniques such as targeting. First, online media better match advertising to contents. A specific example is found in keyword advertising, where advertisers can choose to show their ads next to appropriate keywords. Second, by leveraging personal information of Internet users, online media are able to better match advertising to their preferences. This can be illustrated by retargeting
adver-1Parallel to the development of alternative views. See alsoRenault(2015) for a more complete survey on the
tisingwhere advertisers use past Internet browsing history of consumers to display appropriate ads. Altogether, Goldfarb(2014) argues that advertising in online media exhibits a substantial difference with respect to classical advertising: the cost of targeting is reduced.
Such benefits generate strong investments in the online advertising industry. Indeed, adver-tisers are better able to segment their online audience and at a lower cost compared to traditional media. However, such wealth fosters a state of continuous innovation, which consequently raises questions. We argue in the thesis that these new challenges faced by online advertising mar-kets importantly affect demand and prices for advertising spaces, and therefore radically change market equilibria. To illustrate this argument, the thesis addresses three new economic concerns on the online advertising market. The first one relates to the lack of transparency on online ads quality, and how it bears economic impact on the online advertising market. Secondly, the thesis analyzes how new profiling algorithms used by platforms to adapt the number of ads to each user’s preferences is changing websites behavior. Finally, I develop a new methodology to economically assess the impact of a privacy policy that prevents advertisers from targeting users according to their past online behavior. To an extent, the chapter illustrates how consumer trust can have economic impact on markets.
The thesis contributes to the classical literature on online advertising picturing media mar-kets as two-sided (Rochet and Tirole,2002;Anderson and Gabszewicz, 2006). Platforms (here content providers) attract Internet users (side 1) and show them a quantity of advertising (the ad-vertisers are therefore side 2). Insuring a good coordination of the market creates incentives for both Internet users and advertisers to join the content provider’s website. The recent economic literature on online advertising portrays Internet users perceiving advertising as a nuisance, i.e. exhibiting negative network externalities from the amount of advertising displayed on the web-site (Anderson and Gans,2011;Anderson and Coate,2005). Therefore the more ads there are on a website, the less Internet users will visit it, even if these ads may have informative properties. Hence, a challenge arises for the content provider as he faces a tradeoff between attracting more advertisers while repelling more consumers, or setting a lower number of ads, hence charging fewer advertisers while attracting more consumers.
Each chapter analyzes the economic impact of new challenges the online advertising market faces. They show that such challenges, anchored in the two-sided nature of online advertising markets exhibit sophisticated economic mechanisms. Both theoretical and empirical
methodolo-gies are developed across the thesis to address these new challenges.
The first issue addressed by the thesis is related to the lack of transparency regarding advertis-ing purchases on online media markets. On the one hand, the introduction of complex automated mechanisms of advertising sales known as programmatic has increased efficiency in time and slot management according toEconsultancy Programmatic Branding report, 2015. On the other hand, according toThe Guardian, March 2017andMarketingweek, March 2017a setback from programmatic can be found in market transparency. As advertising sales through automated mechanisms is replacing negotiations between humans, advertisers have had trouble verifying the environment in which ads are delivered. More generally, assessing whether the billions of ads delivered each day are fulfilling advertisers expectations is appearing to be quite a challenge for the market.
Three components of these expectations can be analyzed. First, advertisers have been com-plaining about purchasing advertising that is not seen by any Internet users. Indeed, different analyses such as comScore, 2013 have highlighted that around half of “display” ads2 are not
seen by Internet users because they are not within the boundaries of the active view (i.e. what part of the page the screen is showing). Second, other studies are pointing out that even if ads are viewable, they are mostly seen by robots and not by humans. Report from the Association Of National Advertisers, 2016andAdloox, 2017says that advertising bots fraud induced a loss between $7.2 and $12 billion for the industry in 2016. These issues represent a huge loss for advertisers who have been paying to display advertising, and are currently finding out that they are losing a lot revenue. Finally, brand safety issues have been recently shaking the online adver-tising industry. According to Business insider, December 2017 some advertisers running their campaigns on YouTube recently found that their ads were running next to inappropriate content (such as terrorist or racist videos). Backlash from the markets ensued and forced YouTube to publicly apologize.
These three illustrations underline how uncertainty regarding the context in which advertising spaces are served plays an important role on advertiser’ willingness to pay. Allowing advertisers to monitor online ad quality impact may change market equilibria as it patches the lack of trust between brands and websites. Nevertheless, assessing the overall impact of the introduction of such technology is not easy. On the one hand it may reduce information asymmetry on the
market. On the other hand, such technology may end up degrading Internet users experience when visiting websites, who may consequently prefer to avoid ads.
Chapter2presents a theoretical model that underlines how the impossibility to control on-line ads environment prevents content providers from committing to a certain level of quality (Business Insider, January 2017).
The chapter focuses on the viewability of advertising: are ads viewable by Internet users when served on a specific webpage? This aspect of advertising appears to be very significant for the economics of online ads, especially in the context of branding campaigns where ads are bought per impression (CPM) and not per click3, as advertisers pay ads when “served” (i.e.
displayed) on the website. According toComscore, Q1 2017, the ad viewability has not changed much in 4 years, since only around 50% ads served are effectively seen by Internet users in 2017. The lack of viewability is considered as a big issue since advertisers pay for ads that are not displayed to Internet users.
To overcome this hurdle, the market already developed technologies assessing the viewability level of ads. Using geometrical measures, advertisers recover the location of ads within the webpage and are able to assess how long and how much of their ad has been displayed in the active view. To foster the adoption of such technology, the Internet Advertising Bureau (IAB) and the Media Rating Council (MRC) have introduced viewability standards, counting as “viewed” any standard ad of which at least 50% of the pixels is displayed in the active view of the webpage for at least one second (IAB Measurement guidelines, 2014). 4
The chapter analyzes how introducing such technology may impact industry profits and social welfare. Firstly, Internet users tend to see more ads when technologies allowing advertisers to verify viewability are introduced. In this case, the content providers are not constrained anymore and are able to commit to a specific level of viewability of ads. Moreover, in a context where ad-vertising is perceived as a nuisance by Internet users, the introduction of viewability technology is beneficial for social welfare if the nuisance cost of advertising is not too high. Indeed, in-troducing a viewability technology increases the advertising intensity level, which consequently
3Advertisers distinguish two types of campaigns: branding campaigns whose goal is to have brand coverage
(usually paid to be displayed), and performance campaigns whose goal is to transform into online purchase (usually paid once consumers have clicked the ad).
4For non-standard banners, viewability measurement criteria may change. For example advertising videos are
counted as viewed when at least 50% of the pixels has been displayed in the active view of the webpage for at least two seconds.
reduces consumer surplus.
Secondly, introducing viewability technologies may create incentives for Internet users to avoid ads using for example ad-blockers. As introducing such technologies (weakly) increases the number of ads Internet users see when visiting a website, they are more likely to use an ad-blocker as the advertising nuisance is higher.5 The chapter shows that introducing such
tech-nologies reduces uncertainty on the market by improving transparency on advertising quality, but puts websites under pressure. On the one hand, publishers’ efficiency is now monitored by advertisers during campaigns, which induces them to increase the number of ads to show to In-ternet users. On the other hand, displaying more ads may create incentives for InIn-ternet users to avoid ads using ad-blockers. Such practice is highly monitored by the online advertising industry as it damages content providers and advertisers profits, which brings us to the next chapter.
The second concern analyzed in the thesis addresses the impact of advertising nuisance on media markets. According to a WordStream study, only 0.9% of Facebook displayed ads are being clicked on by users. Besides being uninterested in advertising, Internet users simply prefer to avoid them. As Yougov study, 2016 points out, 61% of adults surveyed dislike advertising. Consequently, consumers are massively installing advertising avoidance technologies (AATs) (PageFair, 2016) exhibiting the fact that online advertising is mostly perceived negatively.
Internet users dislike advertising - or at least advertising the way it is practiced by content providers, according to several studies such as Yougov study, 2016 or Hubspot research, July 2016. For this reason, more and more Internet users adopt Advertising Avoidance Technologies (AATs) - ad-blockers - such asAdblock Plus, when browsing online. PageFair, 2016points out that at least 380 million mobile devices and 236 million desktop devices were blocking ads in December 2016, representing 11% of the global Internet population. Moreover, browsers such as
Brave browser, Firefox Focusor the next version of Chrome browser launching in 2018 (which have around 60% market share according to NetMarketShare 2017) have built-in adblockers according toDigiday, April 2016, which increase even more the reach of advertising avoidance. The two-sided nature of ad-financed media markets is questioned as Internet users choose to avoid ads. Indeed, as Internet users avoid ads, there is no profit generated on the advertisers’ side. Consequently, content providers are starting to look for new ways to generate revenue. One of the solutions for websites has been to improve the match between advertising content
and Internet users. Such solution may improve user experience and induce Internet users to stop avoiding ads. For example, it can determine the current interests of the Internet users and display related advertising. In this vein, new technologies provide websites with the capacity to entirely customize experience leveraging users’ personal information. The type and number of content can therefore be tailored to each Internet users visiting the website. Tracking technologies are exploited to capture Internet users’ traces when browsing online. These traces can take different forms: they can be the results of browsing a sport website, watching a comedy video or visiting a brand page on a social media. Using these traces, algorithms understand the preferences of a specific Internet user and to tailor their browsing experience. For example, an algorithm under-standing that a specific Internet user likes golf and is not willing to see an advertising video more than 8 seconds, will adapt the website in order to match the user preferences and insure that he chooses not to avoid advertising.
Such practice may relate to first-degree price discrimination where firms can price their prod-ucts to the valuation of each user. In this situation, firms can show the maximum amount of ads that a user is willing to tolerate. With these new tools, the browsing experience of an Internet user visiting a website can be completely optimized. But these technologies may have a broader impact as they change the amount of advertising on the market, which is considered as a proxy for product demand and competition by economists. Moreover, the efficiency of the technology uses Internet users online past traces, which may not always be available.
Chapter 3 addresses advertising avoidance issues and analyzes how the use of profiling technologies to counter them engenders economic implications. More precisely, considering that Internet users are heterogeneous with respect to their preferences to advertising, the chapter ana-lyzes the implications of introducing a technology that can capture this sensitivity and customizes advertising accordingly.
The chapter studies through a theoretical model how introducing a profiling technology that can tailor advertising experience to not only the tastes of Internet users, but also their distastes for advertising, may change market equilibria. I consider two types of users: some consumers have a high taste for ads, while a complementary set exhibits a low taste for ads. We assume that low taste users are more easily annoyed with advertising, hence more likely to avoid ads. The profiling technology classifies users according to a technology that produces a signal on their ad sensitivity. The veracity of the signal is considered exogenous and can be imperfect.
Firstly, the chapter shows that a perfectly efficient technology (a technology that makes no mistakes classifying users) is always adopted by the website as it increases his profits on the high taste users (showing them more ads) and attract more low taste ones (less ads are shown to them, fostering users not to install ad-blockers), increasing therefore the total number of ads served on the market. As we find that such technology is always profit increasing for websites, it is not always the case for the total welfare. Indeed, we find that the total welfare always increases with the introduction of a perfectly efficient profiling technology only if the website is facing a high taste audience.
Secondly, the analysis gets more complex when 1) the website uses a perfectly efficient technology and is facing an audience with a low taste for ads and 2) when the website adopts a imperfectly efficient technology (a technology that is efficient enough to be adopted by the website while still making mistakes when classifying users). Moreover, the chapter considers the efficiency of the technology as exogenous, whereas it may be related to investment in statistical method as well as the quality and volume of available user data. We study the latter in the following chapter of the thesis.
The third contribution of the thesis is related to the use of consumers’ personal information to optimize tailored advertising. A 2015 Pew Internet Research study points out that 93% of those surveyed in the report say that being in control of who gets their information is important. Such concerns stress the need to regulate firm tracking practices. On the one hand, data-driven industries such as online advertising have flourished in leveraging users’ data and tracking tech-nologies. On the other hand, such technology may hurt Internet users who want to protect their privacy.
To balance both effects, regulators have considered different privacy policies to take into account privacy concern and business practices. For example, US regulators have implemented an opt-out policy, where advertisers can track users by default but these same users can opt-out from this tracking. Simultaneously, forthcoming European regulation intends to implement an opt-inpolicy. Such regulation prevents advertisers from tracking Internet users, unless an explicit consent is collected.
Privacy policies may have an important economic impact on the online advertising industry, as advertisers integrate user information in their strategy to serve ads. The fact that advertisers may not be able to tailor ads to Internet users past behavior, have two implications. Firstly, it
may lower the probability of click as the match between the ad and the user is of lower quality. Secondly, it may simply foster Internet users to avoid ads. Altogether, an opt-out from behavioral targeting is supposed to decrease the willingness to pay of advertisers.
Chapter4assesses how introducing an opt-out privacy policy impacts ad prices in a context of online advertising auctions. Previous works have already established that an opt-out policy may decrease ad prices and by extent advertisers and websites revenue.
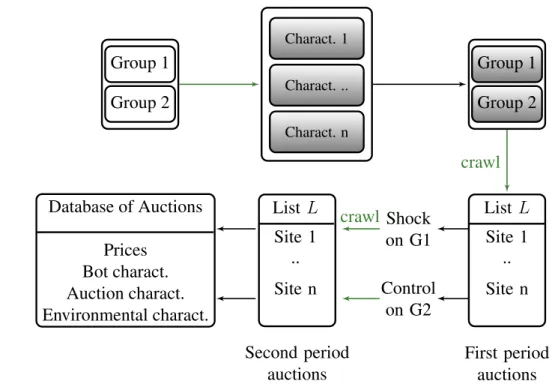
In the chapter, I introduce a new computational methodology that captures ad prices before and after a user opted-out. More precisely, I create two groups of bots6 with exactly the same
characteristics. One group is the control group and the other one is the treatment group. I establish a list of websites where ad prices can be recovered and send the two groups to visit this same list twice in a row. Between the two visits, bots in the treatment group perform an opt-out using theAdChoicewebsite7, while bots in the control group remain inactive. From that
experiment, we are able to create a database with prices of ads seen by bots from the control and the treatment groups, before and after the treatment takes pace. We repeat this experiment for 51 days and perform a difference-in-difference econometric analysis that assesses the impact of an opt-out from behavioral targeting on ad-prices. The paper exhibits three important features.
Firstly, the methodology precisely recovers prices before and after a specific user behavior, which is not possible in previous work from the literature. In this chapter, we test whether an opt-out from behavioral targeting impacts advertising prices. However, such methodology can be easily extended to test the impact of other policies affecting users’ behavior. Secondly, the chapter finds that an opt-out from behavioral targeting weakly increases prices of online advertising sold at auctions. More precisely, we find that once bots have performed an opt-out on theAdChoicewebsite, we see ads sold at a higher price. We contrast this result as we show how such effect may depend on the type of website where the auction takes place. This can be explained by the fact that our bots may be of low value for advertisers. Hence when advertisers don’t have any information, they may choose to bid at a higher price. Thirdly, we find that an opt-out privacy policy significantly reduces the number of ads sold at auction for one user during an experiment (a day in this case). This is important as it highlights a competition between advertising selling mechanisms. This also may question the significance of our results as we
6Bots are computer programs that can behave according to a set of rules given by the creator.
do not account for potential auction that did not take place due to a decrease in advertisers’ participation. We offer comments and a solution in the conclusion of the chapter
Such study may be particularly relevant as the forthcoming European privacy regulation GDPR, as well as the next ePrivacy directive aim at implementing an opt-in privacy policy. Such policy requires for websites and advertisers to obtain clear consent before leveraging users’ data to tailor ads. Future potential application of the methodology developed in the chapter may be applied to understanding economic effect of opt-in policies.
Large investments in advertising technology have driven innovation and market to thrive, solving old problems while creating new issues. The thesis analyzes the economic impact of these new issues rising from new online advertising technologies in Chapters2,3and4, while interrogating future stakes of the market in Chapter5.
Anderson, Simon and Jean Gabszewicz, “Chapter 18 The Media and Advertising: A Tale of Two-Sided Markets,” in Victor A. Ginsburg and David Throsby, eds., Handbook of the Economics of Art and Culture, Vol. 1, Elsevier, 2006, pp. 567 – 614.
Anderson, Simon P. and Joshua S. Gans, “Platform Siphoning: Ad-Avoidance and Media Content,” American Economic Journal: Microeconomics, November 2011, 3 (4), 1–34.
and Stephen Coate, “Market Provision of Broadcasting: A Welfare Analysis,” The Review of Eco-nomic Studies, 2005, 72 (4), 947–972.
Bagwell, Kyle, in Mark Armstrong and Robert Porter, eds., The Economic Analysis of Advertising, 1 ed., Vol. 3, Elsevier, 2007, chapter 28, pp. 1701–1844.
Goldfarb, Avi, “What is different about online advertising?,” Review of Industrial Organization, 2014, 44 (2), 115–129.
Nelson, Phillip, “Advertising as Information,” Journal of Political Economy, 1974, 82 (4), 729–754. Peitz, Martin and Markus Reisinger, “Chapter 10 - The Economics of Internet Media,” in Simon P.
Anderson, Joel Waldfogel, and David StrÃ˝umberg, eds., Handbook of Media Economics, Vol. 1 of Handbook of Media Economics, North-Holland, 2015, pp. 445 – 530.
Renault, RÃl’gis, “Chapter 4 - Advertising in Markets,” in Simon P. Anderson, Joel Waldfogel, and David StrÃ˝umberg, eds., Handbook of Media Economics, Vol. 1 of Handbook of Media Economics, North-Holland, 2015, pp. 121 – 204.
Rochet, Jean-Charles and Jean Tirole, “Cooperation among Competitors: Some Economics of Payment Card Associations,” The RAND Journal of Economics, 2002, 33 (4), 549–570.
The Economics of Online Advertising
Viewability
2.1 Introduction
Digital medias are attracting more and more advertising spending. According to eMarketer, the UK became in 2015 the first country in the world where digital media took a 50% share of advertising spending.1 In the US, also according to eMarketer’s forecast, online ad spending
will surpass TV ad spending in 2017 for a total of about $77 billion, driven mostly by mobile that accounts for more than 50 per cent of total online digital spending (eMarketer, Digital Ad Spending to Surpass TV Next Year, 2016).
The rapid development of mobile usage alone does not explain the growth of online adver-tising spending. Programmatic adveradver-tising and the ability to collect data on consumers and ad impressions2 allow advertisers to automate the buying and selling of ads and to achieve an
ef-fective personalized targeting of audiences. They are therefore in a better position with respect to the TV and print media to estimate how successful a particular ad is in driving a purchase decision or in raising brand awareness over time.
However, the promises of online advertising in the case of branding campaigns that rely on serving millions of ads to Internet users are today challenged. Indeed, the promises rest on the assumption that the served ad impressions are viewable by Internet users, i.e. "contained in the viewable space of the browser window, on an in-focus browser tab, based on pre-established
cri-1The US online advertising spending will amount to $77 billion (eMarketer, "UK to Achieve World First as Half
of Media Ad Spend Goes Digital," 2015).
teria such as the percent of ad pixels within the viewable space and the length of time the ad is in the viewable space of the browser" (Internet Advertising Bureau Europe, Viewable Impressions, 2015). Viewable in this context simply means that Internet users have the opportunity to see the ad, regardless of whether they have actually seen it.
This simple assumption is however challenged by companies such as Google, comScore, Nielsen, etc, that daily analyze billions of impressions from campaigns over thousands of pub-lishers: most of served impressions are actually never seen by Internet users. A well-known commented statistic released by comScore in 2013 indicates for example that half of the pub-lishers’ inventory is not seen by Internet users.3 In 2016, as the Section 2.2 of this paper will
show, the proportion of ads being seen by people in most of the countries around the world is still relatively low, between 40% and 50%.4 The most popular social network website Facebook
that attracts the major part of ad investments is also subject to criticisms: "Facebook ads are far less viewable than people [advertisers] were expecting" (Business Insider, December 28, 2016).
Ad viewability became therefore in recent months one of the top priorities on the agenda of advertisers (Wall Street Journal, "It’s How Long Ads Are Viewed That Really Matters", February 4, 2016).5 The concerns are perfectly understandable. In the case of branding campaigns,
adver-tisers pay for ads by the number of impressions that a publisher has served (this trading currency is called "Cost-Per-Mille" (CPM)).6 But as half of ads purchased by advertisers are never seen
by Internet users, they potentially waste half of their budgets every time they pay for display ads. For the specific case of the UK for example, Meetric estimates that advertisers wasted over £600m on non-viewable ads in 2016 (Meetrics, Benchmark, 2017). Consequently, more and
3Different reasons explain why ad impressions are not viewed by Internet users. Firstly, the browsing behavior
encompasses many possibilities to avoid the sight of an ad such as scrolling the page, resizing the window, using an ad blocker, etc. Secondly, publishers may adjust the viewability of ads to preserve user experience. In Section2.2
of this paper, we review some of the main factors that could explain the low level of ad viewability.
4Ad viewability is not a new issue in media but because of the size of online markets, the problem has definitely
grown and becomes a serious threat for the advertising industry. For print media, the likelihood that a reader actually sees an ad on a given page is not precise (except with QR codes). Regarding television, a commercial is supposed to be seen as soon as there is a person in a room with a TV set on. The measure is not perfect (people walking out of the room during commercial breaks, fast-forwarding through recorded ads, etc.), but the opportunity for exposure exist.
5During the last edition of the annualDigital & Social Media Conferencein 2016, the CEO of the US Association
of National Advertisers touched on media’s "Big Four" concerns: ad blocking, ad fraud, media transparency and viewability/measurement.
6Performance-based online campaigns use another well-known metrics which is the Click-Through-Rate, i.e.
the percentage of ad impressions that have led to clicks. In this paper, we only focuses on branding-based online campaigns.
more advertisers demand to pay only for viewable impressions and not for served impressions. A new trading currency is therefore emerging: the viewable CPM (vCPM) that prices ads by the number of impressions that can be viewed by Internet users, instead of just being served.
The adoption of technologies to measure the viewability of ads served by publishers, and subsequently the shift towards a new trading currency, may entail serious changes in the eco-nomics of online advertising. To begin with, publishers need to redesign their websites7 to make
ads more viewable and satisfy advertisers’ requests to remain competitive. A large part of the current inventory with very low viewability could therefore not be sold anymore, or at a lower rate, which should decrease the revenue streams of publishers. But as publishers may have less inventory to sell, some rates might also increase (premium inventory), affecting in turn adver-tisers competition for high ad viewability.8 Furthermore, as websites are redesigned to enlarge
the amount of space for viewable ads to the detriment of editorial contents, the audience could shrink and the price of ads drops accordingly. The economic impact of introducing a viewability technology is therefore split between the loss in user experience and the gain in revenues from online advertising.
The objective of this paper is to analyze how the growing adoption of an ad viewability technology can affect the economics of online advertising. We construct a two-sided market model where a monopoly publisher displays an editorial content to attract Internet users on one side and advertisers on the other side. Inspired fromAnderson and Coate(2005), the publisher is only financed by advertisers to display ads that are perceived by users as a nuisance. We compare two situations. In the first situation, advertisers do not have a technology to measure the viewability of ads on the publisher website. They just anticipate a global level of ad viewability. In the second situation, advertisers have a technology to precisely measure ad viewability.
Firstly, our benchmark model underlines that the use of a technology to measure ad viewa-bility tends to increase the number of viewable ads, and publisher and advertisers’ profits, but in return degrades user experience. Hence, the adoption of ad viewability improves the situation of the advertising industry (publisher and advertisers) to the prejudice of Internet users. Overall, the total welfare can be greater with ad viewability when the content quality offered by the monopoly
7The Guardian is a typical example. The British media website redesigned his website to render more visible ad
placements (The Guardian, Optimising for viewability, 2016).
8According to Quantcast in 2016, inventory with viewability above 75 per cent can be up to two times more
publisher is relatively high and the nuisance cost of ads is not too high. This is even more relevant as the introduction of a viewability technology increases incentives for the publisher to invest in content quality.
Secondly, we extend the benchmark model to ad-blockers. In our set-up, the drop in user experience due to a higher ad viewability can be restored by adopting ad-blockers. In this case, the publisher is constrained by both sides of the market: on the one hand, it must increase the number of viewable ads to satisfy advertisers’ requests, and on the other hand, it needs to lower the number of viewable ads to discourage people from installing ad-blockers. We show that the publisher is more likely to be contrained by ad-blocker when a viewability technology is introduced, as it increases disutility from advertising.
Thirdly, we build a model of “bottleneck competition”, where two publishers compete for users attention on a Hotelling line. Our model shows that in the case of the two publishers being asymetric regarding their viewability capacities (i.e the maximum viewability a publisher can set for an ad), introducing a viewability technology allows to restore competition.
This paper contributes to the economics and management literature on online advertising on two points. Firstly, this paper provides the first comprehensive economic analysis of the thorny issue of ad viewability largely debated in the advertising industry but absent from the academic research. Secondly, our paper enriches the literature on Internet media (Peitz and Reisinger,
2016), and online ad effectiveness (Goldfarb and Tucker, 2011;Manchanda et al., 2006; Lam-brecht and Tucker,2013;Goldfarb and Tucker,2015). In previous contributions, consumers like ads when they are targeted (de Cornière,2016;Johnson,2013), or dislike ads when they are too much intrusive (Ghose and Yang,2009;Agarwal et al.,2011;Rutz and Bucklin,2011;Blake et al.,2015), resulting respectively in a higher or lower demand of Internet users. But as Section2.2
of this paper will show, there are many reasons for which targeted or intrusive ads are never seen by Internet users, regardless of whether they like ads or not. Taking ad viewability into account is therefore crucial as ads that are not or partially seen are still paid by advertisers and do not have any chance to reach consumers and to be effective.
The remainder of the paper is structured as follows. In Section2.2, we first define the concept of ad viewability and provide some market insights. In Section 2.3, we review the academic literature. In Section 2.4we present the setup of the and the results of the benchmark model in
a monopolistic competition. In Section 2.5, we calculate the impact of ad viewability on total welfare. In Section2.6, we extend the model to account for ad-blockers and competition. Section
2.7presents our conclusion.
2.2 Ad Viewability: Definition and Market Insights
Online advertising requires the Internet to deliver marketing messages to promote a brand to consumers, to sign up for membership or to make purchases. To do so, marketers can use many types of ads (or creatives) such as banners, videos, etc., on desktop (personal computer) and mobile environments.
Different participants are involved in online advertising such as the publisher who places ads into his online content, the advertiser, who provides the ads to be displayed on the publisher’s website, and potentially many other intermediaries (ad networks, data management platforms, media agencies, etc.). With the recent development of advertising technologies (adtech), pub-lishers and advertisers manage less and less manually the ads on websites. Ads are served au-tomatically by ad servers. To measure how often impressions are delivered to Internet users, publishers, advertisers and ad servers mostly use tags, a piece of HTML or JavaScript code placed on each creative to provide a complete view of campaign delivery. The tags are usually provided by a viewability vendor.
The mission of a viewability vendor is to measure the number of served and viewed impres-sions. The number of served impressions is just the number of tagged impresimpres-sions. But not all served impressions are necessarily measured by vendors because of network failures and invalid (non-human) traffic issues.9 For example, some ads can be tagged but not correctly delivered or
fraudulently served to spiders and bots to manipulate legitimate ad serving. As a consequence, a second measure named the "number of measured impressions" is important to consider as it cleans up invalid traffic and non-served impressions. Finally, ads can be correctly served and measured but not seen by users for several reasons. For example, the ad can be served below the fold (i.e. outside the viewable browser space) far down at the bottom of a web page. Conse-quently, "a served ad impression can be classified as a viewable impression if the ad is contained
9One of the largest studies was conducted and published in December 2014 by the Association of National
Advertisers (ANA) in the US and an online fraud detection firm, White Ops. According to the numbers, 11% of display and 23% of video impressions were bot-driven.
in the viewable space of the browser window, on an in focus browser tab, based on pre-established criteria such as the percent of ad pixels within the viewable space and the length of time the ad is in the viewable space of the browser" (Media Rating Council (MRC), Viewable Ad Impression Measurement Guidelines (Dekstop), 2014). The rate of ad viewability is therefore the ratio of the number of viewable impressions over the number of measured impressions.
The pre-established criteria mentioned in the quotation above have been formally defined for different ad formats by the MRC in 2014 and 2016. A display ad is considered viewable when 50 per cent of an ad’s pixel are in view on the screen (on an in-focus browser tab on the viewable space of the browser page) for a minimum of one continuous second. This standard is valid for most banners but has been extended for large ad size banners: a viewable impression may be counted if 30 per cent are in view for a minimum of one continuous second. Regarding videos, it is required that 50 per cent of an ad’s pixel are in view on the screen and that two continuous seconds of the video are played. Finally, regarding mobile ads, the MRC has issued its first set of guidelines last April 2016 and recommends to treat smartphone (excluding apps) and desktop ads the same: 50 per cent of an ad’s pixel are in view on the screen for a minimum of one continuous second.10
Since 2012, numerous studies conducted by viewability vendors have measured the viewabil-ity of publishers’ ad inventories. All studies conclude that a significant proportion of delivered ad impressions are never visible to the end user, resulting in relatively low viewability rates. comScore has been the first viewability vendor to conduct such analysis over thousands of cam-paigns spanning a mix of global advertisers who ran their ads across a variety of publisher sites and ad networks from May 2012 through February 2013. The key finding was that 54 per cent of display ads do not have the opportunity to be seen by a consumer (comScore, Viewability Bench-marks Show Many Ads Are Not In-View but Rates Vary by Publisher, 2013). Since this first and well commented statistic, other studies have confirmed this finding even if significant increases have been observed in countries like France more recently: +7.4 points between Q4 2015 and Q1 2016, and +13.1 points in one year (Integral Ad Science report: Q1 2016 International Me-dia Quality Report). In addition, high viewability inventories are relatively rare. Quantcast for
10As indicated, the MRC standards value a one second impression the same as a five second impression. As a
consequence, alternative trading currencies such as the ‘Cost Per Hour’ are being experimented by large publishers such as The Financial Times to value ad exposure time as a key dimension (Sanghvi,2015).
example finds that "there is a very limited supply of very high viewability inventory, with viewa-bility above 80% constitutes just two to three percent of all RTB inventory in Europe(Quantcast, Viewability: What Smart Marketers Need to Know, 2016)." In the specific case of videos, Google conducted in 2015 a study of the video advertising platforms, including Google, DoubleClick, and YouTube (Google, Are Your Video Ads Making an Impression?, 2015). He finds that 54 per cent of the videos are viewable on the web across desktop, mobile and tablets (not including YouTube).
Ad viewability also varies significantly across countries. According to Meetrics, another viewability vendor, the viewability rate for digital display ads in France stood at 65 per cent in Q4 2015, compared with 50 per cent in the UK, the lowest viewability rate than for any other country in Europe tracked by the firm (Meetrics, Viewability Benchmark, 2016). In the case of videos, Google also reports that viewability drastically varies between countries from 86 per cent for Russia for example to 54 per cent for the United States (Google, Are Your Video Ads Making an Impression?, 2015).
The gaps in viewability between countries may be due to several reasons. To begin with, the technologies used by viewability vendors differ in many ways as they do not use the same technologies to control for invalid traffic issues for example. In 2016, the syndicate of internet sales (SRI) as well as the association of media agencies (UDECAM) in France commissioned the CESP to review and compare eight different viewability measurement solutions, namely Adloox, Adledge, comScore, Integral Ad Science, Meetrics, MOAT, and two tools natively implemented in platforms (AppNexus and Google). Based on tests made by four major viewability vendors about ads placed above the fold on well-known websites,11 CESP has reported discrepancies
about the average rate of viewability between the four actors up to 36 percentage points (CESP, Mission visibilité de la publicité digitale, 2016).
Next, the publishers’ strategies about the placement of ads within webpages and websites may considerably affect the viewability of ads. This is one of the first conclusions drawn by comScore early in 2013. Regardless of the publisher type, the reports emphasized that it is important to evaluate the individual publisher or network on its own merits. "The wide viewability range suggests that regardless of the publisher type, there are some members of the sell-side of the
market who are delivering very strong in-view rates and others who are falling short on their intention to deliver valuable ad inventory to advertisers." For example, for premium websites having an average CPM above USD 5.00$ and 100,000 in monthly ad revenue, the viewability ranged between 10 and 80 per cent.
Ads placed at different page depths are therefore central for viewability as ads have different likelihoods of being viewed by users. Traditionally, above the fold (ATF) has been considered as the top location by advertisers because the ad is supposed to be directly viewable in a browser window when the page first loads. But recent studies tend to refute this common belief. Quant-cast, in 2015, shows for example that "ATF is a poor proxy for viewability, with one exchange at only 44% viewability rate on ATF inventory" (Quantcast Report: High Viewability Expectations Can Harm Campaign Performance). Several reasons may explain this result: first, users quickly scroll down to reach their desired destination, and second hyperlinks do not always link to the top of a page. In this respect, the format of the ad may help publishers and advertisers to attract consumers.
Viewability also varies between static banner ads and dynamic rich media. Sizmek Research analyzed in 2016 viewable data from more than 240 billion measured impressions from more than 840,000 ads and 120,000 campaigns served in 74 countries and six continents to more than 22,000 publishers and 43 programmatic partners from January 1 to December 31, 2014 (Sizmek, Viewability Benchmarks, 2016). Sizmek notes that "flash rich media ads were 18% more likely to be seen than standard banners. This was most pronounced in North America, where rich media was 29% more likely to be seen than standard banners." This finding is also confirmed by an Adform study in 2015 that found that "rich media display ads performed especially well in the UK, with such ads on its platform seeing a 71.2 per cent viewability rate. In particular, those ads saw some of the best engagement rates and times compared with other countries covered in the study." Moat analytics finally also confirms that bigger ads are more likely to be seen than smaller ones.
Ad viewability also varies by device. For example, the same report by Sizmek Research shows that mobile is generally more viewable than desktop sizes to the exception of Flash rich media. The gaps are substantial and up to 31 points of percentage for HTML5 standards banners in desktop and mobile environments. This finding is also corroborated by Google about video
ads. The study reports that video ads are significantly more viewable on mobile (83 per cent, excluding apps) and tablet (81 per cent) than on desktop (53 per cent) (Google, Are Your Video Ads Making an Impression?, 2015).
To conclude this section, it is worth noting that the lack of ad viewability is not only a big waste of budgets for advertisers as indicated in Introduction, but also a matter of brand and sales impact. For example, a recent study conducted by comScore, Millward Brown & Kantar World-panel in April 2016 finds evidence that ads in view for longer periods increase both awareness and purchase intent metrics compared to those in view for less time (comScore, Millward Brown & Kantar Worldpanel, 2016, How Delivery and Brand/Sales Effectiveness Can Drive Digital Ad-vertising ROI in a Cross-Media World). Understanding the issue of ad viewability is therefore a key challenge for advertisers, but also for publishers who need to demonstrate the quality of their inventory.
2.3 Related Literature
Very few academic papers have been devoted to the issue of ad viewability even though this topic is of special importance for the advertising industry. To the best of our knowledge, two papers only have been published in computer science and only one in advertising research.
The objective of the two papers in computer science is to better understand and improve ad viewability. For example, Wang et al. (2015) propose a model supposed to better predict the viewability of any given scroll depth for a user-page pair compared with other systems. In particular, they identify two features such as user geo-location and device type that have a significant impact on the maximum scroll depth. Zhang et al.(2015) investigate what percentage of viewable pixels and length of exposure time may encourage users’ ad recall. They find that 75% of the ad’s pixels being shown at least two seconds in the active page insure the ad to be seen by users.
Regarding research in advertising,Flosi et al.(2013) use a 2-million-person panel and census server data (cookie data) provided by comScore in 2013 to understand the extent to which ads are delivered to the right target audience. Several empirical generalizations are proposed from the study findings about cookie-related issues, viewability, geo-targeting, and non-human traffic (fraud). For the authors, viewability is a critical component of campaign validation. Several
findings are commented. Firstly, the authors find that "on average, 30 percent to 37 percent of all served advertising impressions in the United States, Europe, and Canada were never actually viewable by the end user." Secondly, viewability rates vary significantly across sites and cam-paigns and, finally, the prices of ads are not correlated to viewability rates. This last finding may be today surprising but it is worth noting that, at the time of this study, the technologies to measure ad viewability had not yet been adopted by advertisers and publishers.
Despite the lack of research dedicated to ad viewability, online advertising has been largely studied in economics and management science (Anderson and Coate, 2005), especially with the popularity of two-sided markets (Caillaud and Jullien,2001,2003;Rochet and Tirole,2002; An-derson and Gabszewicz, 2006). An excellent survey on the evolution of the online advertising business is provided by Evans (2009). The author describes how online advertising has trans-formed media businesses and allowed pure Internet players to compete with traditional firms. New technologies emerged allowing a better match between advertisers and consumers, trans-forming in turn online advertising into a reliable source of revenue. A more recent contribution byAnderson and Jullien(2016) surveys recent models of advertising in media markets developed around the concept of two-sided markets. Our paper does not directly contribute to the theory of two-sided markets but simply relies on this powerful tool to understand how publishers manage to coordinate the two sides of the market, Internet users and advertisers.
Our paper pertains more precisely to the relatively new literature on the effectiveness of on-line advertising in management and marketing science.12 Manchanda et al. (2006) measure the
impact of banner advertising on purchasing patterns on the Internet. The results show that the number of exposures, the number of websites, and the number of webpages all have a positive effect on repeat purchase probabilities, whereas the number of unique creatives has a negative effect. Goldfarb and Tucker(2011) explore the factors that influence the effectiveness of online advertising. They find that matching an ad to website content and increasing an ad’s obtrusive-ness independently increase purchase intent. However, in combination, these two strategies are ineffective. Lambrecht and Tucker (2013) measure and compare the effectiveness of dynamic retargeting (information from internal browsing data from consumers who previously visited the advertisers’ website) to simple generic brand ads. They find that dynamic retargeting is less
12Ad effectiveness is a great concern for marketers with advances in technologies; see for exampleGhosh and
effective than generic ads. Goldfarb and Tucker(2015) examine how the memorability of ban-ner advertising changed with the introduction of new standard formats. They find evidence that for most ads, ad effectiveness falls as the use of standard formats rises. Finally,Andrews et al.
(2016) investigate how hyper-contextual targeting with physical crowdedness, i.e. the degree of population density per unit area, may affect consumer response to mobile ads. Based on a sample of mobile phone users that mobile operators can target in subway trains, they find that commuters in crowded subway trains are about twice as likely to respond to a mobile offer by making a purchase vis-à-vis those in non-crowded trains.
Our paper particularly contributes to this literature by examining a further dimension of ad effectiveness: ad viewability. Viewability is a crucial component of ad effectiveness as an ad that is not seen or only partially does not have any chance to reach consumers. In brief, the higher the ad viewability, the higher consumer attention and ad recall. In the aforementioned studies, banner ads and other ad formats are supposed to be always viewed by Internet users. This implicit assumption is contradicted by numerous studies documented in Section2.2.
2.4 A Theoretical Model of Online Ad Viewability
2.4.1 Model Setup
We build a model picturing a media market in which Internet users visit a website to consume content and see ads. Our model involves three types of agents: Internet users, advertisers, and a monopoly publisher.
The publisher offers an exogenous editorial content of quality q, and manages its website to attract Internet users on one side and advertisers on the other side. This is therefore a classical two-sided market in which two groups of agents interact through a platform. We assume, for the sake of simplicity, that the publisher is only financed by advertising (and not by subscription)13.
Advertisers pay therefore the publisher to display ads and attract consumers that are interested in their products. Advertisers are concerned about paying for ads that are seen by users and not just served, as non-viewable ads do not promote the visibility of the products company.
A novelty of the model is that ad viewability is a publisher’s decision variable. Indeed, as
reported in Section2.2, the location of ads within webpages and a website considerably affects the viewability of ads, and a publisher, such as the recent case of the Guardian, can design its website so as to increase the viewability of ads (or not).
We analyze two situations. In the first situation, advertisers do not have a technology to measure the viewability of ads on the publisher website. In this case, the publisher cannot commit to a specific level of ad viewability, in the sense that advertisers have no technology to verify the publisher decision. Therefore, they just anticipate a global level of ad viewability. In the second situation, advertisers have a technology to measure ad viewability. Hence, the publisher can commit to a specific level of ad viewability that can be easily verified by advertisers. We can therefore compare the impact of the adoption of a technology to measure ad viewability on the demands and profits of Internet users, the publisher and advertisers.
Before analyzing the two situations, we describe in more details the preferences and objec-tives of Internet users, advertisers and the publisher, as well as the timing of the game.
The publisher.To maximize its profits, the publisher chooses the number of ads a to be displayed on the website but also the level of ad viewability b. We assume a ∈ [0, a], a the highest number of possible ads displayed on the website, and b ∈ [b, b] with 0 ≤ b < b ≤ 1. We assume here that websites are constrained regarding their choices in advertising, as the lenghts of articles or the network capabitilites limit to the number of ads one website can set.
The profit function of the publisher takes the following form:
Π = R(ba)N (ba), (2.1)
where R(ba) is the revenue function for setting a level a of ads with viewability b on the website and N(ba) is the number of Internet users choosing to visit the publisher website when they see the ads. Following Anderson and Gans (2011) and Anderson and Jullien (2016), we state that R(ba) = r(ba)ba, where r(ab)b denotes the willingness-to-pay of the athadvertiser for
a number a of ads with viewability level b, and assume that the corresponding marginal revenue r(ba) is decreasing in ba in standard fashion. Therefore, the willingness-to-pay of advertisers is concave in the level of ad viewability b. Indeed, advertisers may want to pay for viewable ads until a certain point where it would strengthen too much the competition for attention.
As discussed in Section 2.2, without viewability technology, advertisers have no idea about the level of ad viewability. In this case, we assume that all advertisers have rational expectations about ad viewability on the publisher website. Hence, we denote by be the estimated level of ad
viewability, with b ≤ be ≤ b. However, we do assume that Internet users can always observe the
true level of viewability b. We develop on this assumption later.
Considering the different cases, the profit functions of the publisher with and without viewa-bility technology are:
Π =
R(bea)N (ba) without viewability technology
R(ba)N (ba) with viewability technology.
(2.2)
Internet users. Internet users choose to visit (or not) the publisher website. They are uniformly distributed over a unit length with respect to their preferences θ for the editorial content of the publisher. Internet users earn a utility of 0 from not visiting the website. If they choose to visit the website, their utility can be defined as follows:
U = θq − γκ(ba), (2.3)
with q the quality of editorial content and γκ(ab) the nuisance cost of ads. We first assume that the utility of Internet users increases with the quality of editorial content q, and second that users perceive ads as a nuisance, driving the nuisance parameter to be positive γ > 0, and the advertising perception function κ(ab) to be convex in ba (κ′(ba) > 0 and κ′′(ba) ≥ 0 for any
ba >0).14
No matter the situation (with or without viewability technology), we assume that Internet users can always observe the true level of viewability b. This is due to the fact that Internet users actually visit websites while advertisers buy campaigns without being able to visit all website pages.
Timing. The timing of the game is in two stages:
1. The monopoly publisher designs its website and chooses the level of ad viewability as well as the number of ads to be displayed on its website.
14We use a standard advertising disutility paradigm adopted in papers such as (Zhang and Sarvary,2015;Dukes
2. If advertisers have a viewability technology, they pay the website according to the viewa-bility level of ads b. If they have no technology, they pay the website according to their estimation of the viewability level be.15
3. Internet users choose to visit or not the publisher website(s) and see ads.
Step 1 and 2 are solved together. In the following, we look for the subgame perfect equilib-rium, and solve the game by backward induction.
2.4.2 Equilibria
The publisher displays ads and offers an online content to attract advertisers and Internet users. Stage 3
At stage 3, Internet users visit (or not) the publisher website. No matter k ∈ {v, nv}, the demand of Internet users is:
N(ba) = 1 −γκ(ba)
q (2.4)
As κ(ba) increases in ba, eq. (2.4) shows that the number of Internet users visiting the publisher website decreases with the nuisance cost of ads γκ(ba).
Stage 1 and 2
The publisher maximizes its profits by choosing its advertising intensity. We first focus on the case without viewability. As advertisers cannot observe the true level of viewability and expect a level of viewability be, we solve the game using Bayesian perfect Nash equilibrium. We denote
the solution of the such game with the subscript nv.
Inserting Eq. (2.4) into Eq. (2.2), the publisher profit function at the equilibrium of stage 1 without viewability technology is Π = R(bea)(1 − γκ(ba)q ). As the publisher is constrained on
the level of advertising a (a ∈ [0, a]) and the level of viewability b (b ≤ b ≤ b), he solves the following program:
15In the advertising industry, advertisers can ask for compensation when they measure a lower advertising
viewa-bility that previously declared by the publisher when the ad is sold. Hence they pay advertising before ads are displayed to users.
max b,a Π = R(bea)(1 − γκ(ba) q ), subject to 0 ≤ a ≤ a and b ≤ b ≤ b (2.5) Imposing rational expectation for advertisers and solving the program of Eq.2.5gives us the following solution (b∗ nv, a∗nv) such that: (b∗nv, a∗nv) = (b,ea) if γ > qR′a(ab) κ′ a(ab)R(ab)+κ(ab)R′a(ab), (b, a) if γ ≤ qR′a(ab) κ′ a(ab)R(ab)+κ(ab)R′a(ab) 16 (2.6) where fanvsatisfies17: R′a(beea) R(beea) = γκ ′ a(bea) q− γκ(bea) 18. (2.7)
Advertisers pay the website where ads are displayed. If there is a viewability technology, advertisers always pay the price indexed on the viewability level of ads, as they can verify it using the technology. If no viewability technology is available, advertisers always pay the price of an ad by considering its estimated level of viewability be and not bnv, as they have no means
of knowing the actual level of ad viewability. In this scenario, the publisher cannot commit to a specific level of viewability technology. Hence, he has a dominating strategy that would be to set b∗
nv = b. We find therefore that the publisher sets the level of ad viewability at its minimum.
Proposition 1:When there is no viewability technology, the publisher chooses the lowest level of viewability b∗
nv = b while advertisers expect the lowest level of viewability be = b.
Proof. Since a higher level of ad viewability decreases the demand of users, and since advertisers have no possibilities to determine the actual level of ad viewability, it is optimal for the publisher
16Proof can be found inAppendix.
17This can be written using elasticities such that ǫ
R(a∗nv, be) = ǫN(a∗nv, b). Following Anderson and Gans
(2011), we define ǫR= ∂R∂aRa as the per consumer elasticity of advertising revenue and ǫN = ∂N∂a Na as the elasticity
to advertising related to consumer demand. The optimal local advertising intensity is characterized by the equality between advertisers and Internet users elasticities (respectively ǫR and ǫN) with respect to a. We find that for a
high content quality q or a low level of advertising nuisance γκ(.), the optimal level of advertisers may be above a, driving the publisher to set a∗= a. Hence, the maximum optimal advertising intensity when there is no viewability
technology is ba. 18κ′ a= ∂κ ∂a and R′a= ∂R ∂a.
to set the viewability level at its minimum. Such lack of commitment power also impacts ad-vertisers expectations. as we assume rational expectations, they anticipate that the dominating strategy of the publisher would be to set b∗
nv = b which drives their expectation to be be = b.
Proposition1states that the publisher sets the level of ad viewability at its minimum. Such situation underlines how the lack of comitment power on the publisher side degrades the viewa-bility level of ads on a website. Applying the same reasoning, the publisher maximizes its profit with respect to b and a under the constraint 0 < A ≤ ab. However, we can simplify this two variables maximization problem to a one variable in considering A = ba. Hence, we have the folowing program: max A Π = R(A)(1 − γκ(A) q ), subject to 0 ≤ A ≤ ab (2.8)
Solving the program of Eq. 2.8gives us the optimal advertising level set by the publisher eA such that: R′A( eA) R( eA) = γκ′A( eA) q− γκ( eA), 19 (2.9)
In this case, the level of viewable ads A∗
v chosen by the publisher is uniquely defined and
bounded by 0 and ba.
A∗v = e Aif γ > qR′A(ba) κ′ A(ba)R(ba)+κ(ba)R′A(ba) , abif γ < qR′A(ba) κ′ A(ba)R(ba)+κ(ba)R′A(ba) . (2.10)
When γ is large, the publisher faces an interior solution problem. He can set any b between b and b and choose the level of ads a accordingly (or vice-versa). Similarly to the case with-out viewability, when γ is small, the publisher will face a corner solution problem and will set A∗v = ba. Figure2.1shows how advertising level a and viewability level b behave at the interior equilibrium, i.e when A∗
v = eA. 19κ′ A= ∂κ ∂A and R′A= ∂R