HAL Id: tel-02921451
https://pastel.archives-ouvertes.fr/tel-02921451
Submitted on 25 Aug 2020HAL is a multi-disciplinary open access archive for the deposit and dissemination of sci-entific research documents, whether they are pub-lished or not. The documents may come from teaching and research institutions in France or abroad, or from public or private research centers.
L’archive ouverte pluridisciplinaire HAL, est destinée au dépôt et à la diffusion de documents scientifiques de niveau recherche, publiés ou non, émanant des établissements d’enseignement et de recherche français ou étrangers, des laboratoires publics ou privés.
automotive
Antoine Fleury
To cite this version:
Antoine Fleury. Dissipative mechanisms during the debonding of high performance foam pressure sensitive adhesives for automotive. Theoretical and/or physical chemistry. Université Paris sciences et lettres, 2019. English. �NNT : 2019PSLET013�. �tel-02921451�
Les plus grands produits de l’architecture sont moins des Ïuvres individu-elles que des Ïuvres sociales, plutôt l’enfantement des peuples en travail que le jet des hommes de génie.
Je souhaite remercier en premier lieu mon directeur de thèse, M. Matteo Ciccotti, Professeur de l’ESPCI Paris pour m’avoir accueilli pendant ces trois années de doctorat. Je lui suis également reconnaissant pour les moments qu’il m’a accordés, ses qualités pédagogiques et scientifiques, sa franchise et sa sympathie. J’ai beaucoup appris à ses côtés et je lui adresse ma gratitude pour tout cela.
J’adresse de chaleureux remerciements à mon co-encadrant de thèse, M. Etienne Barthel, Chercheur et Directeur du laboratoire SIMM et M. Costantino Creton, Chercheur au laboratoire SIMM, pour leur attention sur mes travaux, pour leurs conseils avisés qui ont été prépondérants pour la bonne réussite de cette thèse. Je remercie également M. Etienne Barthel de m’avoir permis de réaliser cette thèse au sein de son laboratoire.
J’adresse également mes remerciements au service de la DEATC du tech-nocentre Renault de Guyancourt qui m’a accueilli pendant ce travail de doc-torat. Plus largement, je remercie le Groupe Renault pour avoir financé cette thèse CIFRE. J’aimerais en particulier adresser mes remerciements à l’équipe collage, et aux personnes qui gravitent autour, pour m’avoir permis de passer trois années dans une bonne ambiance : Nathalie Oudin-Barrois, Mattieu Ragazzini, Lucas Passemard, Stéphane Rolland, Pauline d’Herlincourt, Eric Desnoux, Philippe Michel et tous les membres du module 1.
Un grand merci à Bruno Bresson, Ingénieur de recherche au SIMM, pour son implication dans le projet et pour son expertise dans le domaine de la microscopie électronique à balayage. Il m’a beaucoup appris, j’ai apprécié son enthousiasme et sa sympathie.
Je voudrais également remercier les rapporteurs de cette thèse Mme Valérie Nassiet, Professeur à l’ENI de Tarbes et M Christophe Derail, Professeur des Universités à l’Université de Pau et des Pays de l’Adour pour l’intérêt qu’ils ont porté à mon travail.
J’associe à ces remerciements tous les membres permanents et non perma-nents du laboratoire SIMM. J’ai apprécié découvrir le monde de la recherche ainsi. Plus personnellement, j’aimerais remercier : Vivek Pandey, Cyprien Poirier, Miléna Lama, Cécile Mussault, Charline Martin, Josépha Henri, Fran-cisco Javier Cedano Serrano, Justine Tavera, Mélanie Arangalage et Raphaël Kulis pour nos profondes discussions. Un grand merci à Ana Santos Penacho pour son aide au travers de son stage que j’ai eu plaisir à encadrer.
Plus personnellement, j’aimerais adresser un remerciement appuyé à Ab-delkrim et Filipa pour m’avoir hébergé durant ces trois années. J’ai enfin une pensée pour Guy Chapet et JC Templeraud qui m’ont mis sur les rails de la réussite. Je remercie aussi ma famille et mes amis, Anna et Boris, qui m’ont fait découvrir Gyumri. Enfin, mille mercis à la personne qui a donné un sens à tout cela. . .
Contents
0.1 Introduction . . . 1
1 Foam Pressure Sensitive Adhesives in the automotive field 3 1.1 Why mastering PSA use in the automotive industry? . . . 3
1.1.1 Economic and strategic interests . . . 3
Such a technique is mandatory to keep a sustainable production system . . . 4
1.1.2 Industrial need in such a PhD research . . . 6
Brand identity protection . . . 6
Safety. . . 7
1.2 When industrial interests meet academic research: state of the art of the research on PSA . . . 7
1.2.1 The bonding formation . . . 8
Where does molecular adhesion come from? . . . 8
Role of the rheology in the contact formation . . . 13
1.2.2 The debonding stage . . . 16
Paradoxical performances of the PSA . . . 16
Enhancing adhesive performances: how PSA dissipate energy? . . . 17
The limits of PSA usage: when the substrate surface is altered . . . 24
1.3 PhD problematic definition . . . 27
2 Foam PSA for high bonding performance 29 2.1 Material characterization . . . 29
2.1.1 Structure identification. . . 30
Optical Microscopy . . . 30
Scanning Electron Microscopy . . . 30
Micro Tomography . . . 32
Structure of the foam PSA . . . 33
2.1.2 Rheological characterization . . . 36
2.1.3 Tensile test behavior . . . 39
2.2 Strategy to study PSA debonding . . . 41
2.2.1 Flat ended probe tack test . . . 42
2.2.2 Instrumented peel test at 90 . . . 44
2.2.3 Tensile tests . . . 46
2.3 Substrate surface preparation . . . 47
2.3.1 Surface treatment for repeatable adhesion tests . . . 47
3 How do foam PSA dissipate energy? 53
3.1 Identification of the dissipative mechanisms . . . 53
3.1.1 At the macro scale . . . 53
Flat ended probe tack test . . . 53
Peel test . . . 58
3.1.2 At the micro scale . . . 63
Micro in-situ tension . . . 63
Damage origins . . . 69
3.2 Equivalent Fibril Model . . . 70
3.2.1 Hypotheses of the model . . . 71
3.2.2 Model description . . . 71
3.2.3 Model limitations . . . 73
3.3 Non-linear rheological approach of adherence explanation . . 75
3.4 Transposition Peel/Tack Model . . . 78
3.4.1 Hypotheses of the model . . . 78
3.4.2 Model description . . . 79
3.4.3 Model limitations . . . 81
3.5 Conclusion . . . 82
4 Linking debonding region shape and adhesive performance 85 4.1 When adhesive performances depend on the tape morphology 85 4.1.1 Foam PSA geometry and adherence energy: how to model the tape geometry during a peel test at 90 ?. . . 85
4.1.2 Theoretical analysis. . . 92
Analytical calculations . . . 92
Static FEM calculations . . . 94
4.1.3 Debonding region shape when triggering the PSA sub-strate interfacial adhesion . . . 96
4.2 Tape repositioning industrial issue . . . 100
4.2.1 Description of the industrial issue . . . 100
4.2.2 Impact of repositioning a foam PSA on its adhesive performance . . . 101
4.2.3 Looking at an industrial issue through a researcher’s eye102 4.2.4 Debonding region shape after the foam PSA reposition-ing . . . 108
4.3 Conclusion . . . 110
5 Conclusions and perspectives 113
A Classic use of adhesives in automotive 117
B Influence of the high adhesive thickness on the stiffness of a peel
List of Figures
1.1 Location of bonding assembly workstations in an automotive
production line . . . 4
1.2 Letters debonding on the trunk of a car . . . 6
1.3 Young’s angle . . . 10
1.4 PSA bonding process . . . 13
1.5 PSA chains structure [18]. PSA polymer chains are entangled (energy dissipation) and weakly crosslinked (energy storage). 14 1.6 Rheology of the thin PSA scotch 600 3M (office tape) [78] at 1Hz 15 1.7 PSA Debonding process . . . 16
1.8 Adherence length scales: beyond molecular adhesion [57]. . . 17
1.9 Cavity growth under uniaxial tension conditions [18] . . . 19
1.10 Tack results for thin PSA using the instrumented flat ended probe tack setup from the SIMM lab [18] . . . 19
1.11 Peel test modeling [78] . . . 20
1.12 Schematic of a propagating crack in a soft material [18] . . . . 22
1.13 First Kaelble model . . . 23
1.14 Kaelble’s length scales [51,52] . . . 23
1.15 Painting layers in automotive field [81] . . . 25
1.16 Screening effect of contaminants . . . 26
1.17 Curved adhesive joint application . . . 27
2.1 Microscopic observations of the foam PSA surface (area in green). The unstretched tape (a on fig 2.2) is observed with the red liner to prevent potential damages due to liner debonding from occurring. The stretched sample (b on fig 2.2) is observed with-out the red liner to be easily deformed.. . . 30
2.2 Microscopic observations of foam PSA surface. a image refers to unstressed sample and b image refers to sample stretched at around 400% . . . 31
2.3 SEM observations of the unstressed material . . . 32
2.4 SEM section observations of the "liquidly nitrogenely" cut ma-terial. . . 32
2.5 Microspheres wall thickness measurement . . . 33
2.6 X ray tomography principle . . . 33
2.7 Slack obtain from tomographic experiment. The croped part on the right edge corresponds to image post processing cor-rection . . . 34
2.8 Simplified model of foam PSA structure . . . 35
2.10 Foam PSA rheological behavior in small strain regime. The test is carried out by soliciting the material in shear from -60 C to +130 C. At every 3 C a frequency sweep is carried out be-tween 10 1Hz and 101Hz. G0and tan d = G00
G0 are plotted on the
graph with respect to temperature. . . 37
2.11 Foam PSA rheological behavior in low shear level regime, fre-quency dependency of the master curve [23] . . . 38
2.12 Tensile tests setup: Instron machine ref 5980 . . . 39
2.13 Tensile tests foam PSA responses . . . 40
2.14 Cyclic tests exhibiting softening effect . . . 41
2.15 Instrumented flat ended probe tack test setup used in the SIMM lab. . . 42
2.16 Probe tack test result repeatability . . . 43
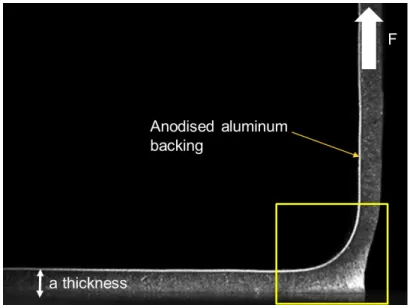
2.17 Foam PSA with an aluminum backing foil peeled at 90 from a glass substrate. Image recorded thanks to the instrumentation of the peel test setup 2.18. . . 44
2.18 Instrumented peel test setup . . . 45
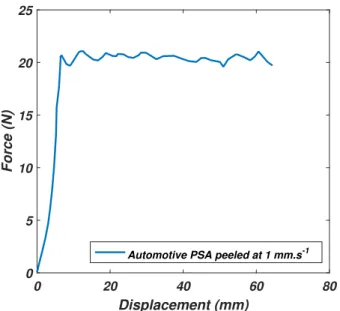
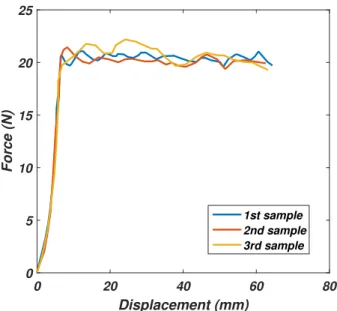
2.19 Example of the peel test plateau force measurement for the foam PSA peeled at 1 mm/s. . . 46
2.20 Micro tension test setup. The piezoelectric actuator is piloted in displacement and velocity. The connecting wires (on the right of the image) are connected to the controller through a flange adapted to SEM chamber conditions. The flange was part of the setup design. . . 47
2.21 Peeling plateau force repeatability. The three tests are carried out for a peeling velocity of 1mm.s 1 . . . . 48
2.22 Silanization protocol . . . 49
2.23 Silanization effect observed with peel tests. The three silanes used exhibit very different adhesion levels. On the figure, the plateau force corresponding to aminosilane shows instabili-ties. They are due to a bad quality of the silane. For high adhesion tests performed in Chapter 3, we used a commercial solution of aminosilane designed specifically by the tape sup-plier. . . 50
3.1 Typical probe tack results for thin PSA [64]. The figure shows the strain stress curve from the start of the debonding process to the final detachment of the thin PSA. These experiments are carried out with the same instrumented flat ended probe tack test setup. Thanks to the camera we can observe interfacial debonding reported on the images (a) to (e). . . 54
3.2 Flat ended probe tack results for foam PSA. Used substrates are glass slides prepared with the protocol presented in part 2.3. 55 3.3 Interfacial cavitation comparison between thin PSA [12] and foam PSA. . . 56
3.4 Confinement influence on the material stiffness. Mean foam PSA confinement, h/r = 0.3. . . 57
3.5 Debonding region shape with respect to adherence energy. On the top, the three photographs correspond to an increase in the interfacial PSA substrate adhesion. At the bottom, the three photographs correspond to a peeling velocity increase. . . 59
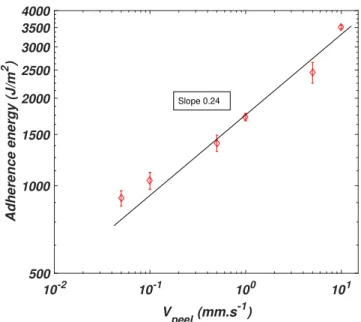
3.6 Evolution of the adhesion energy with respect to the peeling velocity. Samples are peeled on glass substrates (see 2.3 for substrate preparation) . . . 59
3.7 Debonding region of the foam PSA with respect to the increase of adherence energy. On the top, the image corresponds to a peel test at 0.1mm.s 1 on glass (preparation see 2.3) Γ ⇠
1200J.m 2, in the middle to a peel test at 1mm.s 1from glass (preparation see 2.3) Γ ⇠ 2000J.m 2, and the test on the bot-tom is a peeling at 1mm.s 1 on an adhesion promoter which chemically reacts with PSA Γ⇠5000J.m 2. . . 61
3.8 Orientation of the foam PSA bulk following internal micro-spheres debondings during tensile test at 300% deformation. . 63
3.9 Hollow glass microspheres decohesion within foam PSA bulk 64
3.10 Bulk cavity shape evolution for a sample deformation going from 400% to 500% . . . 65
3.11 Mesoscale fibril formation process (µm scale . . . 66
3.12 Hollow glass microsphere breakage . . . 67
3.13 Bulk micro structure evolution of foam PSA during tensile tests stopped before rupture . . . 67
3.14 On the left, the used instrumented tension setup (Instron 5280). On the right, the optical observations corresponding to 15% deformation and 450% deformation. The stretch is vertical. The thickness of each image is 1mm. Sphere matrix debonding is observed when spherical shapes begin to deform along the tension direction. . . 68
3.15 On the left, the two cycles are carried out at imposed strain (450%) without heating stage between the two tests. On the right, the two tests are performed at imposed strain (450%) with heating stage after the first cycle. . . 70
3.16 EFM application principle . . . 72
3.17 Maximal extension of equivalent fibrils measured in peeling at 90 . . . 73
3.18 EFM predictions with respect to actual adherence energies mea-sured with peel tests over 2 decades of debonding velocities . 74
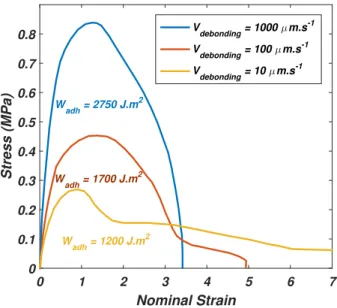
3.19 The graph on the left corresponds to the tension test results when varying strain rates. The graph on the right shows the normalized stress with respect to the nominal strain of the same tests. Normalization is made using the prefactorA . . . 75
3.20 The two graphs represent the evolution of the shift factor A.
The small graph regards its evolution with respect to ˙e and T. On the main graph,Ais plotted with respect to the normalized
3.21 The figure presents the gap between adherence energies pre-dicted by the non linear rheological based method and the ac-tual data obtained from peel test experiments. On the small graph, relative errors between model and real data are plotted. 77
3.22 Flat ended probe tack test simplified model . . . 79
3.23 Adherence energies measured with the peel test with respect to the flat ended probe tack test. Experimental conditions are based on Transposition Model hypotheses . . . 80
3.24 Maximal strains measured in peeling and in probe tack tests with respect to the adherence energy . . . 81
4.1 Geometrical parameters chosen to study the variations of the debonding region size . . . 86
4.2 Radius of curvature of the backing layer with respect to the adherence energy increase . . . 87
4.3 Suction length e with respect to the adherence energy increase 88
4.4 Ratio e
rc with respect to the adherence energy increase . . . 89
4.5 Interfacial debonding angle a with respect to the adherence energy increase . . . 90
4.6 Morphology change with respect to the adherence energy in-crease. Figure a) regards the regime for low adherence where
e
rc linear. Figure c) regards the case of high adherence energy
where e
rc = 0. Figure b) regards the transition zone where a
reaches its local maximum. . . 90
4.7 Debonding region length Ldrwith respect to the adherence en-ergy increase . . . 91
4.8 Schematic of the debonding region in a peel test at 90 . . . 92
4.9 The two figures on the top describe FEM calculations carried out for two cases. On the left the material is supposed to be quasi-incompressible. On the right the material is highly com-pressible. In both calculations, a peel test with similar experi-mental conditions is performed. The two photographs on the bottom correspond to real situation where adherence is low (left) and adherence is high (right). . . 96
4.11 Interfacial debonding angle a measured in triggering the peel-ing velocity (in red) and substrate surface chemistry (in blue) with respect to the adherence energy . . . 97
4.10 Suction length measured e in triggering the peeling velocity (in red) and substrate surface chemistry (in blue) with respect to the adherence energy . . . 97
4.12 Peel test at 90 for a weak adherence case. . . 98
4.13 Radius of curvature rc, debonding region length Ldr, ratio Lrdrc , maximal extension emaxpeel evolutions with respect to the adher-ence energy. Peelings at 90 in triggering the peeling velocity (in red) and substrate surface chemistry (in blue). . . 99
4.15 On the left graph, peeling results obtained for the three first bonding/debonding cycles. In green is the first test and in grey are the two others. On the right graph, adherence energy reached during the peel tests with respect to peeling number . 102
4.16 Adhesion energy as a function of repetition number of peel tests. This effect is ascribed to surface contamination. . . 103
4.17 Adhesion energy as a function of repetition number over a two decades of peeling velocities . . . 103
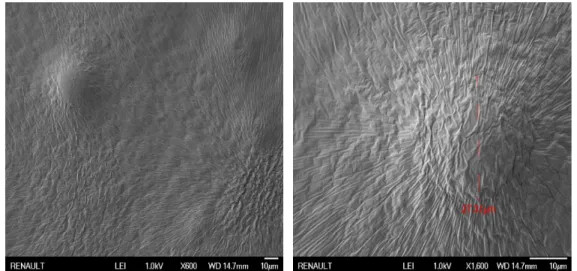
4.18 SEM observation of the substrate surface after debonding. The zone of debonding corresponds to the area where the foam PSA was peeled off. . . 104
4.19 SEM observation of the contaminated surface. Zoom in the dots with the "beans" particles. . . 105
4.20 Local geometrical confinement change due to internal cavita-tions of the hollow glass microspheres close to the interface. . 105
4.21 Impact of the tape bulk damage on the adherence energy level 106
4.22 Adherence energy as a function of the peel velocity for three successive experiments with the same tape on three fresh sub-strates. The strong decrease between exp 1 and exp 2 demon-strates the impact of the material damage during a peeling at 90 . . . 106
4.23 Induced healing by heating peeling samples before rebonding it107
4.24 Suction length e measured in triggering adherence energy thanks to the peeling velocity (in red), substrate surface chemistry (in blue), the substrate surface contamination (in cyan) and using damaged adhesive (in green) . . . 109
4.25 Interfacial debonding angle a measured in triggering adher-ence energy thanks to the peeling velocity (in red), substrate surface chemistry (in blue), the substrate surface contamina-tion (in cyan) and using damaged adhesive (in green) . . . 109
List of Abbreviations
PSA Pressure Sensitive Adhesives
SIMM Sciences et Ingenierie de la Matiere Molle
SBR Styrene Butadiene Rubber
AB Acid-Base
d dispersive
p polar
PTFE Poly Tetra Fluor Ethylene PMMA Poly Methyl Meth Acrylate
LEFM Linear Elastic Fracture Mechanics NLFM Non Linear Fracture Mechanics SVD Single Value Decomposition
SSY Small Scale Yield
FEM Finite Element Modeling SEM Scanning Electron Microscopy
EDX Energy Dispersive X-ray WLF William Landel Ferry EFM Equivalent Fibril Model
FEG Field Emission Gun IPA Iso Prop Anol
List of Symbols
Esur f ace surface energy J.m 2
S entropy J/m2
g surface free energy J.m 2
q angle rad
Wadh work of adhesion J.m 2
Tg glass transition temperature K
T temperature K
µ0, µ00 (resp. G0, G00) shear moduli Pa
w Dupré fracture energy J.m 2
Uw strain energy J
Uel elastic energy J
G strain energy release rate J.m 2
s stress Pa
r typical distance to the crack tip m
E Young modulus Pa
Γ fracture energy J.m 2
v crack propagation velocity m/s
f viscoelastic function
-LEA elasto-adhesive length m
r⇤ radius of curvature of the crack tip m
la, lb Kaelble lengths m
hb backing thickness m
a, a0 adhesive intial thickness m
Y Kaelble strands Young modulus Pa
b width of peel samples m
n Poisson ratio
-aT TTS shift parameter
-˙e strain rate s 1
w frequency Hz
t time s
e strain
-F, Fpeel peel force N
Vpeel, Vpeeling peeling velocity m.s 1
Ldr, l debonding region length m
rc, R radius of curvature of the backing m
I quadratic moment m4
M bending moment N.m
T tangential force N
-q lineic force N.m 1
P Laplace pressure Pa
emax maximal fibril deformation
0.1
Introduction
Currently the even more competitive car making field is at a watershed in its history. Whether it is with the new kind of powertrains (full electric, hy-brid...) or with the use of new materials, innovation and development sound as it is necessary for a car builder to stay on track. In this framework, bonding used as an assembly technology has been more and more present in the au-tomotive world. More specifically, car manufacturers such as Renault, have been advised to use Pressure Sensitive Adhesives (PSA) designed for auto-motive application. In general, one can find them in domains going from microelectronics to biomedical as they represent an adhesive solventless so-lution. However, introducing such complex materials in a mass production-oriented system is not the easiest task to achieve. That is why the company offered to finance a doctorate research program based on this topic. Hence, the work described in the following thesis was initially motivated by one purpose: gaining qualitative and quantitative knowledge around the foam PSA behavior. In order to address such a generic industrial objective, we organized the study around the triptych product-process-material. This ap-proach enabled us to dive quickly into a more fundamental research on the PSA behavior itself but keeping in mind the industrial application.
The first chapter consists of contextualizing the usage of PSA in the au-tomotive industry. In spite of its small size compared to the rest of the car, we observe that PSA materials are one of the cornerstones of the future high tech automotive world. In the same chapter, we review the latest scientific breakthroughs regarding application process and classic PSA. Thus we can build a strong and relevant problematic for the doctorate thesis.
The second chapter is entirely dedicated to the characterization of the PSA for high bonding applications. At the beginning of this study, the partner company gave us a totally unknown material subjected to trade secret pro-tection. That is why the research starts by developing and adapting mea-surement techniques to define the internal structure and the main behavior of the material of interest. The results are even more attractive since they supplement researches on materials for deep water equipment.
The third chapter focuses on dissipative mechanisms identification. Then we build a phenomelogical model to describe the performance of an adhesive joint made with the foam PSA. The model is called Equivalent Fibril Model. We apply it to 90 -peel test. We then explain quantitatively our model us-ing non linear rheology. A second model, called Transposition Model, links results from different loading conditions (peel test and flat ended probe tack test). That is the first time that such models are presented for the very specific foam PSA.
The fourth chapter exhibits the link existing between adherence perfor-mances and foam PSA debonding region shape. The morphology of the foam
PSA during the debonding and the adherence energy level associated col-lapse on a master curve (morphology vs adherence). The results are found in triggering the peeling velocity, the interfacial adhesion between adhesives and substrates and the damage of the foam PSA.
The last chapter sums up the scientific conclusions of the study and gath-ers the takeaway messages. It also provides the reader with pgath-erspectives and supplementary works which should be done to enrich the research on this topic.
Chapter 1
Foam Pressure Sensitive Adhesives
in the automotive field
1.1
Why mastering PSA use in the automotive
in-dustry?
Mastering PSA use in the automotive industry can seem a bit out of the scope of an automobile manufacturer top one priority. We could think that such a question should remain in the tape supplier perimeter and that only its specifications should interest the car builder. Nothing is less fair and we describe why.
1.1.1
Economic and strategic interests
Renault Group is part of one of the largest world car manufacturer, the Re-nault Nissan Mitsubishi Alliance. Thanks to their factories across the world, from Tanger in Morocco to Moscow in Russia, the Alliance produces more than 10.6 million vehicles per year (2017 figures)[42]. In order to reach such a number at the lowest cost, all the production lines in factories are organized around the same systematic organization.
On the schematic of the figure1.1, we observe that the car is assembled following a defined sequence which decreases as much as possible timeouts. Firstly, the body of the car is fabricated, chemically treated and painted. The surface treatment is called cataphoresis. It consists of depositing a layer to protect the body of the car from corrosion. The painting protocol is orga-nized in three steps. The surface of the body of the car, initially chemically treated, is covered by a layer of paint primer. The vehicle is then baked and another layer is deposited, that is the base coat containing the pigments giv-ing the color. This base coat is then reinforced by a top coat which is designed to protect the base coat. It is also worth noticing that this top coat is more and more designed to exhibit the lowest surface tension possible to prevent dust and dirt from attaching to the car. The final structure of the surface of the car is described on the graph of the figure 1.15. After its construction and painting, the body of the car is blended with the powertrain (assembled on
is gaining momentum: customization. According to the English Oxford Liv-ing Dictionaries, customization is the action of modifyLiv-ing somethLiv-ing to suit a particular individual or task. When customers buy a new car, they want it to be unique. To be able to deliver a unique vehicle to a single customer over millions, car manufacturers have integrated customization in their car fabrication processes. Thanks to the use of PSA, they can attach small parts as aesthetics beams or emblems on a car without troubling all the production line. The system is very straightforward and reasonably time consuming. On a normal workstation, there is a box with optional parts that operators can bond or not depending on the car customer will. On a production line, each operator has a certain amount of time dedicated to operations so car manufacturer has to plan bonding operations which match with the initial task timing. PSA allow them to do so. Thus, there is no delay in the pro-duction between two different cars. Thanks to these small aesthetics items, differences between vehicles can seem minor regarding the complexity of a modern car but putting an emblem or a chromed beam can change all the aes-thetics and convinces the customer to buy a vehicle. Hence, customization is essential for the sales strategy of the car manufacturer. Thanks to PSA so-lutions, the cost of such a marketing differentiation remains well controlled. Another meaningful advantage of using PSA is to contribute to the weight reduction of a new car. The fact of subsidizing the classic assembly tools as clips, screws etc... allows manufacturers to get rid of heavy elements com-pared to PSA. "When bonding solutions will be generalized on all structural and non-structural parts of a vehicle, kilos will be saved", Renault produc-tion expert said. With such a weight decrease, it is obvious that car fuel or electric energy consumption will also greatly decrease. From this point of view, it turns out that PSA make the car greener which is of prime interest for both economic and strategic automakers interests.
Even if PSA are relevant solutions to address many challenges of the mod-ern automotive world, it remains some factors to consider, especially in the framework of a doctoral research. They are all due to the fact that the topic re-gards mass production in workshop environment. It means that production imperatives will be likely to alter the performance of PSA. More precisely, the industrial process is driven by the production line which can cause default in the bonding formation, the atmosphere can be polluted by dust and/or wax which can contaminate the substrate onto which a PSA is supposed to ad-here. In addition, the shape of substrate is induced by aesthetics rules which can differ from scientific requirements to get optimal bonding performances. These materials have obviously been designed in labs and have been tested to meet industrial specifications. The goal of the research is then neither to question the chemical formulation of the PSA nor to contest their structure. The objective is to understand how the PSA work and how industrial imper-atives can influence their behavior.
FIGURE1.2: Letters debonding on the trunk of a car
1.1.2
Industrial need in such a PhD research
The interests for the car manufacturer of using PSA is now clear. Diving deeper into the study, one question pops up: what happens during PSA failure? In other terms, can we understand PSA failure? More than being selective when choosing PSA commercial references, giving comprehensive answers to those questions would lead to the Grail for industrial compa-nies. Indeed, industrialists would like to predict PSA failure. Prediction is a very tough and intriguing point when talking about adhesives. There are a large number of critical factors driving PSA performance. According to an automaker point of view, PSA failure must be understood for two reasons: brand identity conservation and safety. The latter regards PSA use in the framework of autonomous vehicles.
Brand identity protection
In appendixA, we observe that PSA are widely used to assembly letters and company emblems on cars. Even though not vital for vehicles well function-ing, these small parts must stay in place for all the service life. They account for the identity of the car. A debonding can lead to a catastrophic appeal decrease for a car brand. It suffers from a low quality image which affects irretrievably the future sales.
On the figure 1.2, the initial name of the car was "SCENIC". This loss generates a bad image for the brand Renault which is the car producer. If the debonding occurs in the guarantee period, the debonding of one single letter will doubly impact the automaker since it will have to pay to recall the vehicle and fix it. More importantly, if a default of bonding process is high-lighted when a single car is recalled, then the company has to recall all the
vehicles produced by the same production line. Such a situation can quickly cost millions of euros. Whether it is for protecting the brand image or saving millions in recalls, PSA failure must be understood by car manufacturers to prevent them from occurring.
Safety
With the increase in automation in cars due to the growing popularity of au-tonomous vehicles, more and more sensors and cameras are being used in cars. Most of them are carried by parts which themselves are attached to the body of the car or on bumpers. For the reasons mentioned above, car mak-ers make such demanding assemblies using PSA. It is easy to undmak-erstand that sensors must remain correctly attached to the car. A loss of one of them would result in a catastrophic accident, potentially causing death. Without sensors or cameras the autonomous car would be blind, with no driver in-board. That is why PSA failure must be vitally understood to be able to, once again, reduce the risk of debonding. In this case, it is no longer only commercial or financial issues car makers can face but major safety threat for customers.
1.2
When industrial interests meet academic research:
state of the art of the research on PSA
When talking about PSA, one can often confuse them with glues. However, as we will detailed in this section, PSA and glues are fundamentally differ-ent. Firstly, in the bonding process, glues establish strong chemical bonds with the substrate whereas PSA substrates interfacial adhesion levels are most time driven by molecular adhesion. Secondly, the performance of glues mainly comes from the strength of the chemical bonds they establish with substrates. In the case of PSA, performance comes from their ability to dissi-pate energy. These differences make glues and PSA two distinctive classes of materials.
Inside the PSA family, it is now of interest to differentiate classic PSA which do not require external treatments other than an applicative pres-sure and the so called hotmelt PSA. The latter require curing process when bonded to a substrate. This curing is needed to remove solvent, favor cross linking... PSA studied in the framework of this PhD thesis are solventless, classic PSA. Here, we focus on the most widely used PSA adhesives which are acrylics polymer based PSA [9]. Their high resistance to oxidation, and therefore aging, undoubtedly justifies such popularity [85]. Foam PSA, al-though very thick (⇠mm thickness size), are included in this denomination.
For this reason, we reviewed in the following subsections the relevant part of the literature regarding classic PSA. We first look at the bonding forma-tion and then, focus on the debonding process. In the whole thesis, we call foam PSA or automotive PSA or automotive foam PSA the thick tape given by
the company (similar to commercial reference GT6012 from 3M). We call thin PSAor thin films PSA the classic office tapes commonly assimilated to PSA denomination.
1.2.1
The bonding formation
The key point to study adhesion phenomena is the notion of length scales. Generally, one can distinguish three domains: the nano-world where every-thing sticks naturally and spontaneously, the transition scale (⇠µm) where no obvious adhesion or detachment occur, and the macroscopic engineering world where spontaneous adhesion is not common to encounter (⇠mm). In
that case, the use of bonding solutions like PSA is required. For those ma-terials, the objective of the contact formation stage is to come very close to the substrate surface (less than 5nm [57]) to establish interactions. Between PSA and substrates, the early stages of the interfacial strength is driven by molecular adhesion (van der Waals forces) [17]. In the long term, interfacial adhesion increases which is due to the dynamic and uncross linked nature of PSA [1]. For example, the adhesion for a polar PSA increases according to the dynamic of the polar groups in the material bulk which have to reach the interface to establish polar interactions (see next subsection). In a nutshell, whether it is in the short or the long term, PSA interfacial adhesion is firstly piloted at the molecular scale.
Molecular adhesion occurs at a very small range (less than 5nm [57], smaller than the classic short range interactions such as electrostatic forces. Hence, an intimate contact between PSA surface and substrate is of prime interest to establish good interfacial interactions and favor bonding strength. However with PSA, it is also possible to engender stronger interactions between the PSA and the substrate by depositing an adhesion promoter. Ad-hesion promoter is designed to chemically react with the substrate by form-ing chemical bonds with it. In that case, we are no longer in the case of molecular adhesion but strong chemical interactions. Excepted for some ex-treme cases (see Chapter 3 and Chapter 4), we will mostly not use adhesion promoter in the frame work of this research.
According to the literature [18, 37, 4, 5, 38], the question of the bonding formation for a PSA can be seen as a coupling of two parameters: one is extrinsic, the substrate surface state and the other is intrinsic, the rheology of the PSA.
Where does molecular adhesion come from?
When talking about PSA adhesion, we know that a close and intimate contact between the adhesive and the substrate, around 5nm is sufficient to establish adhesion [57]. However, to go further in the study, it is worth understanding whence this interfacial adhesion comes from.
Whether it is in the bonding process (see fig 1.4) or during the debond-ing (see fig 1.7), the interface plays a major role. The interfacial adhesion is regarded as the core of many models of debonding energy description [60, 30]. As previously said, the interactions implied in PSA adhesion are mostly weak. When talking about weak adhesion, one can quote the Keesom interaction (between molecules with permanent dipole), the Debye interac-tion (between a molecule with a permanent dipole and a molecule with an induced dipole), the London or dispersive interaction (between molecules which together induce a dipole) and the donor-acceptor interaction [32] also called acid-base interaction (takes place when hydrogen atom is shared be-tween two molecules which creates a hydrogen bond).
Theoretically, one should be able to evaluate the ability of an adhesive to establish these kind of weak bonds by studying surface free energies of the substrate AND the adhesive [61, 60]. At the first order, a contact between a PSA and a surface is established if the interfacial surface free energy is lower than the surface free energies of the PSA and the substrate taken separetely. In condensed matter (solid or liquid), the atoms and molecules in the bulk remain together because of strong bonds existing among them. However, at the extreme surface, the atoms of the final layer have less neighbors so that they have an excess of energy (bonding energy being negative). This energy excess is called surface energy. This surface energy corresponds to the total amount of energy, E0
sur f ace, (or enthalpy) consumed by the creation
of a new surface. Rigorously, it differs from the surface free energy, g (or free enthalpy) which describes the amount of the energy available to react within a potential interface [15]. The link between the surface energy and the surface free energy is made with the energy used in the disorder of the elements of the material, Ssur f ace – called entropy – which can be written as the following relationship:
g0=Esur f ace0 T.S0sur f ace (1.1)
or
g =E0sur f ace T.dg
dT (1.2)
According to the equation above, the surface energy and the surface free energy are only equal at the absolute zero [15]. The difference between sur-face energy and sursur-face free energy is often neglected by industrialists which prefer to talk about surface free energy using the name surface energy even if it is, theoretically, nonsense according to the explanation above.
when one wants to study adhesion problems. Many researchers have been focused on its measurement. For the liquids, works during the 70’s and 80’s [48] led to efficient methods: Du Nouy setup, Wilhemy setup [2] or the well-known in industry, the pendant drop method [3]. Nonetheless, it is necessary to keep in mind the fact that in PSA adhesion problems there is no liquid. An easy way to measure this free energy would be to use the melt solid (so a liquid) [29] and extrapolate the results using relevant parameters. Harding [45] did the calculations with silica at 25 C. This protocol is difficult to use with foam PSA because of their complex chemistry.
Like for the liquids with the surface tension measurements and calcu-lations, many methods have been developed to determine the surface free energy of a solid. However, on the contrary to the liquids, results obtained for the solids are strongly dependent of the method used [15]. For example, according to the literature, the polyethylene has a surface free energy be-tween 24mJ.m 2[76] and 55mJ.m 2[67], the PTFE has a surface free energy between 18mJ.m 2 [86] and 34 mJ.m 2 [67]. And within the same method,
Carré [11] showed that the value was likely to vary, between 41 and 49mJ.m 2 with PMMA for instance. For these reasons, one must be careful with the method used when determining the surface free energy of solid. Regarding substrate, it is much easier to carry out such measurements. Pendant drop method [3] or sessile drop method are well adapted. They are used for mea-suring the polar and dispersive components of the surface free energy of a solid (substrate) utilizing polar and dispersive liquids. In this configuration, a single drop is deposited on the substrate and the spread of the drop is recorded to measure the angle q (figure1.3).
FIGURE1.3: Young’s angle
q is not a constant angle and it is necessary for experimenters to define clearly their measurements: advancing angle, receeding angle, angle after X seconds of stabilization. . .
These methods have been used in automotive industry. As it was likely, all top coats used exhibit a surface free energy between 40 and 45mJ.m 2. In
such a configuration (see figure1.3), one can recall the Young’s equation [84]:
Because cos is decreasing on [0 ; p/2], the spreading of the liquid is ob-tained for gl < gs gsl which means that the spreading coefficient S =
gs (gsl +gl) [16] is positive. Fowkes in 1967 [33] proposed to decompose
the surface free energy by a sum of energies of different origins:
gtotali =gid+gip+giAB (1.4) where d stands for Dispersive, p for Polar and AB for Acid-Base.
Because of the contribution of each interaction within an interface, they can be added [33].
Dispersive interactions
In the cases of two non-miscible liquids or a non-polar liquid with any solid or a non-polar solid with any liquid, Fowkes [33] proposed that the influence of one phase on the other is equal to: g1
q
g1d.gd2 (resp. for the other phase: g2
q gd1.gd
2). So the interfacial energy is given by g12 =
g1+g2 2
q g1d.gd
2hence the Dupré energy [28], which describes the link
be-tween the adhesion energy and the surface free energies of the two materials assembled, is:
Wadh =g1+g2 g12 =2
q
gd1.g2d (1.5)
To recall [15, 17], most of the early stage interactions occurring in the bonding process of a PSA comes from the dispersive forces. For acrylate based PSA, the long term is driven by polar interactions (presented later on) [10]. According to Benedek et al. [10], "Acrylate-based PSA are highly polar and the polar groups are initially oriented into the bulk adhesive and away from the surface because of the presence of a silicone-coated liner (highly non polar)". Hence, when that kind of PSA is deposited onto a substrate, it will first establish dispersive bonds as depicted in this part and then, as time goes by, polar group will rotate towards the interface substrate adhesive and es-tablish polar bonds which will explain performance which is observed some time after the bonding process.
Polar interactions
One just saw that by considering only the dispersive interactions occur-ring within an interface, it was possible to link adhesion energy and surface free energy of the two materials. However, most adhesives have a total sur-face free energy larger than the only contribution of the dispersive interac-tions. Historically, the first guess was that excess of energy comes from a polar contribution [50]:
gi =gid+gip (1.6)
Based on the equation (1.5), Owens [50] wrote this expression of the ad-hesion energy: Wadhp =2qg1p.g2pwhich gives the following expression of the adhesion energy:
Wadh =Wadhp +Wadhd =2qg1p.g2p+2qgd1.gd
2 (1.7)
From this expression, we define the polar and dispersive contribution. Hence, it is theoretically straightforward to determine the surface free en-ergy of any solid. If one measures the contact angle of a purely dispersive liquid on a solid, the equation (1.4) combined with the equation (1.5) will give directly the dispersive component of the surface free energy gd. Then,
the equation (1.7) allows to calculate the polar component gp, in using
an-other polar liquid such as deionized water [50].
However, it is worth noticing that this approach does not allow to de-scribe which kind of interactions take place behind the term “polar”. For Fowkes [33], the non dispersive forces come from the acid base interactions generating hydrogen bonds. Strictly speaking, polar interactions coming from the establishment of Keesom or Debye bonds are negligible when talk-ing about the adhesion of a polymer on another. But never in the literature, we observed a strict model or even measurements linking precisely the polar component of the surface tension and the interfacial adhesion of an acrylate based PSA. We can only quote works [8,61,60] who showed a link between the overall surface tension and the adhesive joint performance but never a predictive law.
AB interactions
Acid-base interactions describe mainly two mechanisms: an exchange of proton (Broensted acid) or an exchange of an electron pair (Lewis acid). In both cases the base is the same but the acid is a proton donor (Broensted) or an electron pair acceptor (Lewis). Drago [27] showed that the hydrogen bonds come from Lewis interactions. To evaluate quantitatively such a force, two approaches have been proposed: the first one by Drago [27] valid at the so-called “Drago scale” and adapted by Fowkes to the interface solid-liquid [32]; the second one by Gutmann [44]. For a purely polymeric interface, the acid base interactions will be very close to the monomers constituting the two polymers. However, in the framework of this study, we will not con-sider specifically the AB intercations but assume that, if such interactions take place, they are included in the polar contribution.
In a nutshell, interactions occurring at the interface when bonding a PSA onto a substrate are mostly dispersive when talking about instantaneous ad-hesion (tack response). In the specific case of highly polar acrylate based adhesives, dispersive interactions are gradually overcome by the polar inter-actions which become more and more dominant in the long term behavior. That is why, no clear evidence of a model predicting quantitatively adhe-sion performances thanks to substrate surface energy was found. The only information one can get from such a surface measurement is a hint on the ability of a PSA to potentially attach well on a substrate. For example, if one takes SBR (purely dispersive material with no polar group within) to attach a weakly dispersive and highly polar part, it is straightforward to predict a bad quality assembly. To conclude on this part, a reasonable hypothesis we can make is that the interfacial adhesion of foam PSA (acrylate based PSA) is mainly due to weak interfacial interactions. When talking about molec-ular adhesion, we are considering weak interactions (a few tens of mJ.m 2
[57,58]). In the frame work of this research, we use surface energy measure-ment to evaluate the quality of the surface treatmeasure-ments we use to trigger the interfacial adhesion level (see Chapter 2).
Interfacial interactions are formed during the bonding process. The latter can be described by the schematic from figure 1.4. The PSA is first pressed onto a substrate to deform it and adapt to the surface roughness (center im-age1.4). This deformation induces internal stresses occurring at the neigh-borhood of the surface in the PSA. Elastic energy is thus stored within the bulk of the material. To prevent the material from spontaneously debonding when the pressure is removed (spontaneous debonding due to the immediate release of the elastic energy [40,34,73]), the pressure must be applied during a sufficient time to allow the material to reach its viscous regime. Such a con-dition is controlled by the tape rheological behavior depicted below. Once, most of the internal energy has been dissipated, the pressure is removed and the adhesive joint is formed (right image on fig1.4).
FIGURE1.4: PSA bonding process
Role of the rheology in the contact formation
The rheology is often the hard point when studying PSA. For long times, re-searches on PSA in the automotive field where led by mechanical engineers who were not familiar with the science of rheology. In the contact forma-tion perspective, rheology refers to the stage abusively called in the industry
wetting of the adhesive. Works [18, 10] carried out until recently unveiled the fundamental influence of the rheology on the PSA ability to bond onto a sub-strate. In figure1.4, we have seen that dissipation is crucial to allow the PSA to correctly "wet" the substrate surface. Hence, it becomes logical that glass transition temperature (Tg) is key. Tg will drive the dissipative regime and therefore the PSA applicability domains. Also, to be a good adhesive, PSA must be soft enough to adapt to substrate surface roughness (so exhibiting a low elastic modulus) but stiff enough to resist to debonding (so exhibiting a high elastic modulus). These two antagonist conditions are met thanks to the polymeric structure on fig1.5. As a reminder "soft" means that materials have a low shear modulus relative to their bulk modulus and where elastic restoring forces are mainly of entropic origin [18].
FIGURE1.5: PSA chains structure [18]. PSA polymer chains are entangled (energy dissipation) and weakly crosslinked (energy
storage).
PSA materials are both entangled to dissipate energy and crosslinked to prevent flowing at the macro scale from occurring (weak crosslinking). This structure will store strain energy elastically when deforming during the pres-sure application time to the surface (see fig 1.4). If the material was fully elastic, this energy should not exceed the reversible Dupré work of adhesion. In this scenario, the amount of energy stored within the material would de-pend on the roughness of the substrate surface. To couple roughness and material behavior would therefore be of primary when wanting to predict performances of an adhesive joint. However, this coupling is very difficult and hardly takes into account all the diversity of surfaces encountered in the automotive industry [20, 34, 47, 72]. What is more, to be efficient the PSA material must not be only elastic. As seen previously, this stored energy is naturally a driving force to spontaneously debond the PSA from its substrate [40, 34, 72]. Hence, a real PSA is no longer only elastic but exhibits a high viscoelastic behavior. According to Creton et al. [18], this viscoelasticity will allow to dissipate most of the stored elastic energy. Thus, performance of the adhesive joint strongly depends on the history of the material. In other terms, the pressure applied during a specific time at a certain temperature to bond a PSA will influence the whole resistance of the adhesive joint. This energy dissipation will thus reduce the risk of spontaneous debonding by dissipating the residual energy stored because of the local deformation of the PSA to accommodate substrate roughness. Thanks to this local deformation,
the material will form an intimate contact between the adhesive and the sub-strate. This intimate contact (less than 5nm [57]) will engender the expected adhesion of the PSA material with the substrate.
Rheology is the key driver of a good adhesive material. The question which logically follows is: can we provide the industrialists and PSA users with quantitative criteria to guarantee a good interfacial adhesion formation? An empirical answer has been given by a scientist from 3M company called Dalhquist [21]. He presented in his article three criteria.
- Glass transition temperature well below the usage temperature (chains must be mobile)
- Low shear modulus (10 - 100kPa) when tested at a characteristic fre-quency of 1Hz (strain energy to conform to even rough surfaces)
- Elastic character at low frequency or long times (preventing the creep) The big advantage of such criteria is that they are easily applied on PSA rheological data. For example, on the figure1.6, we find two graphs present-ing PSA rheometer measurements (µ’ (elastic behavior) and µ” (dissipative behavior)) for a small strain shear loading.
FIGURE 1.6: Rheology of the thin PSA scotch 600 3M (office tape) [78] at 1Hz
In applying the criteria, we can say here that the application tempera-ture domain should be ideally higher than 15 C. Tg (-25 ) being measured as the inflexion point of the µ’ curve, 15 would allow to respect the first criterion. For this temperature domain, we verify that shear modulus meets the 10-100kPa. Eventually, at low frequency (so at high temperatures in the hypothesis of TTS) we can observe on the µ” curve that the dissipative pa-rameter is very low. According to Dahlquist, office tapes are supposed to adhere to most kind of substrates.
In this part, we saw that the rheology of the PSA materials plays a signif-icant role in the contact formation. Temperature and frequency conditions
during bonding process pilot PSA surface "wettability". The latter being driven by the chemical formulation, PSA adhesive behavior can then be trig-gered by modifying the chemistry to cope with a dedicated system. If rheo-logical behavior is satisfying, molecular adhesion is likely to occur which is the base for adhesive joint performance.
1.2.2
The debonding stage
Debonding a PSA can be defined by the breakage of the interface between the substrate surface and the adhesive itself. This stage is represented on figure
1.7.
FIGURE1.7: PSA Debonding process
One can firstly assume that the adhesive is optimally bonded to a sub-strate (first drawing from fig1.7). Then, PSA material is loaded to break the interface (second image). Being soft (see the definition above [18]), the PSA material deforms a lot. During the deformation, PSA dissipates a lot of en-ergy. More the PSA are loaded, more energy is dissipated. This amount of dissipated energy cannot then reach the interface to break it. As a result, one has to provide more and more energy to debond the tape from the substrate which increases adherence level. At some point the energy provided is so large that even with strong deformation the adhesive can no longer dissipate energy and so the interface breaks (called "adhesive failure case", in the third image). The failure can also occur in the bulk (called "cohesive failure case") if the material internal bonds are not strong enough to undergo bulk stresses.
Paradoxical performances of the PSA
The previous explanation on energy dissipation associated to PSA deforma-tion highlights one specificity of the PSA. Adhesive performance of such a material are paradoxical. Indeed, as mentioned in the graph of Kendal [57] (see figure1.8), we see that if PSA adhesive performances were only due to the interfacial interactions, the overall fracture energy that a PSA could reach would be around a few tens of mJ.m 2. This energy level corresponds to the
energy needed to break weak bonds (see molecular adhesion above). How-ever, on the figure of Kendall [57] we observe that much larger (resp. smaller) fracture energies are measured. This performance increase (resp. decrease)
is due to the fact that energy is dissipated in the bulk of the material (resp. the substrate surface is altered). That accounts for all the paradox of the PSA behavior. The interfacial adhesion is relatively weak but, thanks to intrin-sic properties of the material, the overall adherence is much higher. In the same way, when substrate surface is altered, the interfacial adhesion can-not set properly and the bulk dissipative mechanisms cancan-not be activated so the overall adherence is even lower than the theoretical adhesion [10]. When using PSA, the most important thing is to ensure that the conditions for activating the internal dissipative mechanisms are met. This is one of the main objectives of this PhD: to understand how dissipative mechanisms act in foam PSA to promote their appearance.
FIGURE1.8: Adherence length scales: beyond molecular adhe-sion [57]
As we can imagine, the interest of car makers is primarily in better know-ing how to enhance energy dissipation through dissipative mechanisms ac-tivation. In the trade literature, we did not find any previous works which were done on these mechanisms in foam PSA. The only ones which have been extensively studied concerned thin and confined PSA materials (thin PSA).
The other case, when PSA adhesive performances are limitied by a sub-strate surface alteration, is also of interest, especially in order to understand the activation criteria of enhancing phenomena. This point is critical for the car manufacturers which have to design relevant assembly processes to pre-vent such catastrophic situations from happening. Laying the foundations for such a relevant assembly process is another objective of the PhD program.
Enhancing adhesive performances: how PSA dissipate energy?
When PSA are well bonded to a substrate, when the contact formation is made according to the specifications detailed in part 1.2.1, the adhesion reaches an optimum. That is the necessary condition for the internal dissipative mechanisms to activate and to grow. Without a good adhesion, without a good contact formation, one cannot expect the PSA to be efficient [18, 15, 10,
59]. As previously said, we observed that PSA dissipative mechanisms have been extremely well studied in the literature for the thin PSA (around 100 µm-thick) [51, 38, 10, 18]. Globally, researchers have divided the study into
two stages. First, the initiation of the debonding (initiation of the crack) and then, the debonding front propagation (propagation of the crack).
Initiation of the debonding
Interfacial rupture is the easiest to understand when evoking the initia-tion of the adhesive debonding. This is the rupture which takes place be-tween the adhesive and the substrate. When an adhesive is bonded to a surface, the contact at the interface is never perfect. Some air bubbles are confined between asperities or other flaws [18].
To quantify them, non-destructive tests are proposed in the literature [68,
69, 63]. The main interest for those tests is that they are applicable in an in-dustrial mass production system. One technology is particularly interesting to describe the interface: multi-emitters multi-receptors tests. They are based on the SVD (Single Value Decomposition) method [68]. Another interesting way to do so is the method presented by Lefebvre et al. [63]. Although inter-esting, those techniques are not a panacea and the interface characterization remains still today a hot topic for researchers.
Because of the imperfect interface, when the polymer is submitted to a loading as tension, this condition generates a negative hydrostatic stress on those bubbles [36,17]. The hydrostatic pressure value is strongly dependent on the confinement. The latter is especially high when the adhesive is geo-metrically confined between two rigid subtrates. As a reminder, we consider geometrical confinement when sample lateral dimensions are not at least ten times higher than the material thickness. In such conditions, these air bub-bles tend to grow as cavities. Once a cavity is generated at the interface be-tween the adhesive and the substrate, it grows and develops as presented in figure1.9[39]. On this schematic1.9, one can see that cavities have a common origin, but the development can take two paths. When interfacial adhesion is not very high, debonding can be described by the lateral growth of cavities which progressively leads to a global debonding of the polymer (upper case). In case of high adhesion and high material toughness, cavities will tend to grow vertically. The walls between cavities become thinner and thinner until the creation of elongated polymer parts which are called fibrils (fibrillation or fingering process) [62]. The overall work of debonding can thus become very high. Polymeric PSA being highly viscoelastic, energy dissipated in the fibrils depends on their strain rate and the material temperature [13, 7]. In the relevant regime, adherence energy can easily reach some thousands of kJ.m 2.
FIGURE1.9: Cavity growth under uniaxial tension conditions [18]
These specific configurations can be recreated in lab using the flat ended probe tack test (further details are provided in Chapter 2). The flat ended probe tack test, as depicted in figure 2.15, allows to obtain the curve from the figure1.10. On this curve, we distinguish direct views of the debonding interface between the adhesive and the substrate.
FIGURE1.10: Tack results for thin PSA using the instrumented flat ended probe tack setup from the SIMM lab [18]
The curve shows clearly the different stages of the debonding crack initia-tion. Firstly, there is the cavitation phenomenon which appears according to figure1.10. Then, there is the cavities growth leading to fibrillation process. The thin PSA is then totally fribrillated and the debonding occurs when the single and independent fibrils detach from the substrate. The overall inter-face rupture is often brutal (end of the curve on the figure1.10).
Propagation of the debonding front
Once the debonding is initiated, the crack front has to propagate. During this stage the evolution of the debonding is easier studied regarding a steady state regime. A relevant solicitation in this case is the peel test. As presented in the Chapter 2, peeling can engender both cohesive or adhesive failures. The latter has been mostly encountered when studying the debonding prop-agation of thin PSA [15,78,77,54,55].
Peeling can be realized at different peeling velocities and from differ-ent angles. The PSA being soft materials, it is required to use a backing. The choice of the backing is of first interest. It must be stiff to prevent the debonded part of the adhesive from deforming in tension. But, it must also be elastic enough to bend without plasticizing excessively. By nature, the backing layer confines the adhesive from a fracture mechanics point of view (detail in the fracture mechanics subsection). The idea to keep in mind is that the adherence energy depends on the choice of the backing.
FIGURE1.11: Peel test modeling [78]
From peel tests, extended researches were carried out regarding the bulk fibrillation process [78, 77, 8, 13]. When flat ended probe tack test points out the creation of the fibrils from cavities nucleation, peeling focuses on mechanisms development. Thanks to instrumented peel test setups like the one presented in Chapter 2, phenomenological models have been enriched by in situ measurements [78, 77]. Recently, such tests have even provided quantitative non linear rheological explanations of those models [13].
Fracture mechanics
In terms of fracture mechanics theories, classic LEFM and NLFM theories still remain feasible under one condition: the substrate must be considered as
infinitely stiffer than the adhesive tape. A good approximation is to consider Esubstrate >100Eadhesive[18].
In the interfacial case, reversible Dupré interfacial work of adhesion [28] is written as:
w =gadhesive+gsubstrate ginter f ace (1.8) It defines the lowest thermodynamic fracture energy an interface can ex-hibit. This approach is purely elastic. If the PSA were fully elastic materials, adherence would be then equal to w.
Pioneering the domain of fracture mechanics, Griffith [41] associated the creation of a new crack to the conversion of mechanical energy into the purely elastic Dupré work of adhesion [18]. Hence, he introduced the strain energy release rate where:
G = ∂Uw ∂A
∂Uel
∂A (1.9)
This formulation set the bases for the first approach of fracture mechan-ics: the singularity based model. This model is developed under LEFM con-ditions. It stands that all the non linear mechanisms happen in a very small region at the vicinity of the crack whereas all the material bulk remains linear elastic (SSY condition). In such configuration, singularity induces a singular stress field diverging with the inverse square root of the distance r from the crack tip:
s(r) ⇠ pK
r (1.10)
where K depends on the sample loading (K ⇠pEG).
Here, the crack propagation (so the debonding for adhesive material cases) is driven by the stress intensity factor which is a material property (Kc ⇠
p
EΓ with Γ the adherence energy). If K >Kc, there is propagation. At the
equilib-rium, G=Γ.
As mentioned above, the performances are paradoxical [57]. Taking into account these dissipative mechanisms, the closest model developed was the one of Maugis et al. [65]. The amount of dissipated energy is there repre-sented by an intrinsic function f so that no other energy losses occur outside f. In those conditions, G becomes:
G =w(1+f(at.v)) (1.11)
where at is a temperature parameter and v the limit propagation velocity.
This relationship remains valid if the elastically deformed volume in the bulk can be clearly separated from the length scales of the dissipative pro-cesses. However, in most modern PSA, energy is dissipated by mechanisms
appearing in small regions BUT developed in PSA bulk [78]. In that case, Maugis et al. [65] approach is not the most relevant.
In order to couple these bulk dissipative phenomena with fracture me-chanics theories detailed above, Creton et al. [18] proposed a multiscale ap-proach represented on figure1.12.
FIGURE1.12: Schematic of a propagating crack in a soft mate-rial [18]
The bulk dissipative mechanisms such as fibrillation are now seen through the bulk dissipated energy Γ and the non linear interfacial phenomena are seen through a Γlocal. The transition between these two zones remains poorly
explained [18,22]. In this approach the physical value which drives the crack propagation is the elasto adhesive length, LEA =
Γ
E. When r⇤, the radius of
curvature of the crack tip, reaches LEA value, the crack (debonding front for
adherence) propagates. It is worth noting that LEAis an intrinsic parameter.
The schematic of the figure1.12highlights also a relevant point. Developing dissipative mechanisms in the bulk, PSA can have a theoretical dissipation region size (in red on figure1.12) larger than the sample thickness. In such sit-uation, the material cannot dissipate as much energy as it could theoretically do. The material is "mechanically confined". Taking into account such bulk dissipation region, peeling models have been based on phenomenological approaches. The first one has been proposed by Kaelble [51,52,56,53,54]. It assumes that the interface of bonding can be divided in regions of equal size which have the same linear elastic behavior (see figure1.13). The confine-ment effect is neglected as well as cavitation. This is a purely elastic model. This has been then improved by using non linear elastic springs.
FIGURE1.13: First Kaelble model
This first approach has been the groundwork for its adaptation to vis-coelastic materials taking into account for the first time the tape rheological behavior [37] in the 70’s. All the description and the length scales remained the same. Moving further, an extended model was recently provided by Vil-ley [78, 77] where, more than the only rheology, actual physical dissipative mechanisms are taken into account.
FIGURE1.14: Kaelble’s length scales [51,52]
In this configuration, some assumptions have been made. The debonding region is defined by the Kaelble zone. In a peel test, the latter defines the region where the stretch energy and the bending energy of the backing is progressively transferred to the adhesive tape. According to Kaelble’s model [51, 52], two characteristic lengths can be extracted. The first one is la. It determines the length of the first zone where the stretch energy of the backing induces a shear of the adhesive tape. Calculations based on loading energies give:
la ⇠ s
Eahb
The second characteristic length lbdescribes the length of the zone where the bending of the backing loads the adhesive tape with a progressive cleav-age loading. It is worth noticing that the following pattern accounts for a peeling at any angle (not too small [51, 52]). As well as for la, calculations based on loading energies result in:
lb ⇠ 4
s EIa
Ybbacking (1.13)
However, the definitions of Kaelble zone are questionable when it comes to describing the behavior of a material with high cavitation and fibrillation processes. In such conditions, Kaelble zone is extended thanks to the Ldr, the
length of the dissipative region (or debonding region). The comprehension of those geometrical lengths is given by the schematic of figure1.11.
We saw in this part how PSA can dissipate energy. With a sufficient inter-facial adhesion coming from molecular adhesion (see 1.2.1), the PSA highly deforms when loaded during the debonding stage. This load engenders the creation of cavities, cavitation process. They occur mostly at the inter-face with the substrate. Because materials depicted in the literature are thin (around 100 µm thick) only very few cases of bulk origins cavitation were reported. Those cavities, if the material is tough enough, form fibrils, also called fibrillation process. These fibrils, single and independent, are then loaded in uniaxial tension where their ability to dissipate energy is driven by the viscoelastic behavior of the polymer they are made of.
To visualize the importance of dissipative mechanisms, we can recall the example of chewing gum. Chewing gum adheres easily even if its bonds are weak. Its strong adhesion comes from its high viscous behaviour which can dissipate most of the energy given by the plastic deformation due to the attempted removal. In this case, the molecular adhesion is not huge but the macroscopic dissipation mechanisms amplify it enormously.
Many attempts to model the behavior of thin PSA in peeling conditions were reported and the most relevant seem to be the ones derived from the foundation-based approach of Kaelble. The lattest version described by Vil-ley et al. [78] gives a relevant starting point to study the behavior of the foam PSA.
The limits of PSA usage: when the substrate surface is altered
On the contrary to the previous situation, we saw that the PSA overall adher-ence can also be lower than the theoretical interfacial bonding performances one can expect from molecular adhesion. This situation is encountered when this molecular adhesion does not take place between the adhesive and the
![FIGURE 1.10: Tack results for thin PSA using the instrumented flat ended probe tack setup from the SIMM lab [ 18 ]](https://thumb-eu.123doks.com/thumbv2/123doknet/2894613.74073/36.892.206.652.679.1058/figure-tack-results-using-instrumented-ended-probe-setup.webp)
![FIGURE 1.12: Schematic of a propagating crack in a soft mate- mate-rial [ 18 ]](https://thumb-eu.123doks.com/thumbv2/123doknet/2894613.74073/39.892.289.639.279.638/figure-schematic-propagating-crack-soft-mate-mate-rial.webp)
![FIGURE 2.11: Foam PSA rheological behavior in low shear level regime, frequency dependency of the master curve [ 23 ]](https://thumb-eu.123doks.com/thumbv2/123doknet/2894613.74073/55.892.223.725.148.523/figure-foam-rheological-behavior-regime-frequency-dependency-master.webp)
![FIGURE 3.3: Interfacial cavitation comparison between thin PSA [ 12 ] and foam PSA.](https://thumb-eu.123doks.com/thumbv2/123doknet/2894613.74073/73.892.198.733.268.666/figure-interfacial-cavitation-comparison-psa-foam-psa.webp)