Y
IELDC
URVER
EACTION TOM
ACROECONOMICN
EWS INE
UROPE:
D
ISENTANGLING THEUS
I
NFLUENCEM. Brière and F. Ielpo
This paper analyses the response of the euro yield curve to macroeconomic and monetary policy announcements. We present a new methodology for estimating the reaction of the euro swap curve to economic news in a data-rich environment. Given the sharp degree of interdependence between euro and US rates, we propose to use the factors of the US yield curve to disentangle the daily variations in euro rates stemming from US influence and the changes resulting from European news. We highlight the importance of taking the influence of the US yield curve into account. For some of the major announcements, results differ appreciably, depending on whether this influence is integrated. We then investigate the shape of the euro term structure reaction to a range of news types, measuring which are the most important economic releases for euro financial markets. In most instances, the curve’s reaction is hump shaped, with the most significant reactions concentrated in intermediate maturities. Finally, we provide a hierarchy of the economic figures that have the strongest impact on each maturity, and show the differences in important news for the short and long end of the curve.
Keywords : announcements, news, swap rates, yield curve, interest rates, euro area.
JEL codes: E43, E52, F42
CEB Working Paper N° 07/038
2007
Université Libre de Bruxelles – Solvay Business School – Centre Emile Bernheim
ULB CP 145/01 50, avenue F.D. Roosevelt 1050 Brussels – BELGIUM
Y
IELD
C
URVE
R
EACTION TO
M
ACROECONOMIC
N
EWS IN
E
UROPE
:
D
ISENTANGLING THE
US
I
NFLUENCE
Marie Brière
Crédit Agricole Asset Management 90 Boulevard Pasteur, 75015 Paris, France
and
Solvay Business School, Université Libre de Bruxelles Avenue F.D. Roosevelt, 50, CP 145/1, 1050 Brussels, Belgium
e-mail: marie.briere@caam.com telephone: +33143239161
Florian Ielpo
Centre d’Economie de la Sorbonne 106 Bd de l’Hopital, 75013 Paris, France
e-mail: ielpo@ces.ens-cachan.fr telephone: +33158587339
Abstract
This paper analyses the response of the euro yield curve to macroeconomic and monetary policy announcements. We present a new methodology for estimating the reaction of the euro swap curve to economic news in a data-rich environment. Given the sharp degree of interdependence between euro and US rates, we propose to use the factors of the US yield curve to disentangle the daily variations in euro rates stemming from US influence and the changes resulting from European news. We highlight the importance of taking the influence of the US yield curve into account. For some of the major announcements, results differ appreciably, depending on whether this influence is integrated. We then investigate the shape of the euro term structure reaction to a range of news types, measuring which are the most important economic releases for euro financial markets. In most instances, the curve’s reaction is hump shaped, with the most significant
reactions concentrated in intermediate maturities. Finally, we provide a hierarchy of the economic figures that have the strongest impact on each maturity, and show the differences in important news for the short and long end of the curve.
Keywords : announcements, news, swap rates, yield curve, interest rates,
euro area.
JEL codes: E43, E52, F42
* The authors are grateful to Tony Bulger, Petros Migiakis, Ombretta
Signori, Daniel Stavarek and Ariane Szafarz for helpful comments and suggestions.
1. Introduction
On the financial markets it is of primary importance to understand what makes interest rates vary during a trading day. Insofar as interest rates are very heavily dependent on economic fundamentals, it is particularly important to analyse how the arrival of new information about these fundamentals is incorporated into prices. One way to detect which data are considered the most important for the markets is to measure the short term impact of announcements through their surprise effect.
The impact of news about the economy and monetary policy has already been closely studied in the US (Ederington and Lee (1993), Fleming and Remolona (1997), Balduzzi and al. (2001), Piazzesi (2005) to name a few). In Europe however, given the ECB’s relative youth and the shallow historic depth of the European data available to date, these studies remain few and relatively recent (Ehrmann and Fratzscher (2002), Goldberg and Leonard (2003), Andersson and al. (2006)). These papers highlight the fact that the European market’s peculiar feature is that it is subject to complex influences: it is impacted not only by European but also American news, by national economic figures and by the ECB’s aggregated statistics.
As a result, one key difficulty in Europe arises from the fact that it is absolutely crucial to bear in mind the influence of US interest rates on European ones. According to Ehrmann and Fratzscher (2002), Goldberg and Leonard (2003), this influence can be due to several factors: (1) the integration of financial markets and contagion effects; (2) the real macroeconomic integration of the two zones; (3) the common perception among markets that the US is the engine of world growth; and (4) the status of “leading indicators” enjoyed by US figures compared with their European equivalents.
The methodology used by the above authors to capture the American influence is to include both European and American economic announcements in the regression used to explain European interest rates. Although this methodology is a relatively simple way to take account of American influence, it has the drawback of ignoring part of the information. Notably, the US yield curve changes even in the absence of any economic announcements in the USi, and these changes in the American curve
certainly exert an influence on European rates. This partial omission of information is harmful and, as we will see below, can create biases when estimating the impact of economic announcements in Europe. This suggests that it would be a useful improvement to show the influence of the entire American yield curve on European rates, and not merely of announcements
the US alone.
nent Analysis, as a way to extract key information from rge databases.
incorporated into our gression on each maturity of European interest rates.
es. To our nowledge, no study to date has focused this analysis on Europe.
in
Bernanke and Boivin (2003) demonstrated that in a “data-rich” economic environment, it is optimal to take account of a maximum of available information, rather than concentrate on a small number of variables, even those chosen to be the most relevant. They propose to use the Stock and Watson (2002) method of dimension reduction schemes, akin to traditional Principal Compo
la
We adopt a similar approach in this paper, but we apply it to a different type of problem. The influence of American interest rates on the European curve passes through multiple channels and cannot be modelled on a simple basis. For instance, European 10-year yields are not influenced only by their US counterparts but by the entire American yield curve, starting with short rates and monetary policy (Diebold et al. (2006), Driessen et al. (2003)). One prerequisite is therefore to manage to synthesise all the information coming from day-to-day changes in the entire American yield curve, using a restricted number of factorsii that can subsequently be
re
This paper contributes to the existing literature in several ways. First, it proposes an original methodology that makes it possible to separate, within day-to-day changes in European rates, the impact due to European economic announcements from the influence of the American yield curve. This allows us to measure the impact of announcements more rigorously by limiting the bias caused by the omission of variables. A second contribution is to measure the impact of announcements on the entire swap curve. Whereas many studies focus on a single maturity to demonstrate the impact of news, it is particularly worthwhile to understand how the shape of the entire curve changes and which maturities are most sensitive to the arrival of one piece of information or another. As demonstrated by Fleming and Remolona (1999) and Guégan and Ielpo (2007) for American rates, announcements do not necessarily have the same impact on short rates as on long rat
differ appreciably, depending on whether is influence is integrated or not.
be due to our more exhaustive integration of the merican influence.
e determining factors are different for the short d long end of the curve.
we present the empirical results obtained. Lastly, in section 4 we conclude.
We examine the impact of 18 macroeconomic and monetary policy announcements on the European swap curve (maturities ranging from 3 months to 30 years) between January 2000 and July 2007, integrating the influence of American swap rates through the three first factors extracted from a Principal Component Analysis (PCA). Our empirical results highlight the importance of taking the American yield curve into account in measuring the impact of announcements in Europe. For some of the major announcements, the results in fact
th
Our findings show that only a handful of the 18 announcements have an impact on the entire yield curve, namely activity and sentiment indicators, chiefly in Germany, and European M3 money supply. ECB policy rate announcements affect only the very short segment of the curve. Unsurprisingly, we find little influence from the job figures, a result already documented in the existing literature. For price indicators, we demonstrate that the inflation figures have a relatively weak surprise effect on European interest rates, whereas the M3 money supply has a substantial impact. The latter result fits in with the crucial role of this indicator for the ECB. Our results contrast however with those previously obtained, and most of the differences appear to
A
For each announcement, we then highlight the shape of the reaction of the entire yield curve. We see very clearly that for most economic announcements, intermediate maturities concentrate the most striking reactions. The short end of the curve (less than 1 year) or the very long end (more than 15 years) generally shows a much weaker reaction, causing a hump shape in the curve. This clearly reveals investors’ expectations of the monetary authorities’ reaction to economic news. Finally we provide a hierarchy of the economic figures that have the strongest impact on the 16 maturities, showing that th
an
This paper is organised as follows. In section 2 we describe the data and methodology used. In section 3
2. Data and methodology
This section presents our methodology and the associated dataset. We first discuss our motivations, before presenting the methodology used to capture the euro bond market reaction to macroeconomic news. Finally, we detail the dataset used in the article.
2.1.
Announcements and surprises in a data-rich
environment
Several US macroeconomic announcements are known to impact the euro yield curve (Ehrmann and Fratzscher (2002)). Moreover, euro rates display a very high correlation with US rates. Therefore, neglecting the US component when analysing variations in euro rates will naturally lead to problems of omitted variablesiii. The difficulty in treating US information comes from its nature: at present there is an abundance of news on the US market, not all of it quantitative.
Empirical studies such as Balduzzi et al. (2001) and Guégan and Ielpo (2007) present evidence that the number of economic news items that actually impact on the US yield curve can be substantial. Moreover, important US news is not limited to economic figures, but also extends to many other types of intelligence, some of which cannot be reduced to figures, such as central bankers’ speeches (Brière (2006)). Thus, the real number of US economic news items to be considered when disentangling US influence from euro rates can be too large to be taken properly into account. To a great extent, US rates can be understood as a summary of the news that is important to the market. Nonetheless, the US yield curve is made up of a large number of maturities: choosing those that best account for US yield curve movements can be tricky. Thus, we are confronted with a “data-rich” environment: the number of possible explanatory variables can be larger than the number of observations itself, given the length of the euro rate dataset.
Situations of this kind can be treated with factor-based methods, such as Principal Component Analysis (PCA), as presented in Stock and Watson (2002). For example, when trying to find the factors that actually explain the variations of the Federal Reserve’s target rate, Bernanke and Boivin (2003) proposed using a few factors obtained from a PCA to summarize the huge amount of economic information with which monetary policy makers are confronted. Here, we argue that methods of this kind are particularly suited
to our problem. PCA has been applied to interest rates in many papers following the seminal work of Litterman and Scheinkman (1991), which first underlined the existence of three main factors driving most yield curve movementsiv.
Thus, we propose to take into account the US component in euro rate movements using the first three factors of a PCA analysis of the corresponding US rates and introducing them as explanatory variables of euro rates into the usual linear model used to measure the surprise impact. This way, we are likely to capture most of the US influence on the European yield curve, without using an excessive number of explanatory variables that could quickly undermine the robustness of the estimations.
2.2. General methodology
We propose to estimate a version of the Balduzzi et al. (2001) model, refined and augmented with the US yield curve factors obtained with a PCA performed over a daily yield curve dataset.
Suppose we observe J types of macroeconomic announcements (on a monthly or quarterly basis). For each announcement
j
=
1
,...,
J
, there is a consensus forecast given by the median of an economist’s survey (see section 2.3 for further details). Let be this forecast at timet
for the announcementt i
F
,j
and be the realized announcement. We define the surprise t jG
,j
at timet
as: j t j t j t j F G S σ , , , − = (1)where
σ
jis defined as the standard error of the economic surprises calculated on the whole samplev. This scaling procedure enables us to compare the results between surprises (Balduzzi et al. (2001), Andersson et al. (2006)).Surprises are used as explanatory factors of the daily variation of rates for a given maturity. Let
R
tEU,τ be the daily closing swap rate of maturityτ
ondate
t
. Then, the linear model presented in Balduzzi et al. (2001) can be stated as follows: τ τ τ τα
β
ε
, 1 , , , , 1 ,1
t J j t j t j j EU t EU tR
S
R
−
=
+
∑
+
= − (2)where 1j,t =1 if the surprise is released on date j tand 0 if not. For a given τ ,
ε
t,τ−
1
is a Gaussian white noise.
We can improve this standard model by adding dummy variables to capture daily effects. After running different tests, we elected to use a single "Friday effect", which is highly significant (see Table 5 in part 3.1). The second modification made to the canonical model of Balduzzi et al. (2001) consisted in taking into account the very high autocorrelation identified in the time series of daily variations in swap rates. This was done by adding their lagged increment to the standard linear model, which thus becomes:
τ τ τ τ τ τ τ τ α β γ , , ρ, 1, 2, ε, 1 , , , , 1 , 1 j 1fridayt j ( tEU tEU ) t J j t j t j j EU t EU t R S R R R = + + + − − − + = −
∑
(3)with friday,t =1 if t is a Friday and 0 otherwise.
Finally, we propose to add to this model the factorsfi,t, i=1,2,3, obtained from the PCA performed on US rates. Let be the matrix of the daily variations in interest rates for each of the US maturities available, ie.: US R Δ
[
US]
t US t US R R R = ,τ − −1,τ Δ ∀t,τLet be the correlation matrix associated with the series in . Given that meets the standard conditions for the Spectral Theorem to apply, it can be decomposed as:
US R Δ C C D D C= Λ
where Λ=diag(λ1,...,λp) D
the ordered eigenvalues matrix, when has rank , and is the matrix whose columns contain the associated eigenvectors. We recall that the PCA factors are composed as :
C p i US i R D f =Δ
where Diis the ith column of the matrix D.
(
)
′ = i i in
i f f f
f ,1 ,2 ... , , for
a sample of size n, where is the value at time t for the ith factor. For further details on PCA, see Tsay (2002).
t i
f
,With these settings in mind, the model specified in equation (3) can be augmented the following way :
τ τ τ τ τ τ τ τ α β γ ρ δ ε, 3 1 , , 2 , 1 , , , 1 , , , , 1 , 1 1 ( ) t i t i i EU t EU t j t friday j J j t j t j j EU t EU t R S R R f R − = +
∑
+ + − +∑
+ = − − = − (4) Thus the three factors summarise the information in the US yield curve and are the same for all the maturities in the European curve. As we will now show, these three factors, i.e. the level, slope and curvature of the American curve, have a major impact on almost all the maturities in the European curve.i
f
As the interest rate datasets usually display a form of autoregressive variance (Ehrmann and Fratzscher (2002)), we thus allow
ε
t,τto follow a GARCH(1,1) process, making it possible to account for heteroscedasticity in our dataset. Our model can be consistently estimated by Generalized Least Squares, thus taking into consideration non-spherical innovations. According to the Zellner theorem, whose assumptions are satisfied here, this is equivalent to estimating these equations either simultaneously or maturity by maturity. We have opted for the second approach because it is numerically easier to implement.2.3. Data
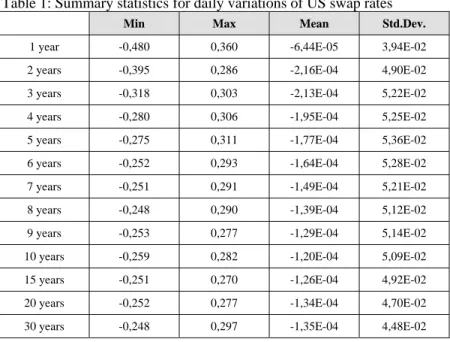
The US rate dataset contains daily swap rates with maturities ranging from 1 to 30 years used to compute the PCA factors. Our sample period covers the period 2 January 2000 – 30 July 2007, including each business day. Table 1 presents descriptive statistics of the daily changes in US swap rates, for selected maturities.
Table 1: Summary statistics for daily variations of US swap rates
Min Max Mean Std.Dev.
1 year -0,480 0,360 -6,44E-05 3,94E-02 2 years -0,395 0,286 -2,16E-04 4,90E-02 3 years -0,318 0,303 -2,13E-04 5,22E-02 4 years -0,280 0,306 -1,95E-04 5,25E-02 5 years -0,275 0,311 -1,77E-04 5,36E-02 6 years -0,252 0,293 -1,64E-04 5,28E-02 7 years -0,251 0,291 -1,49E-04 5,21E-02 8 years -0,248 0,290 -1,39E-04 5,12E-02 9 years -0,253 0,277 -1,29E-04 5,14E-02 10 years -0,259 0,282 -1,20E-04 5,09E-02 15 years -0,251 0,270 -1,26E-04 4,92E-02 20 years -0,252 0,277 -1,34E-04 4,70E-02 30 years -0,248 0,297 -1,35E-04 4,48E-02
The euro swap rate dataset is constructed in the same way, including daily swap rates for the same maturities. To these rates, we add cash Euribor rates for maturities of 3 months, 6 months and 9 months to take into account the very short end of the yield curve. Table 2 presents summary statistics for selected maturities of the daily changes in euro rates.
Table 2: Summary statistics for daily variations of euro swap rates
Min Max Mean Std.Dev.
3 months -0,358 0,159 4,36E-04 1,48E-02 6 months -0,266 0,177 3,77E-04 1,69E-02 9 months -0,211 0,187 3,17E-04 2,11E-02 1 year -0,123 0,142 2,14E-04 2,44E-02 2 years -0,145 0,196 8,55E-06 3,36E-02 3 years -0,154 0,360 -1,16E-04 3,63E-02 4 years -0,215 0,207 -2,10E-04 3,69E-02 5 years -0,216 0,210 -2,65E-04 3,68E-02 6 years -0,205 0,207 -3,14E-04 3,60E-02 7 years -0,144 0,202 -3,48E-04 3,42E-02 8 years -0,147 0,200 -3,79E-04 3,36E-02 9 years -0,155 0,202 -4,00E-04 3,32E-02 10 years -0,150 0,197 -4,14E-04 3,28E-02 15 years -0,157 0,184 -4,66E-04 3,25E-02 20 years -0,164 0,178 -4,77E-04 3,19E-02 30 years -0,163 0,189 -4,89E-04 3,14E-02
It should be noted that in the US and Europe, the change in long rates is negative on average during the period under review because, on the whole, they have declined. For short rates with maturities under three years, the results differ between the two zones: they have declined on average in the US but not in Europe. The reason for this is monetary policy differences, with the Fed cutting its interest rates much more sharply than the ECB during the period 2000-2004.
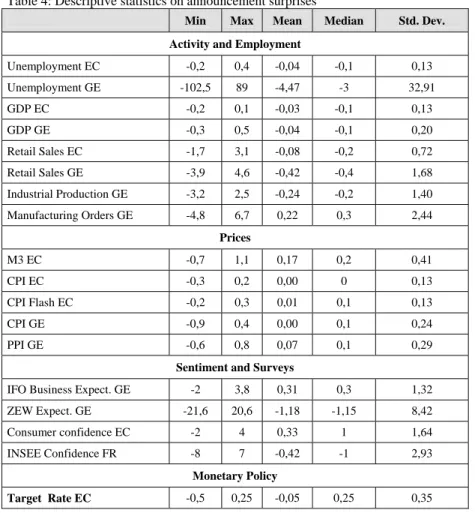
Table 3 presents the list of macroeconomic releases used as explanatory variables in the linear model specified by equation (4). These figures are obtained from the Bloomberg calendar presented in detail in Guégan and Ielpo (2007). This calendar presents the economic figures that are known to be monitored by financial market participants. It includes the release dates of the news, along with the Bloomberg consensus forecast and the economic figure finally released. Table 4 provides descriptive statistics on surprises. As discussed in Guégan and Ielpo (2007), we use the actual release figure, as opposed to the revised figure: most economic news is first announced on a crude basis by the statistics agencies, then refined during the following announcements. This data vintage problem is particularly important when estimating reaction functions as presented in equation (4): market participants are known to react to the first release.
Table 3: List of announcements investigated
Activity and
Employment Prices Sentiment and Surveys
Monetary Policy Unemployment EC Money Supply M3
EC
IFO Business Expectations GE
Target Rate EC Unemployment GE CPI EC ZEW Expectations GE
GDP EC CPI Flash EC Consumer confidence EC GDP GE CPI GE INSEE Confidence FR Retail Sales EC PPI GE
Retail Sales GE Industrial production GE Manufacturing orders GE
Table 4: Descriptive statistics on announcement surprises
Min Max Mean Median Std. Dev.
Activity and Employment
Unemployment EC -0,2 0,4 -0,04 -0,1 0,13 Unemployment GE -102,5 89 -4,47 -3 32,91 GDP EC -0,2 0,1 -0,03 -0,1 0,13 GDP GE -0,3 0,5 -0,04 -0,1 0,20 Retail Sales EC -1,7 3,1 -0,08 -0,2 0,72 Retail Sales GE -3,9 4,6 -0,42 -0,4 1,68 Industrial Production GE -3,2 2,5 -0,24 -0,2 1,40 Manufacturing Orders GE -4,8 6,7 0,22 0,3 2,44 Prices M3 EC -0,7 1,1 0,17 0,2 0,41 CPI EC -0,3 0,2 0,00 0 0,13 CPI Flash EC -0,2 0,3 0,01 0,1 0,13 CPI GE -0,9 0,4 0,00 0,1 0,24 PPI GE -0,6 0,8 0,07 0,1 0,29
Sentiment and Surveys
IFO Business Expect. GE -2 3,8 0,31 0,3 1,32 ZEW Expect. GE -21,6 20,6 -1,18 -1,15 8,42 Consumer confidence EC -2 4 0,33 1 1,64 INSEE Confidence FR -8 7 -0,42 -1 2,93 Monetary Policy Target Rate EC -0,5 0,25 -0,05 0,25 0,35
3. Results
3.1. European figures impacting fixed-income markets
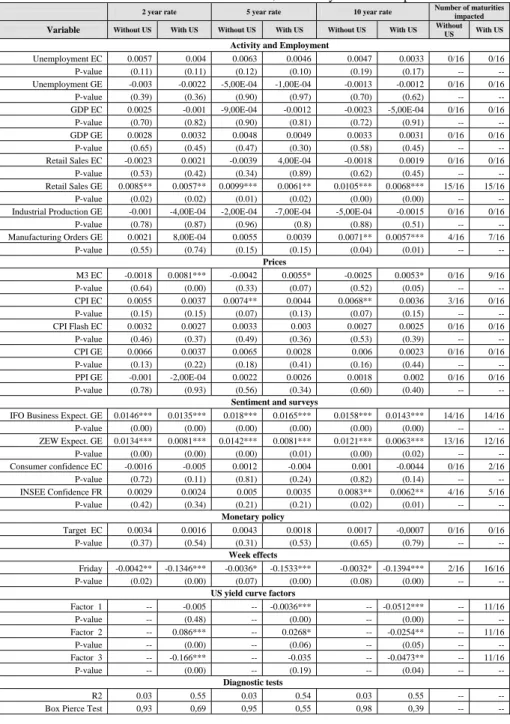
For each of the 16 interest-rate maturities, we carried out the regressions presented in the previous section. Table 5 recapitulates the impact of our 18 economic announcements on 3 key maturities in the yield curve: 2, 5 and 10 rates, with and without introducing the 3 American factors to the regressions.
Table 5: Influence of the announcements on 2, 5 and 10 year euro swap rates
2 year rate 5 year rate 10 year rate
Number of maturities impacted
Variable Without US With US Without US With US Without US With US Without US With US
Activity and Employment
Unemployment EC 0.0057 0.004 0.0063 0.0046 0.0047 0.0033 0/16 0/16 P-value (0.11) (0.11) (0.12) (0.10) (0.19) (0.17) -- -- Unemployment GE -0.003 -0.0022 -5,00E-04 -1,00E-04 -0.0013 -0.0012 0/16 0/16
P-value (0.39) (0.36) (0.90) (0.97) (0.70) (0.62) -- -- GDP EC 0.0025 -0.001 -9,00E-04 -0.0012 -0.0023 -5,00E-04 0/16 0/16
P-value (0.70) (0.82) (0.90) (0.81) (0.72) (0.91) -- -- GDP GE 0.0028 0.0032 0.0048 0.0049 0.0033 0.0031 0/16 0/16
P-value (0.65) (0.45) (0.47) (0.30) (0.58) (0.45) -- -- Retail Sales EC -0.0023 0.0021 -0.0039 4,00E-04 -0.0018 0.0019 0/16 0/16
P-value (0.53) (0.42) (0.34) (0.89) (0.62) (0.45) -- -- Retail Sales GE 0.0085** 0.0057** 0.0099*** 0.0061** 0.0105*** 0.0068*** 15/16 15/16
P-value (0.02) (0.02) (0.01) (0.02) (0.00) (0.00) -- -- Industrial Production GE -0.001 -4,00E-04 -2,00E-04 -7,00E-04 -5,00E-04 -0.0015 0/16 0/16
P-value (0.78) (0.87) (0.96) (0.8) (0.88) (0.51) -- -- Manufacturing Orders GE 0.0021 8,00E-04 0.0055 0.0039 0.0071** 0.0057*** 4/16 7/16
P-value (0.55) (0.74) (0.15) (0.15) (0.04) (0.01) -- -- Prices M3 EC -0.0018 0.0081*** -0.0042 0.0055* -0.0025 0.0053* 0/16 9/16 P-value (0.64) (0.00) (0.33) (0.07) (0.52) (0.05) -- -- CPI EC 0.0055 0.0037 0.0074** 0.0044 0.0068** 0.0036 3/16 0/16 P-value (0.15) (0.15) (0.07) (0.13) (0.07) (0.15) -- -- CPI Flash EC 0.0032 0.0027 0.0033 0.003 0.0027 0.0025 0/16 0/16 P-value (0.46) (0.37) (0.49) (0.36) (0.53) (0.39) -- -- CPI GE 0.0066 0.0037 0.0065 0.0028 0.006 0.0023 0/16 0/16 P-value (0.13) (0.22) (0.18) (0.41) (0.16) (0.44) -- -- PPI GE -0.001 -2,00E-04 0.0022 0.0026 0.0018 0.002 0/16 0/16 P-value (0.78) (0.93) (0.56) (0.34) (0.60) (0.40) -- --
Sentiment and surveys
IFO Business Expect. GE 0.0146*** 0.0135*** 0.018*** 0.0165*** 0.0158*** 0.0143*** 14/16 14/16 P-value (0.00) (0.00) (0.00) (0.00) (0.00) (0.00) -- -- ZEW Expect. GE 0.0134*** 0.0081*** 0.0142*** 0.0081*** 0.0121*** 0.0063*** 13/16 12/16 P-value (0.00) (0.00) (0.00) (0.01) (0.00) (0.02) -- -- Consumer confidence EC -0.0016 -0.005 0.0012 -0.004 0.001 -0.0044 0/16 2/16 P-value (0.72) (0.11) (0.81) (0.24) (0.82) (0.14) -- -- INSEE Confidence FR 0.0029 0.0024 0.005 0.0035 0.0083** 0.0062** 4/16 5/16 P-value (0.42) (0.34) (0.21) (0.21) (0.02) (0.01) -- -- Monetary policy Target EC 0.0034 0.0016 0.0043 0.0018 0.0017 -0,0007 0/16 0/16 P-value (0.37) (0.54) (0.31) (0.53) (0.65) (0.79) -- -- Week effects Friday -0.0042** -0.1346*** -0.0036* -0.1533*** -0.0032* -0.1394*** 2/16 16/16 P-value (0.02) (0.00) (0.07) (0.00) (0.08) (0.00) -- --
US yield curve factors
Factor 1 -- -0.005 -- -0.0036*** -- -0.0512*** -- 11/16 P-value -- (0.48) -- (0.00) -- (0.00) -- -- Factor 2 -- 0.086*** -- 0.0268* -- -0.0254** -- 11/16 P-value -- (0.00) -- (0.06) -- (0.05) -- -- Factor 3 -- -0.166*** -- -0.035 -- -0.0473** -- 11/16 P-value -- (0.00) -- (0.19) -- (0.04) -- -- Diagnostic tests R2 0.03 0.55 0.03 0.54 0.03 0.55 -- --
Box Pierce Test 0,93 0,69 0,95 0,55 0,98 0,39 -- --
***,**,* significant up to respective thresholds of 1%, 5% and 10%, (p-values) in brackets.
Our first observation is that the introduction of the 3 first PCA factors extracted from the American yield curve in the regression changes the impact of European announcements, a sign that the omission of these variables generates a true bias. It also reduces the standard error of our coefficientsvi. The impact of European CPI diminishes when we introduce the American factors: it becomes non significant for most of the maturities. For the M3 money supply figure, the difference is even more striking, since for 9 of the yield maturities, the coefficient goes from being non significant (and negative) without counting the American influence to significant when this influence is factored in. The same applies to the European consumer confidence reading, which becomes significant for 3 maturities, whereas beforehand it was not. We note that the amplitude of the impact is twice as great for the ZEW when the American influence is factored in.
In all, 6 announcements significantly impact the entire European yield curvevii (5% threshold): 2 activity figures (German manufacturing orders and retail sales), a price indicator (the M3 money supply) and 3 “sentiment” indicators (IFO and ZEW in Germany, and INSEE’s measure of consumer confidence in France).
If we compare our results with those of the existing literature (Ehrmann and Fratzscher (2002), Goldberg and Leonard (2003), Andersson and al. (2006)) we once again find a strong influence from “economic sentiment” figures (ZEW and IFO most of all), plus a very restricted number of activity indicatorsviii. In our study, however, we note a much more significant influence of German retail sales. This may be due to the fact that the period we are studying is slightly more recent, when the weakness of German domestic demand was a genuine market worry. We also find little influence of the job indicators, as noted by Andersson and al. (2006), mainly due to the markets’ prior knowledge of German pre-scheduled releases.
Among the national sentiment figures, the German ones have the greatest impact. The IFO and ZEW indicators have an impact on the entire yield curve whereas French consumer confidence impacts the long end of the curve only. German statistics play a much greater role than the aggregated European data, for two main reasons: first, the German economy’s very important role within the European Union in the eyes of the markets; and second, the aggregated European statistics are always
published later than national statistics, adding only a small amount of additional information when they come out.
The main difference between our results and existing studies has to do with the price indicators. Previous studies highlighted the markets’ weak reaction to announcements of the M3 money supply, though this is one of the ECB’s pillars. Our results are different, showing that taking account of the American yield curve influence changes this result. It highlights a real impact of the M3 money supply on rates, a much more important one than that of the inflation indicators themselves. This result is in line with the importance of this indicator for the ECB, stressed in most central bankers’ speeches, and the testimony of investors on this subject. The weak influence of euro and national inflation figures, even if the CPI is one of the explicit targets of the ECB, is probably due to the fact that euro inflation is pretty well anticipated by economists and markets (moreover for European figures they know prior releases of German and Italian data).
Table 6 present the figures which have a significant impact on rates for 8 maturities (3 and 6 month, 2, 5, 10, 15, 20 and 30 years) in the curve. We note the significant figures above the 10% thresholds. Announcements have been classified by the size of their market impact on yields.
Table 6: Classification of the most important figures for selected maturities of euro rates
Rank 3M 6M 2Y 5Y
1 Target Rate EC* Retail sales GE*** IFO Business Expect. GE***
IFO Business Expect. GE*** 2 Manufacturing
Orders GE*
IFO Business Expect.
GE* M3 EC***
ZEW Expect. GE*** 3 -- M3 EC** ZEW Expect. GE*** Retail sales GE** 4 -- -- Retail sales GE** M3 EC* 5 -- -- -- Unemployment
EC*
Rank 10Y 15Y 20Y 30Y
1 IFO Business Expect. GE***
IFO Business Expect. GE***
IFO Business Expect. GE***
IFO Business Expect. GE*** 2 Retail sales GE*** Retail sales GE** Retail sales GE*** Retail sales GE** 3 ZEW Expect.
GE** ZEW Expect. GE** ZEW Expect. GE**
Manufacturing Orders GE** 4 INSEE Confidence FR** Manufacturing Orders GE** Manufacturing
Orders GE** ZEW Expect. GE* 5 Manufacturing Orders GE** INSEE Confidence FR* INSEE Confidence FR* M3 EC* 6 M3 EC** M3 EC* CPI EC* --
7 -- -- Unemployment EC* --
It is worth noting that the determining factors are different for the short and long end of the curve. For virtually all maturities from the 5 year rate, the 4 most important indicators for the markets are the Germany’s IFO, ZEW, retail sales and manufacturing orders. Note that France’s INSEE consumer confidence figures have virtually a weak impact only on long rates (between 7 and 20 years). A set of different figures appear for short term rates (less than 5 years), namely the money supply and the German retail sales. Target rates have a weakly significant impact only on the very short end of the curve (3 month rate).
Comparison with results obtained in the US in recent years (Fleming and Remolona (1999), Balduzzi and al. (2001), Piazzesi (2005), Guégan and Ielpo (2007)) highlight differences and similarities with the American economy. Activity and economic sentiment indicators take on very great importance in both zones, while (for the reason mentioned above) employment indicators, though very important within the US, have no impact in Europe. Another key difference is the fact that, inflation figures have barely any impact in Europe over the period under study, whereas they are of crucial importance in the US. They appear to have been replaced in Europe by the money supply, an indicator which the Federal Reserve does not explicitly monitor.
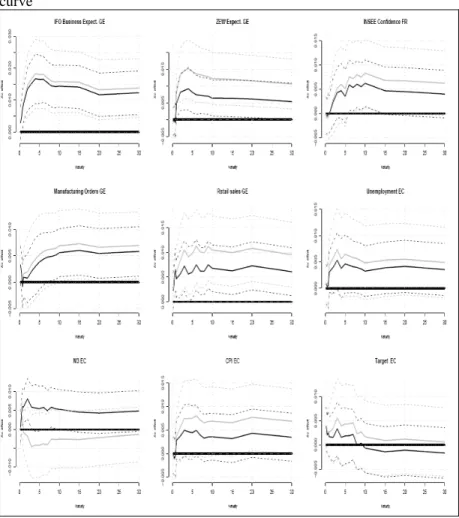
3.2. Distortion of the yield curve by announcements
For each figure which exerts a significant impact on European interest rates the above Figure 1 show the shape taken by the reaction of yield curves. Each graph synthesises the results of our 16 regression analyses by maturity. We represent in grey the impact of European economic figures measured on a “trivial” basis (i.e. without taking account of the American influence), and in black this same impact, taking account of the 3 factors from the US yield curve. Dotted lines each time indicate the 95% confidence interval.
Figure 1: Impact of significant announcements on the entire euro swap curve
The most striking stylised feature, already noted in the US by Fleming and Remolona (1999), as well as Guégan and Ielpo (2007), is the hump-shaped reaction of rates to most economic announcements. Intermediate maturities concentrate the strongest reactions. This shape is highly revealing of market participants’ expectations of the monetary authorities’ reactions to economic news. They do not expect the authorities to react at once (accounting for the weak impact on the very short end of the curve), but they think that this reaction to take the form of a gradual cycle of rises or cuts in target rates. Finally, a stronger than anticipated economic
announcement leads to a steepening of the short end of the curve, then a flattening on longer-end maturities.
Announcements of target rates have the particular feature of influencing yields only in the very short term: their impact extents only to the 3 month rates, and this reaction’s shape slopes downwards with rate maturities, becoming insignificant. All in all, a target rate increase will lead to a flatter yield curve.
It is very striking to analyse this impact, which underpins the idea that the long end of the curve’s reaction to news about monetary policy depends considerably on the markets’ view of how credibly the monetary authorities are fighting inflation. In an environment where the authorities enjoy credibility, a rise in target rates can have no impact on long term rates (currently the case in Europe) provided the markets anticipate that the effects of this decision will be to lower anticipations of long-term inflation. It can even push down long rates, as was noticed in the US. This is the well known “paradox” in monetary policy announcements highlighted by Carlstrom (1995), since he demonstrated that a rise in short rates can lead to a fall in long rates, or at least in long rates which are relatively inert to changes in short rates.
Figure 2 shows the regression coefficients for the 3 factors obtained on the American yield curve using PCA. Figure 3 in Appendix presents the 3 standard factors themselves, which account for distortions in the yield curve: parallel shift (factor 1), steepening (2) and changes in the curvature of the yield curve (3).
Interestingly, the American yield curve factors produce fairly similar effects in the USA and in Europe. An increase in the level factor causes yields to fall in both regions. Unlike in the USA, however, the impact in Europe is not uniform since long yields are affected more than short yields. It should be noted that the first US factor has virtually no impact on very short-term maturities. The short ends of the US and euro curves remain independent, and this is easily understandable since they mostly react to their own monetary policies. The slope and curvature factors are very similar in both zones: if the US curve steepens or changes in curvature, a similar movement, albeit weaker, occurs in Europe.
4. Conclusion
We have examined the impact of 18 macroeconomic and monetary policy announcements on the European swap curve (maturities of between 3 months and 30 years) for the period from January 2000 to July 2007. And we have presented an original methodology allowing the influence of the American swap curve to be integrated using the first 3 factors arising from a PCA (Principal Component Analysis).
This paper makes it possible to measure the importance the European financial markets have given to news about the ECB since its creation, and
to analyse which economic figures they find most important. Compared with the existing literature, which still provides little information about the euro zone, our paper presents the usefulness of focusing on the entire European curve and to examine it over a relatively long period of time, which has not been done to date.
Our empirical results underscore the importance of taking into account the influence of the American yield curve to measure the impact of announcements in Europe. For some statistics, we obtain different results by factoring in this impact. Our methodology has the advantage of taking into account the American influence as exhaustively as possible, unlike previous papers which restricted themselves to integrating the effects of American macroeconomic announcements on European rates.
Only a very few European economic figures influence the yield curve in Europe. We note the very important impact of German economic sentiment and activity figures, which the markets view as more important than the European aggregate statistics. Two results contrast with those obtained in the existing literature: the weak impact of inflation figures and the strong influence of the M3 money supply. As noted in the US, the curve’s reaction is hump shaped, with the most significant reactions concentrated in intermediate maturities. This shape is highly revealing of market participants’ expectations of the monetary authorities’ reactions to economic news. Participants tend to anticipate a reaction by the authorities in the medium term, assuming that a change in the economic environment will lead them to make a gradual cycle of rises or cuts in their target rates, which will not take effect immediately.
One clear limitation of this work is to take an overall view of the period under study. In fact, the influence of economic news on the markets varies by cycle period (Guégan and Ielpo (2007)) or the market’s perception of central banks’ priorities (Kearney (2002)), as demonstrated by a still small number of studies carried out in the US. The influence of the American factor is doubtless not uniform, as suggested by the results of Ehrmann and Fratzscher (2002). It would therefore be particularly worthwhile to refine our analysis by distinguishing different phases, or to study the changes in impact coefficients year on year, in order to detect any changes in the markets’ interest for each piece of news.
Bibliography
Andersson M., Hansen L.J. and Sebestyen S. (2006), “Which News Moves the Euro Area Bond Market ?”, ECB Working Paper No 631, May.
Bai, J. and Ng, S. (2002), “Determining the Number of Factors in Approximate Factor Models”, Econometrica, 70, p. 191—221.
Balduzzi P., Elton E.J. and Green T.C. (2001), “Economic News and Bond Prices: Evidence from the US Treasury Market”, Journal of Financial and Quantitative Analysis, 36, p. 523-543.
Bernanke and Boivin (2003), “Monetary Policy in a Data-Rich Environment”, Journal of Monetary Economics, 50, p. 525-546.
Brière, M. (2006), “Market Reactions to Central Bank Communication Policies: Reading Interest Rate Options Smiles”, Solvay Business School Working Paper, 06-009.
Carlstrom C. T. (1995), “A Monetary Policy Paradox”, Economic Commentary, Federal Reserve Bank of Cleveland, August.
Diebold F.X., Li C. Yue V.Z. (2006), “Global Yield Curve Dynamics and Interactions : A Generalized Nelson-Siegel Approach”, University of Pennsylvania Working Paper 74, June.
Driessen J., Melenberg B. and Nijman T. (2003), “Common Factors in International Bond Returns”;, Journal of international Money and Finance, 22 (5), p. 629-656.
Ederington L.H. and Lee J.H. (1993), “How Markets Process Information: News Releases and Volatility”, Journal of Finance, 48 (4), p. 1161-1191. Ehrmann M. and Fratzscher M. (2002), “Interdependence between the Euro Area and the US: What Role for EMU?”, ECB Working Paper No 200, December.
Fleming M.J. and Remolona E.M. (1997), “What Moves the Bond Market?”, Federal Reserve Bank of New York Economic Policy Review, p. 31-50.
Fleming M.J. and Remolona E.M. (1999), “The Term Structure of Announcement Effects”, BIS Working Paper, 71, June.
Goldberg L.S. and Leonard D. (2003), “What Moves Sovereign Bond Markets? The Effects of Economic News on US and German Bond Yields”, Current Issues in Economics and Finance, 9(9).
Guégan D. and Ielpo F. (2007), “Further Evidence on the Impact of Economic News on Interest Rates”, Centre d’Economie de la Sorbonne Working Paper, 2007-03.
Kearney A.A. (2002), “The Changing Impact of Employment Announcements on Interest Rates”, Journal of Economics and Business, 54, p. 415-429.
Litterman, R. and Scheinkman, J. (1991). “Common Factors Affecting Bond Returns”, Journal of Fixed Income, 1, p. 54–61.
Piazzesi M. (2005), “Bond Yields and the Federal Reserve”, Journal of Political Economy, 113(2), p. 311-344.
Stock J.H. and Watson M.W. (2002), “Macroeconomic Forecasting using Diffusion Indexes”, Journal of Business and Economic Statistics, 20(2), p. 147-162.
Notes
i
This may be caused by the fact that many other factors besides the economic data and announcements of base rates are likely to influence US yield curves, starting for instance with the speeches of central bankers, or changes in the prices of other assets.
ii
in order to avoid the “dimensionality curse”.
iii
This can strongly compromise the estimation results, as it leads to bias within the Generalized Least Square estimates and a loss of estimation efficiency.
iv
On the consistency of the PCA factors, see Bai and Ng (2002).
v
By normalising the surprise effect at each date, using the standard deviation of the surprises computed across the entire sample, we implicity assume the conditional variance of the surprises to be constant (an assumption satisfied empirically on our sample for most economic announcements).
vi
This is easily visible in the Figure 1 in the next section. Indeed, variable omission leads to greater variance of our estimators.
vii
We consider that the announcement affects the entire yield curve if at least 5 maturities are significantly impacted at 5%.
viii
Note that Ehrmann and Fratzscher (2002) studied the impact of announcements on monetary rates (ranging from 1 to 12 months), Goldberg and Leonard (2003) examined the rates of German treasury bonds of between 2 and 10 years, and Andersson and al. (2006) looked at the German 10 year future contract.