doi: 10.3389/fmars.2019.00533
Edited by: Alaa El-Din Hamid Sayed, Assiut University, Egypt Reviewed by: Ulas Tezel, Bo ˘gaziçi University, Turkey Danielle Philibert, University of Alberta, Canada *Correspondence: Vance L. Trudeau [email protected]; [email protected] †Present address: Lei Xing, Max Planck Institute of Molecular Cell Biology and Genetics, Dresden, Germany
Specialty section: This article was submitted to Marine Pollution, a section of the journal Frontiers in Marine Science Received: 17 April 2019 Accepted: 14 August 2019 Published: 28 August 2019 Citation: Gutierrez-Villagomez JM, Martyniuk CJ, Xing L, Langlois VS, Pauli BD, Blais JM and Trudeau VL (2019) Transcriptome Analysis Reveals That Naphthenic Acids Perturb Gene Networks Related to Metabolic Processes, Membrane Integrity, and Gut Function in Silurana (Xenopus) tropicalis Embryos. Front. Mar. Sci. 6:533. doi: 10.3389/fmars.2019.00533
Transcriptome Analysis Reveals That
Naphthenic Acids Perturb Gene
Networks Related to Metabolic
Processes, Membrane Integrity, and
Gut Function in Silurana (Xenopus)
tropicalis Embryos
Juan Manuel Gutierrez-Villagomez1, Christopher J. Martyniuk2, Lei Xing1†,
Valerie S. Langlois3, Bruce D. Pauli4, Jules M. Blais1and Vance L. Trudeau1*
1Department of Biology, University of Ottawa, Ottawa, ON, Canada,2Department of Physiological Sciences and Center for Environmental and Human Toxicology, College of Veterinary Medicine, UF Genetics Institute, University of Florida, Gainesville, FL, United States,3Institut National de la Recherche Scientifique, Centre Eau Terre Environnement, Quebec City, QC, Canada,4Ecotoxicology and Wildlife Health Division, Wildlife and Landscape Science Directorate, Science
and Technology Branch, Environment and Climate Change Canada, Ottawa, ON, Canada
Naphthenic acids (NAs) are oil-derived mixtures of carboxylic acids and are considered emerging contaminants with the potential to disrupt development of aquatic species. In the Oil Sands Region of Canada, NAs are components of the water released following processing of the bitumen-containing sand. The aim of this research was to identify potential mechanisms of toxicity of NA mixtures. Silurana (Xenopus) tropicalis embryos were raised in water spiked with commercial oil-derived NA extracts (S1 and S2) at a sub-lethal concentration (2 mg/L). The transcriptomic responses of the whole 4-day old embryos following exposure were assessed using a custom oligonucleotide microarray. Both NA mixtures induced embryonic abnormalities that included edema, and cardiac and gut abnormalities. Exposure to NAs also affected morphometric parameters and decreased total length, tail length, and interorbital distance of the embryos. Gene ontology analysis revealed that 18 biological processes, 5 cellular components, and 19 molecular functions were significantly enriched after both S1 and S2 exposures. Sub-network enrichment analysis revealed pathways that were related to phenotypic abnormalities; these included gut function, edema, and cartilage differentiation. Other notable networks affected by NAs included metabolism and cell membrane integrity. In a separate dose-response experiment, the expression of key genes identified by microarray (cyp4b1, abcg2, slc26a6, eprs, and slc5a1) was determined by Real-Time qPCR in S. tropicalis embryos exposed to the commercial NAs and to acid-extractable organics (AEOs) prepared from Oil Sands Process-Affected Water. In general, the RT-qPCR data agreed with the microarray data. In S. tropicalis embryos exposed to the AEOs, the mRNA levels of eprs (bifunctional glutamate/proline-tRNA ligase) and slcs5a1 (sodium/glucose cotransporter 1) were significantly decreased compared to
the controls. Such changes are likely indicative of increased edema and disrupted gut function, respectively. These data suggest that NAs have multiple modes of action to induce developmental toxicity in amphibians. Some modes of action may be shared between commercial NAs and AEOs.
Keywords: acid extractable organics, edema, gut abnormalities, naphthenic acids, oil sands, microarray, toxicity, Western clawed frog
INTRODUCTION
Interest in the potential toxicity of oil sands process-affected water (OSPW) emerged in the 1960s after the initiation of oil extraction activities in the oil sands region of Alberta, Canada (Grewer et al., 2010). Crude bitumen from the oil sands contains petroleum mixed with inorganic material (Government of Canada, 2013). Extraction processes require up to 2.5 barrels of water to produce one barrel of crude oil (Natural Resources Canada, 2019). The OSPW is kept in separate tailings ponds to prevent contamination of natural water sources. As of 2015, there was a total surface area of 98 km2 of tailings pond water (Environment and Parks Alberta, 2015). Frank et al. (2014) compared the chemical profile of the groundwater of the Athabasca River to OSPW and found important similarities, concluding that tailings pond water was leaching out of the ponds and into the surrounding environment.
The toxicity of the OSPW has mainly been attributed to the presence of naphthenic acids (NAs) (MacKinnon and Boerger, 1986). The O2 family is represented by classical NAs with just
one carboxylic acid group or dihydroxy groups, and published data concur that O2species are the main toxic and classical NAs
in OSPW (Morandi et al., 2015; Hughes et al., 2017; Huang et al., 2018). The term NAs refers to all the carboxylic acids present in crude oil and these are now classified as emerging water contaminants (Richardson and Ternes, 2018). Naphthenic acids have been also detected in sediments after oil spills (Aeppli et al., 2012;Wan et al., 2014), and are also used commercially in a wide range of products such as paint and ink driers, wood and fabric preservatives, fuel additives, emulsifiers and surfactants, and are used in the production of metal salts (Brient et al., 2000). There are only a few published studies that have attempted to address the mechanisms of NA toxicity in aquatic organisms. Frank et al. (2009)proposed narcosis as a mechanism of NA toxicity in Daphnia magna. Later, Marentette et al. (2017) suggested oxidative stress as a possible toxic mechanism of naphthenic acid fraction components (NAFCs) of OSPW affecting walleye (Sander vitreus) embryos. More detailed studies are needed to assess the effects and potential mechanisms of NA toxicity. Considering that there are more than 100 countries that produce petroleum, the toxicity and biological effects that may be caused by diverse NAs is of international concern.
The interest in frogs as a test organism is due to their importance in the food web, their susceptibility to pollutants and endocrine disruptors in water, and as a model for vertebrate development. Specifically, the African Western clawed frog (Silurana (Xenopus) tropicalis) is a diploid model species commonly used in the field of developmental biology and
toxicology (Rosenfeld et al., 2017). A sequenced genome and relatively high number of conserved genes compared to humans, in particular, those controlling development and associated with disease (Hellsten et al., 2010), make S. tropicalis an amenable model organism. Moreover, frogs in early developing stages are susceptible to endocrine disruptors, and studies have shown that the exposure of frogs in larval stages to stressors has effects on future morphology, such as body size, locomotor ability, and survivorship (Crespi and Denver, 2005). There have been a few articles published regarding the toxicity of NAs in frogs (Hersikorn and Smits, 2011; Smits et al., 2012; Melvin and Trudeau, 2012a,b; Melvin et al., 2013;Vu et al., 2015). In this study, we report the developmental and transcriptomic responses of S. tropicalis embryos to NAs in order to determine potential mechanisms of toxicity.
MATERIALS AND METHODS
Chemicals
Two commonly available commercial NA mixtures were purchased from Sigma-Aldrich (Cat. # 70340; lot numbers BCBC9959V and BCBK0736V), hereafter called Sigma 1 (S1) and Sigma 2 (S2), respectively. The acid extractable organic mixture (AEO) contains organic compounds from the acid extraction of an OSPW sample from Alberta, Canada. Details on the source, handling and preparation of the extract can be found in Gutierrez-Villagomez et al. (2019). The different mixtures were previously described and characterized by electrospray ionization high-resolution mass spectrometry (Gutierrez-Villagomez et al., 2019) and gas chromatography coupled to mass spectrometry (Gutierrez-Villagomez et al., 2017). The S1 and S2 are composed largely of the O2 and O4 classes. The AEO extract is composed
mainly of O2, O3, O4 (89.3%) and other species in a lower
proportion (10.7%). The O2 species proportion in the AEO
extract was estimated as 58.6%. Human chorionic gonadotropin (hCG) was purchased from Millipore. The salts used in the preparation of the FETAX solution (NaCl, NaHCO3, KCl, CaCl2,
CaSO4, and MgSO4) were purchased from Fisher Scientific. L-Cysteine was obtained from Sigma-Aldrich.
Animals and Exposure
Adult frogs originated from the University of Ottawa’sS. tropicalis colony. Adult frogs were fed daily with Nasco pellets and kept under a 12 h light/dark cycle. Embryos were obtained by injection of hCG into the posterior lymph sac of adult S. tropicalis as previously described (Langlois et al., 2010). Briefly, the frogs were injected with a priming dose of 12.5 IU of hCG into the posterior
lymph sac and moved into glass tanks with FETAX solution [Standard Guide for Conducting the Frog Embryo Teratogenesis Assay-Xenopus (FETAX)] (ASTM, 2012) with a temperature of 21.4◦
C and pH of 5.9. After 24 h, the breeding pairs were injected with a boosting dose of 100 IU of hCG and placed in glass tanks with FETAX solution with a temperature of 21.6◦
C and a pH of 5.8. The exposures were carried out according to the Frog Embryo Teratogenesis Assay Xenopus (FETAX). FETAX is a rapid test for identifying teratogenic compounds or mixtures (FETAX) (ASTM, 2012). After spawning, the embryos were collected and the jelly coat was removed by gently mixing for 3 min in a 2% w/v L-cysteine solution prepared with FETAX solution. Cleaned embryos were then moved to a tank with FETAX solution. According to Nieuwkoop and Faber (NF) staging system (Nieuwkoop and Faber, 1994), embryos at stages 9–10 were individually selected under a light microscope. Four replicates with 10 embryos were used for each treatment and were placed in 10 cm Petri dishes containing 50 mL of the NA solutions. Solutions of NAs for the different treatments were prepared daily from a stock that was kept at 4◦
C and covered from light. The stock solutions from S1 and S2 were prepared using ethanol as a solvent. The final concentration of ethanol in all of the treatments was 0.0025%. The AEO extract contained 8,050 mg/L NAs in a solution of 0.1 N of NaOH as previously reported (Gutierrez-Villagomez et al., 2019). Glassware preparation also followed (Gutierrez-Villagomez et al., 2019): 15 min soaking with hot water and detergent, rinsed twice with reverse osmosis water, later rinsed in a 10% HCl solution, rinsed twice with reverse osmosis water, rinsed with acetone (Fisher Scientific, Certified ACS grade, 99.8%), rinsed twice with reverse osmosis water and dried in an oven at 120◦
C for 3 h. The embryos were exposed to S1 and S2 at 2 mg/L as reported (Gutierrez-Villagomez et al., 2019). This concentration was selected as it induces sub-lethal effects in S. tropicalis embryos. Control embryos were placed in FETAX solution. Treatment solutions were prepared daily from a respective stock solution that was kept at 4◦
C and covered from light. Every 24 h the embryos were observed, dead embryos were removed, and the solutions were replaced to ensure concentration and water quality. The exposure was performed in a controlled light/temperature room with a 12:12 light:dark cycle. The water temperature was 25 ± 1◦
C. After 96 h of exposure, tadpoles were sampled to measure gene expression profiles. The tadpoles were anesthetized with a solution of 0.5 g/L tricaine-S [MS-222, tricaine methanesulfonate (TMS); Western, Chemical, Inc.]. Digital images of the embryos at 96 h were taken under a light stereomicroscope (Nikon SMZ 1500), with a Nikon DS-Fi1 camera and NIS Elements version 3.22.00 software. Images were used for morphometric measurements. The abnormalities were classified according to the FETAX Atlas of Abnormalities (Bantle, 1991). The care and treatment of animals used in this study were in accordance with the guidelines of the Animal Care Committee of the University of Ottawa and the Canadian Council on Animal Care.
Microarray Analysis
Four S. tropicalis larval samples for the S1 and S2 treatments were used for microarray analysis. Each sample consisted
of a pool of 10 larvae to ensure an adequate quantity of RNA. Total RNA extraction was done using RNeasy Mini Kit (Qiagen) with on-column RNase-free DNase treatment (Qiagen). RNA concentrations were determined using NanoDrop-2000 spectrophotometer (Thermo Scientific). Total RNA integrity was assessed using RNA 6000 Nano Assay Kit with the 2100 Bioanalyzer (Agilent Technologies). The RNA integrity number (RIN) for the S. tropicalis samples ranged from 8.0 to 8.8. A custom 4 × 44 K Agilent microarray developed forS. tropicalis was used to identify transcripts affected by the exposure to NA mixtures. The microarray platform is deposited in Gene Expression Omnibus (GPL15626) at NCBI and comprised 32,899 unique probes and 1417 Agilent control features (Langlois and Martyniuk, 2013). Microarray hybridization was performed according to the Agilent One-Color Microarray-Based Gene Expression Analysis protocol using Cyanine 3 (Cy3). For the production of complementary DNA (cDNA), 1µg total RNA per sample was used. The labeling protocol followed that provided by the manufacturer. Microarrays were hybridized for 17 h and washed according to the Agilent protocol. The Agilent G2600D Microarray Scanner was used for microarray scanning at 5µm. The Agilent Feature Extraction Software (v. 11.0.1.1) was used to extract the signal intensities from the TIFF microarray images. Microarray data have been deposited in the Gene Expression Omnibus (accession # GSE118736) and are MIAME compliant1.
Intensity data were imported into JMP R Genomics (Version 6.0) and data were normalized using quantile normalization. The microarray limit of detection was 2.5, as determined according to the lowest point in the standard curve and the Agilent negative controls. Thus, probes that had a signal intensity below 2.5 were filtered to a value of 2.5. Following the removal of all the control spots, the differentially expressed genes were identified using a one-way ANOVA test with a false-discovery rate of 5% (FDR = 0.05).
Bioinformatics
Any probe that showed a change with respect to the control (p < 0.05) prior to FDR adjustment in one or both treatments of NA mixtures was used to broaden the analysis of the transcriptomic responses. Clustering analysis was performed to determine if there was evidence of separation in transcriptomes among treatments. Two-way hierarchical clustering of differentially expressed probes was performed using the Fast Ward algorithm. Rows were centered to a mean of zero prior to clustering and were also scaled to a variance of one. Gene set enrichment on gene ontology (GO) terms was determined using the parametric analysis of gene set enrichment (PAGE) algorithm, which is a two-sided z-score for GO categories (Kim and Volsky, 2005). Sub-network enrichment analysis (SNEA) was performed using Pathway Studio 9.0 (Ariadne, Rockville, MD, United States) and ResNet 9.0. The SNEA uses known relationships based on expression, binding and common pathways between genes to build networks focused around gene hubs. The GenBank ID was then used for mapping human homologs in Pathway Studio; 4,572 genes were successfully
mapped. Enrichment p-value cut-off was set at p < 0.05. The analysis used the function “highest fold change, bestp-value” for duplicate probes. This bioinformatics method leverages the entire dataset regardless ofp-value and builds a distribution based on fold change to statistically test for enrichment of processes.
RNA Extraction, cDNA Synthesis, and
RT-qPCR for Microarray Validation
The samples obtained in a previous dose-response experiment (Gutierrez-Villagomez et al., 2019) were used for RT-qPCR validation of the microarray. The concentrations used for the S1 treatments for RT-qPCR analysis were 0, 2, 4, 6, and 8 mg/L. For S2, the treatments analyzed were 0, 2, 6, 8, and 12 mg/L. RNA was isolated using the RNeasy mini kit (Qiagen) as described in the manufacturer’s protocol with on-column RNase-free DNase treatment (Qiagen). Before cDNA synthesis, the concentration and quality of all samples were assessed using NanoDrop-2000 spectrophotometer (Thermo Scientific) and on an agarose gel. The quality of the RNA was indicated by the presence of two defined bands. The top band represents 28S ribosomal RNA (rRNA) and the second band represents the 18S rRNA (Aranda et al., 2012). Total cDNA was prepared using Maxima first strand cDNA synthesis kit for RT-qPCR (Thermo Scientific).
Real-time quantitative polymerase chain reaction (RT-qPCR) with SYBR green dye technology was used to validate relative gene expression. Based on the microarray results, six genes were selected for further analysis (Table 1); the ribosomal protein L8 (rpl8) gene was selected as the reference gene because it did not significantly change with exposure to NAs (Table 1) and is a ribosomal gene often used for RT-qPCR normalization (Dhorne-Pollet et al., 2013). Primers were designed using Primer-BLAST2 and synthesized by Integrated DNA Technologies
(Supplementary Table S1). To confirm the amplification of the regions of interest, the PCR products were cloned into the pGEM R
-T Easy vector (Promega, Madison, WI, United States) and sequenced using 3730 DNA Analyzer (Applied Biosystems). The Rotor-Gene SYBR Green kit (Qiagen) and Rotor-Gene Q (Qiagen) were used to amplify and detect the transcripts of interest. The thermal cycling parameters were as suggested by the manufacturer; an activation step at 95◦
C for 5 min, followed by 40 cycles of 95◦
C denaturation step for 5 s and one primer annealing temperature of 60◦
C for 10 s. After 40 cycles, a melt curve was performed over a range of 60–95◦
C with increments of 1◦
C to ensure a single amplified product. The concentration of each primer in the RT-qPCR reactions was 1µM. The efficiency of all RT-qPCR reactions was 94–107% (100.7 ± 3.4%) and the coefficient of determination (R2) was ≥ 0.99 (0.995 ± 0.004). Data were analyzed using the Rotor-Gene Q Series software (Qiagen). Analysis of outliers was performed using the ROUT method in GraphPad Prism 6 (Motulsky and Brown, 2006). The relative standard curve method was used to calculate relative mRNA abundance between samples, normalized using NORMA-GENE algorithm (Heckmann et al., 2011) and then presented as fold change of gene expression from replicates (n = 5–6; assayed in triplicate) for each group.
2https://www.ncbi.nlm.nih.gov/tools/primer-blast/ TABLE 1 | List of dif fer entially expr essed genes in Silurana (Xenopus) tropicalis exposed to NA S1 and S2 (2 mg/L) fr om micr oarray data and selected for R T-qPCR validation. Gene Human Fold p -value FDR adjusted Fold p -value FDR adjusted symbol Name pr otein ID Gene network change S1 S1 p -value S1 change S2 S2 p -value S2 cyp4b1 Cytochrome P450 4B1 P13584 Metabolism 110 .38 2.42E-10 5.0E-06 105 .21 2.66E-10 5.0E-06 abcg2 A TP-binding cassette sub-family G member 2 Q9UNQ0 Metabolism 2. 83 8.44E-07 5.4E-04 2. 62 1.66E-06 8.8E-04 Gut function slc26a6 Solute carrier family 26 member 6 Q9BXS9 Membrane integrity 2. 27 5.19E-03 9.6E-02 2. 23 5.90E-03 1.0E-01 Gut function eprs Bifunctional glutamate/proline-tRNA ligase P07814 Edema 2. 36 1.59E-03 5.4E-02 3. 54 9.79E-05 1.3E-02 slcs5a1 Sodium/glucose cotransporter 1 P13866 Membrane integrity − 2. 05 3.02E-04 2.4E-02 − 1. 78 1.34E-03 4.9E-02 Metabolism Gut function myod1 Myoblast determination protein 1 P15172 – − 4. 64 4.15E-02 2.6E-01 − 5. 65 2.50E-02 2.1E-01 rpl8 Ribosomal protein L8 P62917 – − 1. 01 8.37E-01 9.8E-01 − 1. 01 9.23E-01 1.0E + 00
Statistical Analysis
Frequencies of abnormalities were analyzed as transformed data using the arcsine square root transformation. To assess data normality and homogeneity of variance, Shapiro–Wilk’s test and Levene’s test were performed, respectively. Data that failed the normality and/or the equal variance tests were transformed (log10). One-way ANOVA and Tukey’s post hoc analyses were performed on normally distributed data. Non-parametric Kruskal–Wallis followed by Student–Newman–Keuls (SNK) tests were performed on data that did not pass normality tests. The significance level was set atα = 0.05. Statistical analysis was performed using SPSS V21 IBM and Sigma Plot 12.0.
RESULTS AND DISCUSSION
Effects of Exposure to Commercial NAs
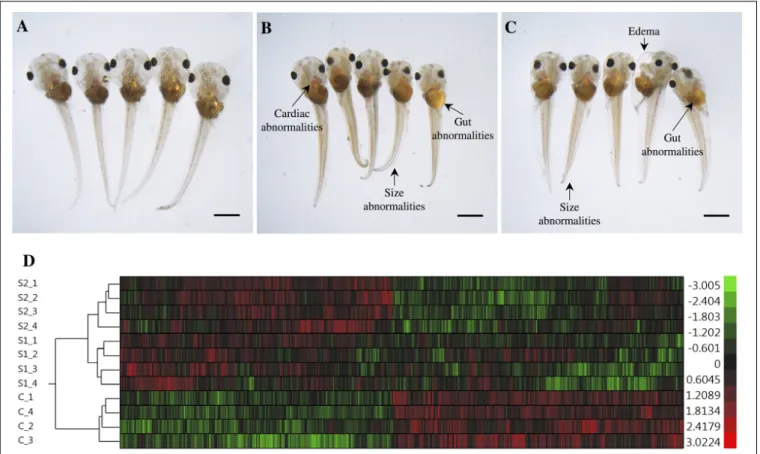
The exposures of S. tropicalis embryos to NAs at 2 mg/L resulted in a significant reduction in total length (TL), snout-vent length (SVL), tail length (TaL), and interorbital distance (IOD) (p< 0.05) (Figures 1A–C and Supplementary Figure S1). Following exposure to NAs, there was a significant increase of all abnormalities assessed. The most common were cranialabnormalities, edema, gut abnormalities, heart abnormalities, and eye abnormalities (Figures 1A–C and Supplementary
Figure S1). These types of teratogenic effects have been described in detail previously inS. tropicalis exposed to commercial extracts and AEOs in a dose-response fashion (Gutierrez-Villagomez et al., 2019). Edema and heart abnormalities have also been described in larval zebrafish (Danio rerio) exposed to AEOs extracted from oil sands from the Daqing oil exploring area (Wang et al., 2015) and larval fathead minnows (Pimephales promelas) exposed to NA fraction components (NAFCs) of OSPW from Alberta, Canada (Marentette et al., 2015). The 96 h LC50 estimates forS. tropicalis were 10.4, 11.7, and 52.3 mg/L
for S1, S2, and the AEOs, respectively (Gutierrez-Villagomez et al., 2019). The 96 h EC50 estimates based on frequencies of
developmental abnormalities in S. tropicalis were 2.1, 2.6, and 14.2 mg/L for S1, S2, and the AEOs, respectively. In fathead minnow embryos, an EC50 for hatching success of 2.5 and 7.5–
18.5 mg/L have been reported for a Sigma extract and AEOs, respectively (Marentette et al., 2015). These observations indicate that fish and frogs might have a similar sensitivity with respect to embryotoxicity in response to commercial NAs and AEOs, however, direct comparisons between taxa should be conducted to test this hypothesis.
FIGURE 1 | Photographs of Silurana (Xenopus) tropicalis indicating the main teratogenic effects induced by exposure to NAs, control (A), S1 (B), and S2 (C). Scale bar is equal to 1 mm in (A–C). Some of the observed abnormalities are indicated with arrows. Hierarchical clustering of gene expression data using gene probes that were differentially expressed (p< 0.05) in S. tropicalis embryos exposed to two mixtures of NAs (S1 and S2) during early embryonic development versus control samples (C1–4) in (D). In panel (D) columns represent individual genes and rows represent a treatment replicate. Each cell in the matrix represents the expression level of a gene feature in an individual replicate. The red or green color in cells reflects relative high or low expression levels, respectively, as indicated in the scale bar.
Gene Expression Profiling Following NA
Exposure
The microarray analysis performed on embryos of S. tropicalis exposed to S1 revealed 6,074 differentially expressed genes versus control (p < 0.05), of which 2,873 were up-regulated and 3,201 were down-regulated. A total of 894 genes passed the correction for multiple hypothesis testing (FDR < 0.05). This includes 526 up-regulated and 368 down-regulated genes. For S2-exposed animals, the analysis revealed 6,789 differentially expressed genes versus control (p< 0.05). Of these, 3,395 were up-regulated and 3,394 were down-regulated by the exposure to S2. A total of 1,177 genes passed the FDR test (FDR < 0.05). Of these, 620 were up-regulated and 557 down-regulated. There were 3,656 common genes affected by S1/S2 (p < 0.05). Of these, 564 genes passed the FDR test (FDR < 0.05). The higher number of genes significantly affected (p < 0.05) by the exposure to S2 compared to S1, indicates that S2 has a higher impact at the transcriptomic level of S. tropicalis. These results highlight that the NA composition has a direct impact on the toxicity of a mixture. The S1 and S2 are composed largely of the O2 and O4 classes. However, the composition and proportion of the components in the two mixtures is different (Gutierrez-Villagomez et al., 2019). We observed that the EC50 and EC20 for S1 are significantly
lower than for S2 (Gutierrez-Villagomez et al., 2019). In this manuscript, we observed that the two mixtures affected the transcriptome of theS. tropicalis embryos in a different manner. Thus, it is clear that subtle differences in chemical composition can have different transcriptional effects linked with differing teratogenic outcomes.
Hierarchical Analysis
The hierarchical clustering analysis of the differential expression (p < 0.05) data showed two main clades that mark the clear separation of the control samples and the two NA treatments (S1 and S2). The second clade is composed only of expression profiles from embryos exposed to the NA extracts. Treatments S1 and S2 are sister groups, indicating that these two NA mixtures affect the transcriptome of S. tropicalis in a similar, but non-identical manner. The different replicates are located in their respective cluster and there are no replicates mixed between groups, indicating a relatively strong transcriptome response to S1 and S2 (Figure 1D).
Gene Set Enrichment of Gene Ontology
(GO) Terms
In total, 64 biological processes, 25 cellular components, and 52 molecular functions were significantly enriched after S1 exposure (p < 0.05) (Supplementary Table S2). After S2 exposure, 77 biological processes, 29 cellular components, and 57 molecular functions were significantly enriched (p< 0.05) (Supplementary
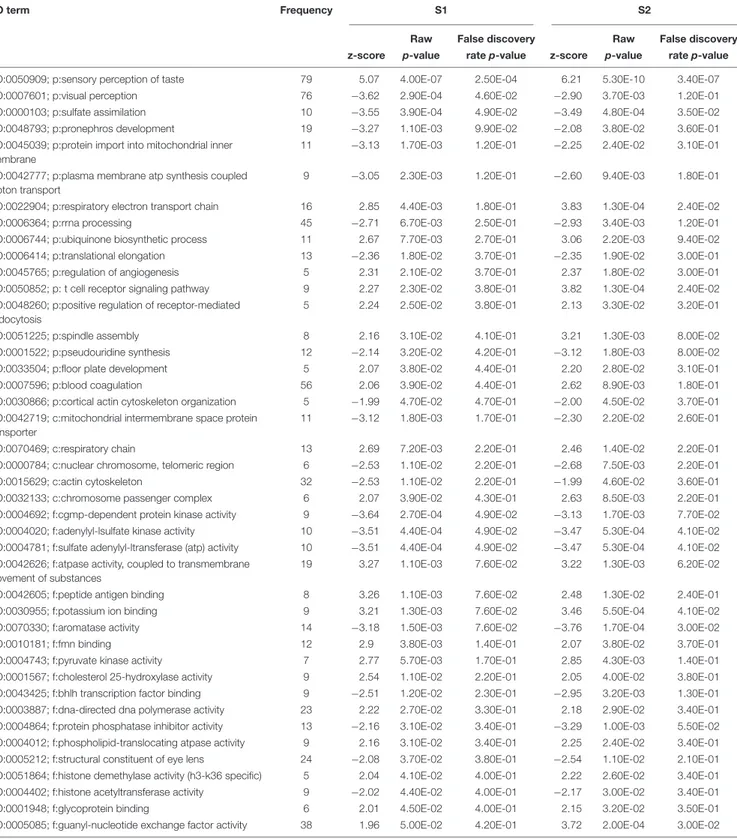
Table S3). The number of significantly enriched processes in common between S1 and S2 for each of biological process (p:), cellular component (c:) and molecular function (f:) were 18, 5, and 19, respectively (p < 0.05) (Table 2). The differences between the number of GO terms significantly enriched with
the exposure to S1 and S2 likely reflects the differences in the chemical composition of the two mixtures ( Gutierrez-Villagomez et al., 2019). The significant enrichment of GO terms, such as respiratory electron transport chain, respiratory chain, adenylyl-sulfate kinase activity, and pyruvate kinase activity indicates that NAs affect metabolism and that this could be part of the mechanism of toxicity of NAs (Table 2). “Protein import into mitochondrial inner membrane” and “mitochondrial intermembrane” GO terms were also significantly enriched (p < 0.05). These results support the hypothesis of Frank et al. (2009) who proposed that narcosis as part of the toxic mechanism of NAs. Furthermore, visual perception, structural constituent of eye lens, actin cytoskeleton, and cytoskeleton organization are GO terms significantly enriched (p< 0.05) after the exposure to S1 and S2. This may be associated with the multiple abnormalities inS. tropicalis induced by S1 and S2, such as eye and morphometric abnormalities (Figures 1A–C).
Sub-Network Enrichment Analysis
(SNEA)
Using SNEA, a total of 75 cell process and 42 disease pathways were affected by S1 exposure (p < 0.05; Supplementary
Table S4), and 66 cell process pathways and 46 disease pathways were perturbed in the embryos following S2 exposure (p< 0.05;
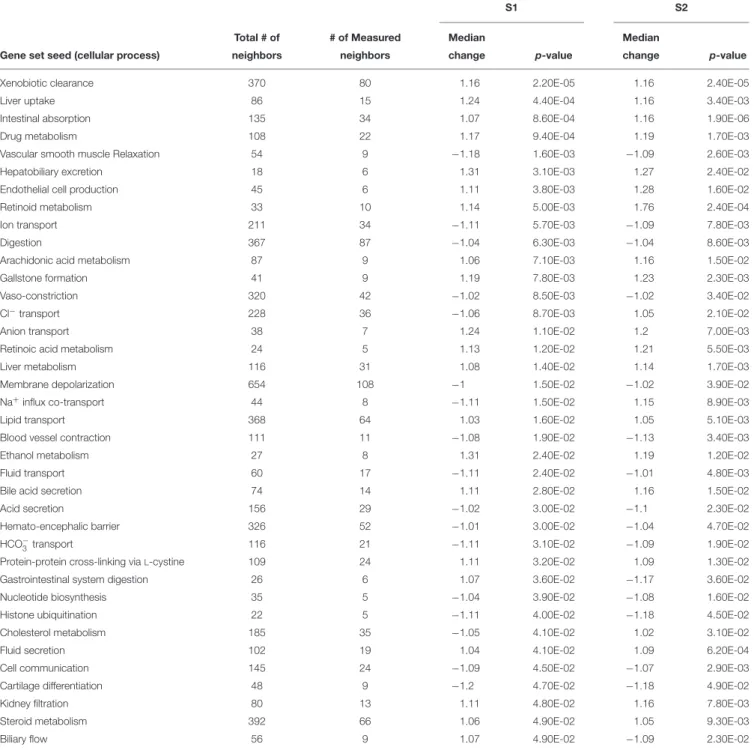
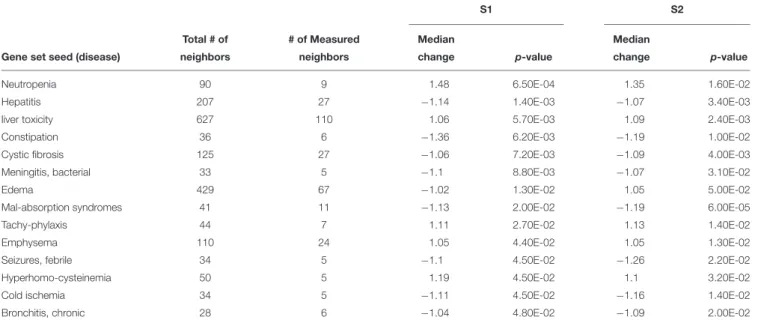
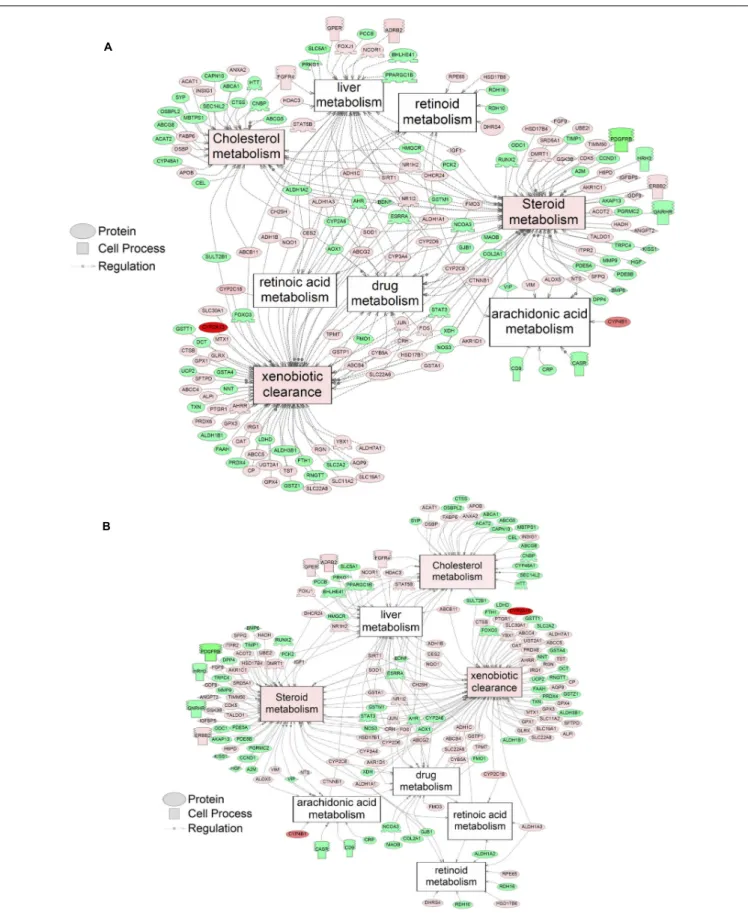
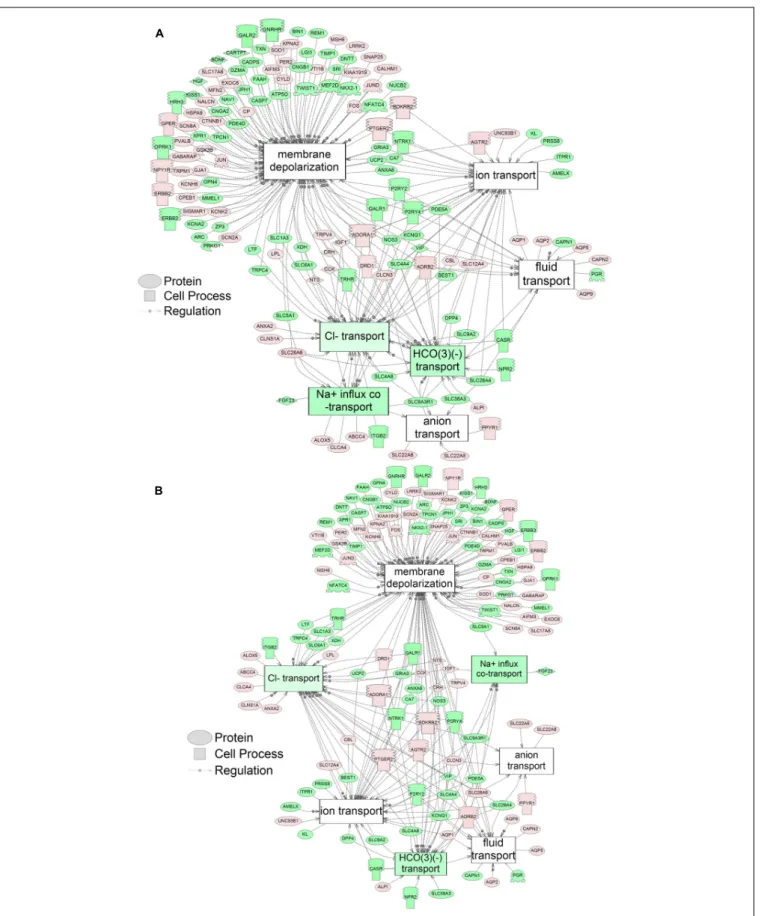
Supplementary Table S5). There were 38 cell process pathways (p< 0.05; Table 3) and 14 disease pathways (p < 0.05; Table 4) in common as perturbed by S1 and S2. Some pathways that were significantly affected by exposure to S1 (Figure 2A) and S2 (Figure 2B) included networks related to metabolism, such as liver metabolism, cholesterol metabolism, retinoid metabolism, retinoic acid metabolism, steroid metabolism, arachidonic acid metabolism, drug metabolism, and xenobiotic clearance. This corroborates the GO analysis that also indicated that metabolic processes were significantly enriched following exposure. Other pathways detected as significantly enriched were those related to membrane integrity (Figures 3A,B), such as membrane depolarization, Cl−
transport, Na+
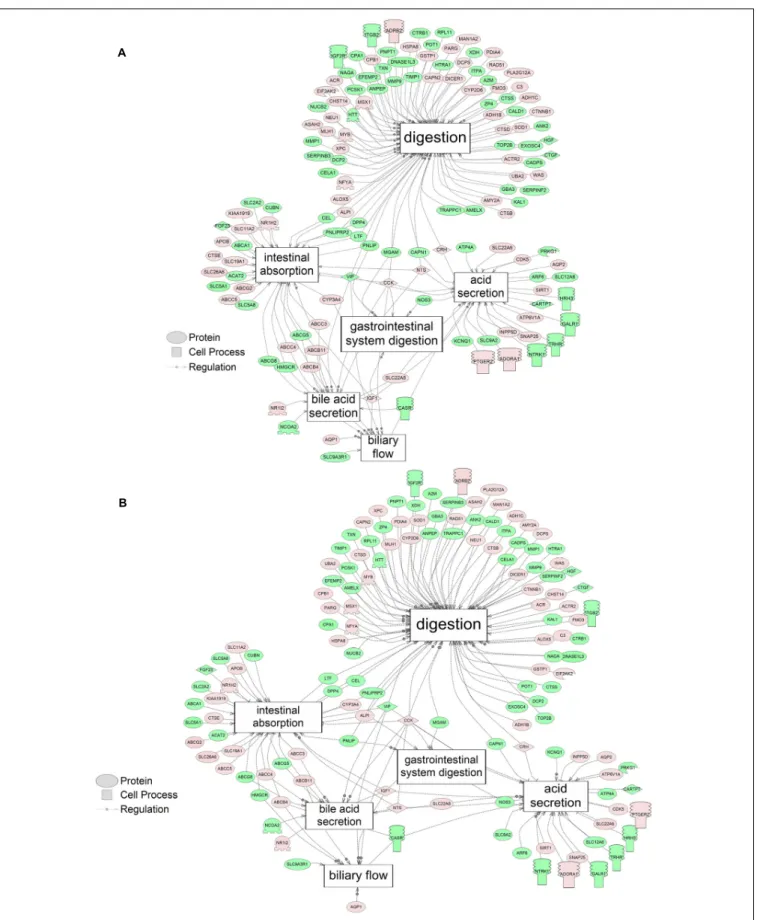
influx co-transport, ion transport, anion transport, fluid transport, and HCO−3 transport. This analysis further supports the hypothesis that toxicity of NAs is at least partially through narcosis, defined as the disruption of cell membrane function (Newman and Clements, 2007;Li et al., 2017). Others refer to this as baseline toxicity and have linked narcosis to changes in membrane potentials (Escher et al., 2002). The morphological analysis showed that NAs significantly induce gut abnormalities (Supplementary Figure S1J) in S. tropicalis embryos, and the lack of gut coiling was observed in some of the tadpoles (Figures 1A–C). Importantly, gene networks related to gut function (Figure 4), such as digestion, intestinal absorption, acid secretion, gastrointestinal system digestion, bile acid secretion, and biliary flow were significantly disrupted by exposure to NAs. Supporting this is the identification of disease pathways (Table 4) such as constipation and malabsorption syndromes, both related to gut functions. Other pathways related to the abnormalities that were observed in S. tropicalis (Figures 1A–C and Supplementary Figure S1) included cartilage differentiation and edema (Tables 3, 4).
TABLE 2 | List of gene ontology terms (biological process (p:), cellular component (c:) and molecular function (f:) altered after the exposure of S. tropicalis to both S1 and S2 using Parametric Analysis of Gene Set Enrichment (PAGE) analysis (p< 0.05).
GO term Frequency S1 S2
Raw False discovery Raw False discovery
z-score p-value rate p-value z-score p-value rate p-value
GO:0050909; p:sensory perception of taste 79 5.07 4.00E-07 2.50E-04 6.21 5.30E-10 3.40E-07
GO:0007601; p:visual perception 76 −3.62 2.90E-04 4.60E-02 −2.90 3.70E-03 1.20E-01
GO:0000103; p:sulfate assimilation 10 −3.55 3.90E-04 4.90E-02 −3.49 4.80E-04 3.50E-02
GO:0048793; p:pronephros development 19 −3.27 1.10E-03 9.90E-02 −2.08 3.80E-02 3.60E-01
GO:0045039; p:protein import into mitochondrial inner membrane
11 −3.13 1.70E-03 1.20E-01 −2.25 2.40E-02 3.10E-01
GO:0042777; p:plasma membrane atp synthesis coupled proton transport
9 −3.05 2.30E-03 1.20E-01 −2.60 9.40E-03 1.80E-01
GO:0022904; p:respiratory electron transport chain 16 2.85 4.40E-03 1.80E-01 3.83 1.30E-04 2.40E-02
GO:0006364; p:rrna processing 45 −2.71 6.70E-03 2.50E-01 −2.93 3.40E-03 1.20E-01
GO:0006744; p:ubiquinone biosynthetic process 11 2.67 7.70E-03 2.70E-01 3.06 2.20E-03 9.40E-02
GO:0006414; p:translational elongation 13 −2.36 1.80E-02 3.70E-01 −2.35 1.90E-02 3.00E-01
GO:0045765; p:regulation of angiogenesis 5 2.31 2.10E-02 3.70E-01 2.37 1.80E-02 3.00E-01
GO:0050852; p: t cell receptor signaling pathway 9 2.27 2.30E-02 3.80E-01 3.82 1.30E-04 2.40E-02
GO:0048260; p:positive regulation of receptor-mediated endocytosis
5 2.24 2.50E-02 3.80E-01 2.13 3.30E-02 3.20E-01
GO:0051225; p:spindle assembly 8 2.16 3.10E-02 4.10E-01 3.21 1.30E-03 8.00E-02
GO:0001522; p:pseudouridine synthesis 12 −2.14 3.20E-02 4.20E-01 −3.12 1.80E-03 8.00E-02
GO:0033504; p:floor plate development 5 2.07 3.80E-02 4.40E-01 2.20 2.80E-02 3.10E-01
GO:0007596; p:blood coagulation 56 2.06 3.90E-02 4.40E-01 2.62 8.90E-03 1.80E-01
GO:0030866; p:cortical actin cytoskeleton organization 5 −1.99 4.70E-02 4.70E-01 −2.00 4.50E-02 3.70E-01 GO:0042719; c:mitochondrial intermembrane space protein
transporter
11 −3.12 1.80E-03 1.70E-01 −2.30 2.20E-02 2.60E-01
GO:0070469; c:respiratory chain 13 2.69 7.20E-03 2.20E-01 2.46 1.40E-02 2.20E-01
GO:0000784; c:nuclear chromosome, telomeric region 6 −2.53 1.10E-02 2.20E-01 −2.68 7.50E-03 2.20E-01
GO:0015629; c:actin cytoskeleton 32 −2.53 1.10E-02 2.20E-01 −1.99 4.60E-02 3.60E-01
GO:0032133; c:chromosome passenger complex 6 2.07 3.90E-02 4.30E-01 2.63 8.50E-03 2.20E-01
GO:0004692; f:cgmp-dependent protein kinase activity 9 −3.64 2.70E-04 4.90E-02 −3.13 1.70E-03 7.70E-02
GO:0004020; f:adenylyl-lsulfate kinase activity 10 −3.51 4.40E-04 4.90E-02 −3.47 5.30E-04 4.10E-02
GO:0004781; f:sulfate adenylyl-ltransferase (atp) activity 10 −3.51 4.40E-04 4.90E-02 −3.47 5.30E-04 4.10E-02 GO:0042626; f:atpase activity, coupled to transmembrane
movement of substances
19 3.27 1.10E-03 7.60E-02 3.22 1.30E-03 6.20E-02
GO:0042605; f:peptide antigen binding 8 3.26 1.10E-03 7.60E-02 2.48 1.30E-02 2.40E-01
GO:0030955; f:potassium ion binding 9 3.21 1.30E-03 7.60E-02 3.46 5.50E-04 4.10E-02
GO:0070330; f:aromatase activity 14 −3.18 1.50E-03 7.60E-02 −3.76 1.70E-04 3.00E-02
GO:0010181; f:fmn binding 12 2.9 3.80E-03 1.40E-01 2.07 3.80E-02 3.70E-01
GO:0004743; f:pyruvate kinase activity 7 2.77 5.70E-03 1.70E-01 2.85 4.30E-03 1.40E-01
GO:0001567; f:cholesterol 25-hydroxylase activity 9 2.54 1.10E-02 2.20E-01 2.05 4.00E-02 3.80E-01
GO:0043425; f:bhlh transcription factor binding 9 −2.51 1.20E-02 2.30E-01 −2.95 3.20E-03 1.30E-01
GO:0003887; f:dna-directed dna polymerase activity 23 2.22 2.70E-02 3.30E-01 2.18 2.90E-02 3.40E-01
GO:0004864; f:protein phosphatase inhibitor activity 13 −2.16 3.10E-02 3.40E-01 −3.29 1.00E-03 5.50E-02
GO:0004012; f:phospholipid-translocating atpase activity 9 2.16 3.10E-02 3.40E-01 2.25 2.40E-02 3.40E-01
GO:0005212; f:structural constituent of eye lens 24 −2.08 3.70E-02 3.80E-01 −2.54 1.10E-02 2.10E-01
GO:0051864; f:histone demethylase activity (h3-k36 specific) 5 2.04 4.10E-02 4.00E-01 2.22 2.60E-02 3.40E-01
GO:0004402; f:histone acetyltransferase activity 9 −2.02 4.40E-02 4.00E-01 −2.17 3.00E-02 3.40E-01
GO:0001948; f:glycoprotein binding 6 2.01 4.50E-02 4.00E-01 2.15 3.20E-02 3.50E-01
GO:0005085; f:guanyl-nucleotide exchange factor activity 38 1.96 5.00E-02 4.20E-01 3.72 2.00E-04 3.00E-02
RT-qPCR Validation of Differentially
Expressed Genes
Five genes were selected for microarray validation and for further study based on the following characteristics: (1) both exposure to
S1 and S2 significantly altered their expression; (2) the transcripts had to be annotated and have a human homolog identified; and (3) the transcripts had to appear in the pathway analysis (Table 1). The cytochromeP450 4B1b (cyp4b1) gene encodes a
TABLE 3 | Sub-network enrichment analysis (SNEA) for common cellular processes in S. tropicalis exposed to S1 and S2 mixtures of NAs.
S1 S2
Total # of # of Measured Median Median
Gene set seed (cellular process) neighbors neighbors change p-value change p-value
Xenobiotic clearance 370 80 1.16 2.20E-05 1.16 2.40E-05
Liver uptake 86 15 1.24 4.40E-04 1.16 3.40E-03
Intestinal absorption 135 34 1.07 8.60E-04 1.16 1.90E-06
Drug metabolism 108 22 1.17 9.40E-04 1.19 1.70E-03
Vascular smooth muscle Relaxation 54 9 −1.18 1.60E-03 −1.09 2.60E-03
Hepatobiliary excretion 18 6 1.31 3.10E-03 1.27 2.40E-02
Endothelial cell production 45 6 1.11 3.80E-03 1.28 1.60E-02
Retinoid metabolism 33 10 1.14 5.00E-03 1.76 2.40E-04
Ion transport 211 34 −1.11 5.70E-03 −1.09 7.80E-03
Digestion 367 87 −1.04 6.30E-03 −1.04 8.60E-03
Arachidonic acid metabolism 87 9 1.06 7.10E-03 1.16 1.50E-02
Gallstone formation 41 9 1.19 7.80E-03 1.23 2.30E-03
Vaso-constriction 320 42 −1.02 8.50E-03 −1.02 3.40E-02
Cl−transport 228 36 −1.06 8.70E-03 1.05 2.10E-02
Anion transport 38 7 1.24 1.10E-02 1.2 7.00E-03
Retinoic acid metabolism 24 5 1.13 1.20E-02 1.21 5.50E-03
Liver metabolism 116 31 1.08 1.40E-02 1.14 1.70E-03
Membrane depolarization 654 108 −1 1.50E-02 −1.02 3.90E-02
Na+influx co-transport 44 8 −1.11 1.50E-02 1.15 8.90E-03
Lipid transport 368 64 1.03 1.60E-02 1.05 5.10E-03
Blood vessel contraction 111 11 −1.08 1.90E-02 −1.13 3.40E-03
Ethanol metabolism 27 8 1.31 2.40E-02 1.19 1.20E-02
Fluid transport 60 17 −1.11 2.40E-02 −1.01 4.80E-03
Bile acid secretion 74 14 1.11 2.80E-02 1.16 1.50E-02
Acid secretion 156 29 −1.02 3.00E-02 −1.1 2.30E-02
Hemato-encephalic barrier 326 52 −1.01 3.00E-02 −1.04 4.70E-02
HCO−
3 transport 116 21 −1.11 3.10E-02 −1.09 1.90E-02
Protein-protein cross-linking viaL-cystine 109 24 1.11 3.20E-02 1.09 1.30E-02
Gastrointestinal system digestion 26 6 1.07 3.60E-02 −1.17 3.60E-02
Nucleotide biosynthesis 35 5 −1.04 3.90E-02 −1.08 1.60E-02
Histone ubiquitination 22 5 −1.11 4.00E-02 −1.18 4.50E-02
Cholesterol metabolism 185 35 −1.05 4.10E-02 1.02 3.10E-02
Fluid secretion 102 19 1.04 4.10E-02 1.09 6.20E-04
Cell communication 145 24 −1.09 4.50E-02 −1.07 2.90E-03
Cartilage differentiation 48 9 −1.2 4.70E-02 −1.18 4.90E-02
Kidney filtration 80 13 1.11 4.80E-02 1.16 7.80E-03
Steroid metabolism 392 66 1.06 4.90E-02 1.05 9.30E-03
Biliary flow 56 9 1.07 4.90E-02 −1.09 2.30E-02
All gene set seeds that had> 10% overlap with the annotated pathways are listed (p < 0.05). The total number of neighburs refers to the total number of known entities in a sub-network.
monooxygenase enzyme that catalyzes reactions involved in the metabolism of cholesterol, steroids, and xenobiotics (Baer and Rettie, 2006). This gene forms part of a metabolism network that was significantly disrupted by NAs, specifically arachidonic acid metabolism (Figures 2A,B). Arachidonic acid is a fatty acid involved in eye and brain development (Uauy et al., 2001). The solute carrier family 26 member 6 (slc26a6) gene encodes an anion transporter protein and regulates acid-base
homeostasis (Chernova et al., 2005; Freel et al., 2009). This gene is part of networks that were disturbed by the exposure to NAs, in particular, intestinal absorption and Cl−
transport (Figures 3A,B). Furthermore,Slc26a6-null mice have defective intestinal oxalate secretion and a higher incidence of formation of stony concretions in the urinary tract (Jiang et al., 2006). The ATP-binding cassette sub-family G member 2 (abcg2) gene encodes a membrane transporter (Allikmets et al., 1998)
TABLE 4 | Sub-network enrichment analysis (SNEA) for diseases in S. tropicalis exposed to S1 and S2 mixtures of NAs.
S1 S2
Total # of # of Measured Median Median
Gene set seed (disease) neighbors neighbors change p-value change p-value
Neutropenia 90 9 1.48 6.50E-04 1.35 1.60E-02
Hepatitis 207 27 −1.14 1.40E-03 −1.07 3.40E-03
liver toxicity 627 110 1.06 5.70E-03 1.09 2.40E-03
Constipation 36 6 −1.36 6.20E-03 −1.19 1.00E-02
Cystic fibrosis 125 27 −1.06 7.20E-03 −1.09 4.00E-03
Meningitis, bacterial 33 5 −1.1 8.80E-03 −1.07 3.10E-02
Edema 429 67 −1.02 1.30E-02 1.05 5.00E-02
Mal-absorption syndromes 41 11 −1.13 2.00E-02 −1.19 6.00E-05
Tachy-phylaxis 44 7 1.11 2.70E-02 1.13 1.40E-02
Emphysema 110 24 1.05 4.40E-02 1.05 1.30E-02
Seizures, febrile 34 5 −1.1 4.50E-02 −1.26 2.20E-02
Hyperhomo-cysteinemia 50 5 1.19 4.50E-02 1.1 3.20E-02
Cold ischemia 34 5 −1.11 4.50E-02 −1.16 1.40E-02
Bronchitis, chronic 28 6 −1.04 4.80E-02 −1.09 2.00E-02
All gene set seeds that had>10% overlap with the annotated pathways are listed (p < 0.05). The total number of neighbors refers to the total number of known entities in a sub-network.
involved in the gene network of gut function, specifically in the pathway of intestinal absorption (Figures 4A,B). The bifunctional glutamate/proline-tRNA ligase (eprs) gene encodes for the enzyme that charge tRNA with glutamate and proline (Young et al., 2016). It was selected because the SNEA showed that this gene is related to edema in S. tropicalis embryos (see Table 1). The sodium/glucose cotransporter 1 (slc5a1) gene encodes a sodium-dependent glucose transporter (Wright et al., 1994) and it is involved in several networks affected by NAs, such as liver metabolism, membrane depolarization, Na+
influx co-transport, and intestinal absorption (Figures 2–4). Lee et al. (1994) reported that slc5a1 is highly expressed in the intestine and in lower levels in liver in rat, where its function is the uptake of glucose (Turk et al., 1991). Also, the mutation of the slc5a1 gene can induce severe diarrhea and dehydration in humans (Lam et al., 1999). These five genes appear to be associated with the significant increase (p< 0.05) of phenotypic abnormalities in S. tropicalis embryos, such as gut abnormalities, eye abnormalities, and edema (Figures 1A–C and Supplementary Figure S1). The myod1 gene was selected because it changed significantly with both S1 and S2 treatments and is linked to myogenesis and muscle differentiation (Weintraub et al., 1991). Therefore, it may be associated with the significant decrease of TL, SVL, TaL, and IOD of S. tropicalis exposed to NAs (Figures 1A–C and
Supplementary Figure S1).
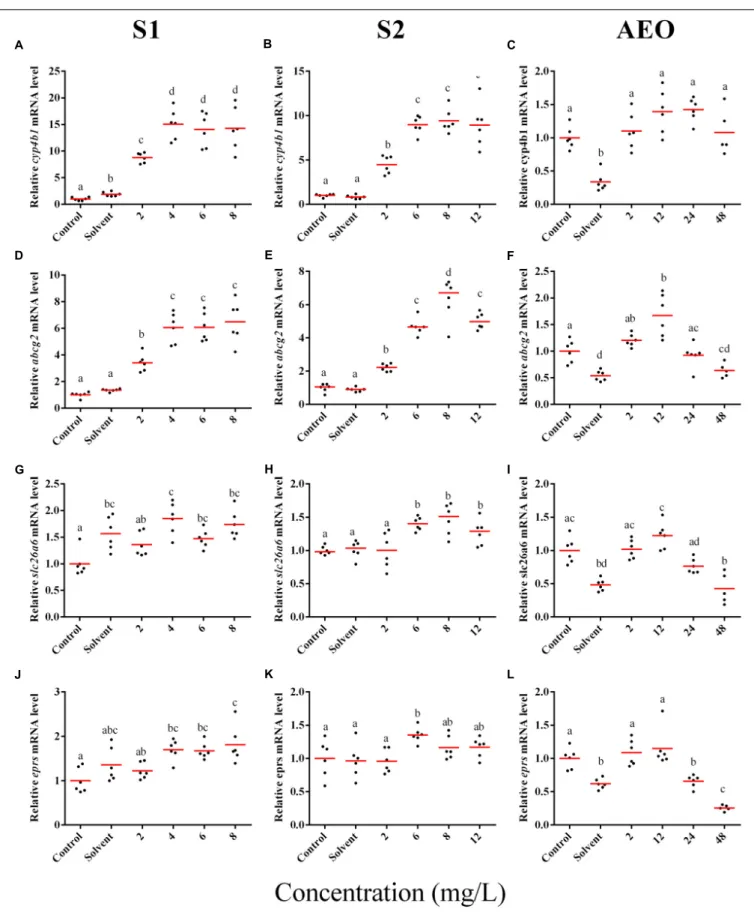
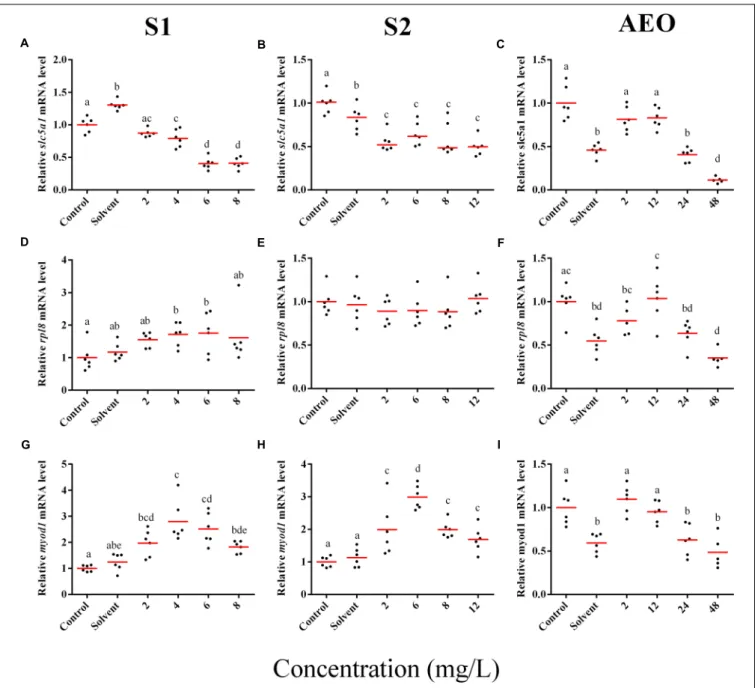
In general, the expression obtained by microarray analysis and RT-qPCR were similar in direction of change (Figures 5, 6 and Table 1). The genes cyp4b1 (Figures 5A,B), abcg2 (Figures 5E,F), slc26a6 (Figures 5G,H), eprs (Figures 5J,K), and slc5a1 (Figures 6A,B) were affected in a concentration-response manner and the fold changes were comparable between the S1 and S2
treatment groups. However, some discrepancies were noted for myod1. The microarray analysis showed a significant down-regulation of myod1 by exposure to S1 and S2 (Table 1), while the RT-qPCR indicated an upregulation (Figures 6G,H).
There are clear differences in the chemical composition of the commercial NA extracts versus the AEOs from OSPW (Gutierrez-Villagomez et al., 2019). However, we had hypothesized that the toxic mechanism would be similar because all extracts contain high levels of O2 species of NAs, albeit,
less in the AEOs. As well, exposures produce the same types of abnormalities. To test this hypothesis, samples of theS. tropicalis exposed to AEO concentrations of 0, 2, 12, 24, and 48 mg/L were analyzed by RT-qPCR for the same genes described for microarray validation. The expression of cyp4b1 (Figure 5C), abcg2 (Figure 5F), and slc26a6 (Figure 5I) was not affected in a concentration-response manner in AEO-treated animals. After extraction, the AEOs were dissolved in a solution of 0.1N NaOH. The solvent control did not have a significant effect on morphometric measurements and frequency of abnormalities (Gutierrez-Villagomez et al., 2019). Likewise,Marentette et al. (2015)reported no effect on the frequency of abnormalities up to concentrations of 50 mM NaOH in fathead minnow embryos. However, the RT-qPCR results showed that NaOH at 0.001 N reduced the expression of many of the genes analyzed by PCR (Figures 5, 6, AEO column). It is nevertheless important to use and report the effects of NaOH with the toxicity assessment of AEOs. The expression level of eprs (Figure 5L) and slc5a1 (Figure 6C). significantly decreased at 48 mg/L AEOs compared to control and NaOH control (p < 0.05). As eprs and slc5a1 are part of networks related to edema, membrane integrity, and metabolism and gut function (Table 1) and frequency of edema and gut abnormalities was significantly higher in samples
FIGURE 2 | Networks associated with metabolism indicating altered gene regulation following exposure of S. tropicalis to 2 mg/L of S1 (A) and S2 (B). Sub-network enrichment analysis (SNEA) was performed using Pathway Studio 9.0. Pink and red indicate that the transcript abundance was increased and green indicates that the transcript abundance was decreased (p< 0.05). The abbreviations are the official gene symbol of the transcripts of the respective pathway (Supplementary Tables S6, S7).
FIGURE 3 | Networks associated with membrane integrity indicating altered gene regulation following exposure of S. tropicalis to 2 mg/L of S1 (A) and S2 (B). Sub-network enrichment analysis (SNEA) was performed using Pathway Studio 9.0. Pink and red indicate that the transcript abundance was increased and green indicates that the transcript abundance was decreased (p< 0.05). The abbreviations are the official gene symbol of the transcripts of the respective pathway (Supplementary Tables S8, S9).
FIGURE 4 | Networks associated with gut function indicating altered gene regulation following exposure of S. tropicalis to 2 mg/L of S1 (A) and S2 (B). Sub-network enrichment analysis (SNEA) was performed using Pathway Studio 9.0. Pink and red indicate that the transcript abundance was increased and green indicates that the transcript abundance was decreased (p< 0.05). The abbreviations are the official gene symbol of the transcripts of the respective pathway (Supplementary Tables S10, S11).
FIGURE 5 | RT-qPCR analysis for cyp4b1 (A–C), abcg2 (D–F), slc26a6 (G–I), and eprs (J–L), mRNA in S. tropicalis exposed to different concentrations of S1 (first column), S2 (second column), and AEOs (third column). Data were normalized and defined as fold change relative to control. Different letters indicate groups that are significantly different (p< 0.05).
FIGURE 6 | RT-qPCR analysis for slc5a1 (A–C), rpl8 (D–F), and (G–I) myod1 mRNA in S. tropicalis exposed to different concentrations of S1 (first column), S2 (second column), and AEOs (third column). Data were normalized and defined as fold change relative to control. Different letters indicate groups that are significantly different (p< 0.05).
exposed to AEOs (Gutierrez-Villagomez et al., 2019), there appears to be an important relationship between the phenotypic abnormalities in S. tropicalis embryos and altered eprs and slc5a1 levels.
CONCLUSION
We report the first comprehensive transcriptomic profiling of the effects of NAs in early S. tropicalis embryos. A diverse number of GO terms and pathways were significantly enriched by exposures to commercial extracts S1 and S2, suggesting that
there are several mechanisms involved. The results obtained in the microarray analysis and comparison to morphometric abnormalities inS. tropicalis exposed to S1 and S2 were highly similar. Metabolism and membrane integrity GO terms and pathways were significantly enriched, indicating that exposure to NAs disrupts metabolism and the functionality of cell membranes inS. tropicalis. These data support the hypothesis that narcosis is at least one of the likely mechanisms of toxicity of NAs. Other GO terms and pathways that were also significantly enriched were related to abnormalities observed in theS. tropicalis larvae after the early exposure to NAs. These included gut function, cartilage differentiation, actin cytoskeleton, cytoskeleton organization, and
edema. While AEOs contain less of the highly toxic NAs in the O2 class, they still cause similar abnormalities and cause changes in the expression of specific genes. The rank-order potency was S1> S2 > AEOs (Gutierrez-Villagomez et al., 2019) based on LC50 (classical mortality measurements) and EC50 (incidence of total abnormalities inS. tropicalis embryos). Here, we show that both commercial NA mixtures and AEOs extracted from OSPW at concentrations found in the environment affect some of the same genes. What is new in our study is that we were able to screen the activities of the commercial NAs, then test whether the OSPW extract has the same effects on the consistently regulated genes- stepping toward the very first potential biomarkers for NAs. This is especially the case foreprs and slc5a1, which may be respectively linked to induction of edema and gut abnormalities in exposed embryos. Future research should focus on specific tissues, considering that gut abnormalities were one of the most relevant and unique phenotypic changes observed, and that was strongly supported by the transcriptomic profiling data. It will also be important to determine the relative contributions of AEOs and polyaromatic compounds on the effects of whole OSPW and other effluents associated with petroleum production.
DATA AVAILABILITY
The datasets generated for this study can be found in GEO, GSE118736.
ETHICS STATEMENT
This study was carried out in accordance with the Canadian Council on Animal Care and approved by the University of Ottawa Animal Care and Veterinary Services.
AUTHOR CONTRIBUTIONS
JG-V and VT designed the research project. JG-V conducted the research and wrote the manuscript. CM helped with bioinformatics. LX helped with RT-qPCR analysis. VL and CM designed the microarray platform. BP provided the financial support. All authors read, edited, and approved the final manuscript.
FUNDING
Grant support for JG-V was provided by CONACyT Mexico. The support of NSERC Strategic Grants Program (STPGP 463041-14 to VT and JB), University of Ottawa Research Chair program, and Environment and Climate Change Canada through the Canada-Alberta Joint Oil Sands Monitoring Program for VT are also acknowledged with appreciation.
ACKNOWLEDGMENTS
This work benefited from the support and ideas of Bruce Maclean representing the people of the Mikisew Cree First Nation of Fort Chipewyan, AB, Canada. We would like to thank Dr. Matthew Pamenter for providing access to his equipment for PCR analysis. The encouragement and advice of Dr. Sarah Hughes are also acknowledged with appreciation.
SUPPLEMENTARY MATERIAL
The Supplementary Material for this article can be found online at: https://www.frontiersin.org/articles/10.3389/fmars. 2019.00533/full#supplementary-material
REFERENCES
Aeppli, C., Carmichael, C. A., Nelson, R. K., Lemkau, K. L., Graham, W. M., Redmond, M. C., et al. (2012). Oil weathering after the deepwater horizon disaster led to the formation of oxygenated residues.Environ. Sci. Technol. 46, 8799–8807. doi: 10.1021/es3015138
Allikmets, R., Schriml, L. M., Hutchinson, A., Romano-Spica, V., and Dean, M. (1998). A human placenta-specific ATP-binding cassette gene (ABCP) on chromosome 4q22 that is involved in multidrug resistance.Cancer Res. 58, 5337–5339.
Aranda, P. S., LaJoie, D. M., and Jorcyk, C. L. (2012). Bleach gel: a simple agarose gel for analyzing RNA quality.Electrophoresis 33, 366–369. doi: 10.1002/elps. 201100335
ASTM, (2012). Standard Guide for Conducting the Frog Embryo Teratogenesis assay – Xenopus Designation E 1439-12, ASTM Book of Standards. Philadelphia: American Society for Testing and Materials.
Baer, B. R., and Rettie, A. E. (2006). CYP4B1: an enigmatic P450 at the interface between xenobiotic and endobiotic metabolism.Drug Metab. Rev. 38, 451–476. doi: 10.1080/03602530600688503
Bantle, J. A. (1991).Atlas of Abnormalities: A Guide for the Performance of FETAX. Stillwater, OK: Oklahoma State University.
Brient, J. A., Wessner, P. J., and Doyle, M. N. (2000).“Naphthenic Acids,” in Kirk-Othmer Encyclopedia of Chemical Technology. Hoboken, NJ: John Wiley & Sons, Inc.
Chernova, M. N., Jiang, L., Friedman, D. J., Darman, R. B., Lohi, H., Kere, J., et al. (2005). Functional comparison of mouse slc26a6 anion exchanger with human SLC26A6 polypeptide variants: differences in anion selectivity, regulation, and electrogenicity.J. Biol. Chem. 280, 8564–8580. doi: 10.1074/jbc.M411703200 Crespi, E. J., and Denver, R. J. (2005). Ancient origins of human developmental
plasticity.Am. J. Hum. Biol. 17, 44–54. doi: 10.1002/ajhb.20098
Dhorne-Pollet, S., Thelie, A., and Pollet, N. (2013). Validation of novel reference genes for RT-qPCR studies of gene expression inXenopus tropicalis during embryonic and post-embryonic development.Dev. Dyn. 242, 709–717. doi: 10.1002/dvdy.23972
Environment and Parks Alberta (2015). Total Area of the Oil Sands Tailings Ponds over Time. Available at: http://osip.alberta.ca/library/Dataset/Details/542 (accessed August 20, 2019).
Escher, B. I., Eggen, R. I. L., Schreiber, U., Schreiber, Z., Vye, E., Wisner, B., et al. (2002). Baseline toxicity (narcosis) of organic chemicals determined by in vitro membrane potential measurements in energy-transducing membranes.Environ. Sci. Technol. 36, 1971–1979. doi: 10.1021/ es015844c
Frank, R. A., Fischer, K., Kavanagh, R., Kent Burnison, B., Arsenault, G., Headley, J. V., et al. (2009). Effect of carboxylic acid content on the acute toxicity of oil sands naphthenic acids.Environ. Sci. Technol. 43, 266–271. doi: 10.1021/ es8021057
Frank, R. A., Roy, J. W., Bickerton, G., Rowland, S. J., Headley, J. V., Scarlett, A. G., et al. (2014). Profiling oil sands mixtures from industrial developments
and natural groundwaters for source identification.Environ. Sci. Technol. 48, 2660–2670. doi: 10.1021/es500131k
Freel, R. W., Morozumi, M., and Hatch, M. (2009). Parsing apical oxalate exchange in Caco-2BBe1 monolayers: siRNA knockdown of SLC26A6 reveals the role and properties of PAT-1.Am. J. Physiol. Gastrointest. Liver Physiol. 297, G918–G929. doi: 10.1152/ajpgi.00251.2009
Government of Canada (2013).Oil Sands: A Strategic Resource for Canada, North America and the Global Market. Available at: http://www.nrcan.gc.ca/sites/ www.nrcan.gc.ca/files/energy/pdf/eneene/pubpub/pdf/OS-brochure-eng.pdf (accessed July 19, 2017).
Grewer, D. M., Young, R. F., Whittal, R. M., and Fedorak, P. M. (2010). Naphthenic acids and other acid-extractables in water samples from alberta: what is being measured?Sci. Total Environ. 408, 5997–6010. doi: 10.1016/j.scitotenv.2010. 08.013
Gutierrez-Villagomez, J. M., Peru, K. M., Edington, C., Headley, J. V., Pauli, B. D., and Trudeau, V. L. (2019). Naphthenic acid mixtures and acid-extractable organics from oil sands process-affected water impair embryonic development of silurana (Xenopus) tropicalis. Environ. Sci. Technol. 53, 2095–2104. doi: 10. 1021/acs.est.8b04461
Gutierrez-Villagomez, J. M. J. M., Vázquez-Martínez, J., Ramírez-Chávez, E., Molina-Torres, J., and Trudeau, V. L. V. L. (2017). Analysis of naphthenic acid mixtures as pentafluorobenzyl derivatives by gas chromatography-electron impact mass spectrometry.Talanta 162, 440–452. doi: 10.1016/j.talanta.2016. 10.057
Heckmann, L.-H., Sørensen, P. B., Krogh, P. H., and Sørensen, J. G. (2011). NORMA-gene: a simple and robust method for qPCR normalization based on target gene data.BMC Bioinformatics 12:250. doi: 10.1186/1471-2105-12-250 Hellsten, U., Harland, R. M., Gilchrist, M. J., Hendrix, D., Jurka, J., Kapitonov, V.,
et al. (2010). The genome of the western clawed frogXenopus tropicalis. Science 328, 633–636. doi: 10.1126/science.1183670
Hersikorn, B. D., and Smits, J. E. G. (2011). Compromised metamorphosis and thyroid hormone changes in wood frogs (Lithobates sylvaticus) raised on reclaimed wetlands on the athabasca oil sands.Environ. Pollut. 159, 596–601. doi: 10.1016/j.envpol.2010.10.005
Huang, R., Chen, Y., Meshref, M. N. A., Chelme-Ayala, P., Dong, S., Ibrahim, M. D., et al. (2018). Characterization and determination of naphthenic acids species in oil sands process-affected water and groundwater from oil sands development area of alberta, Canada.Water Res. 128, 129–137. doi: 10.1016/ j.watres.2017.10.003
Hughes, S. A., Mahaffey, A., Shore, B., Baker, J., Kilgour, B., Brown, C., et al. (2017). Using ultrahigh-resolution mass spectrometry and toxicity identification techniques to characterize the toxicity of oil sands process-affected water: the case for classical naphthenic acids.Environ. Toxicol. Chem. 36, 3148–3157. doi: 10.1002/etc.3892
Jiang, Z., Asplin, J. R., Evan, A. P., Rajendran, V. M., Velazquez, H., Nottoli, T. P., et al. (2006). Calcium oxalate urolithiasis in mice lacking anion transporter Slc26a6.Nat. Genet. 38, 474–478. doi: 10.1038/ng1762
Kim, S.-Y., and Volsky, D. J. (2005). PAGE: parametric analysis of gene set enrichment.BMC Bioinformatics 6:144. doi: 10.1186/1471-2105-6-144 Lam, J. T., Martin, M. G., Turk, E., Hirayama, B. A., Bosshard, N. U., Steinmann,
B., et al. (1999). Missense mutations in SGLT1 cause glucose-galactose malabsorption by trafficking defects.Biochim. Biophys. Acta 1453, 297–303. doi: 10.1016/s0925-4439(98)00109-4
Langlois, V. S., Duarte-Guterman, P., Ing, S., Pauli, B. D., Cooke, G. M., and Trudeau, V. L. (2010). Fadrozole and finasteride exposures modulate sex steroid- and thyroid hormone-related gene expression in silurana (Xenopus) tropicalis early larval development. Gen. Comp. Endocrinol. 166, 417–427. doi: 10.1016/j.ygcen.2009.11.004
Langlois, V. S., and Martyniuk, C. J. (2013). Genome wide analysis of silurana (Xenopus) tropicalis development reveals dynamic expression using net-work enrichment analysis.Mech. Dev. 130, 304–322. doi: 10.1016/j.mod.2012. 12.002
Lee, W. S., Kanai, Y., Wells, R. G., and Hediger, M. A. (1994). The high affinity Na+/glucose cotransporter. Re-evaluation of function and distribution of expression.J. Biol. Chem. 269, 12032–12039.
Li, C., Fu, L., Stafford, J., Belosevic, M., and Gamal El-Din, M. (2017). The toxicity of oil sands process-affected water (OSPW): a critical review.Sci. Total Environ. 601–602, 1785–1802. doi: 10.1016/j.scitotenv.2017.06.024
MacKinnon, M. D., and Boerger, H. (1986). Description of two treatment methods for detoxifying oil sands tailing pond water.Water Pollut. Res. J. Canada 21, 496–512. doi: 10.2166/wqrj.1986.043
Marentette, J. R., Frank, R. A., Bartlett, A. J., Gillis, P. L., Hewitt, L. M., Peru, K. M., et al. (2015). Toxicity of naphthenic acid fraction components extracted from fresh and aged oil sands process-affected waters, and commercial naphthenic acid mixtures, to fathead minnow (pimephales promelas) embryos.Aquat. Toxicol. 164, 108–117. doi: 10.1016/j.aquatox.2015. 04.024
Marentette, J. R., Sarty, K., Cowie, A. M., Frank, R. A., Hewitt, L. M., Parrott, J. L., et al. (2017). Molecular responses of walleye (sander vitreus) embryos to naphthenic acid fraction components extracted from fresh oil sands process-affected water.Aquat. Toxicol. 182, 11–19. doi: 10.1016/j.aquatox.2016. 11.003
Melvin, S. D., Lanctot, C. M., Craig, P. M., Moon, T. W., Peru, K. M., Headley, J. V., et al. (2013). Effects of naphthenic acid exposure on development and liver metabolic processes in anuran tadpoles.Environ. Pollut. 177, 22–27. doi: 10.1016/j.envpol.2013.02.003
Melvin, S. D., and Trudeau, V. L. (2012a). Growth, development and incidence of deformities in amphibian larvae exposed as embryos to naphthenic acid concentrations detected in the canadian oil sands region. Env. Pollut 167, 178–183. doi: 10.1016/j.envpol.2012.04.002
Melvin, S. D., and Trudeau, V. L. (2012b). Toxicity of naphthenic acids to wood frog tadpoles (Lithobates sylvaticus). J. Toxicol. Environ. Health A 75, 170–173. doi: 10.1080/15287394.2012.640092
Morandi, G. D., Wiseman, S. B., Pereira, A., Mankidy, R., Gault, I. G. M., Martin, J. W., et al. (2015). Effects-directed analysis of dissolved organic compounds in oil sands process-affected water.Environ. Sci. Technol. 49, 12395–12404. doi: 10.1021/acs.est.5b02586
Motulsky, H. J., and Brown, R. E. (2006). Detecting outliers when fitting data with nonlinear regression – a new method based on robust nonlinear regression and the false discovery rate.BMC Bioinformatics 7:123. doi: 10.1186/1471-2105-7-123
Natural Resources Canada (2019).Crude Oil Facts. Available at: https://www.nrcan. gc.ca/crude-oil-facts/20064 (accessed August 20, 2019).
Newman, M. C., and Clements, W. H. (2007).Ecotoxicology: A Comprehensive Treatment. Boca Raton, FL: CRC Press.
Nieuwkoop, P. D., and Faber, J. (1994).Normal Table of Xenopus Laevis (Daudin): A Systematical and Chronological Survey of the Development from the Fertilized Egg Till the End of Metamorphosis. Spokane, WA: Garland Pub.
Richardson, S. D., and Ternes, T. A. (2018). Water analysis: emerging contaminants and current issues. Anal. Chem. 90, 398–428. doi: 10.1021/acs.analchem. 7b04577
Rosenfeld, C. S., Denslow, N. D., Orlando, E. F., Gutierrez-Villagomez, J. M., and Trudeau, V. L. (2017). Neuroendocrine disruption of organizational and activational hormone programming in poikilothermic vertebrates.J. Toxicol. Environ. Health B 20, 276–304. doi: 10.1080/10937404.2017.1370083 Smits, J. E. G., Hersikorn, B. D., Young, R. F., and Fedorak, P. M. (2012).
Physiological effects and tissue residues from exposure of leopard frogs to commercial naphthenic acids.Sci Total Environ. 437, 36–41. doi: 10.1016/j. scitotenv.2012.07.043
Turk, E., Zabel, B., Mundlos, S., Dyer, J., and Wright, E. M. (1991). Glucose/galactose malabsorption caused by a defect in the Na+/glucose cotransporter.Nature 350, 354–356. doi: 10.1038/350354a0
Uauy, R., Hoffman, D. R., Peirano, P., Birch, D. G., and Birch, E. E. (2001). Essential fatty acids in visual and brain development.Lipids 36, 885–895. doi: 10.1007/ s11745-001-0798-1
Vu, M., Navarro-Martín, L., Gutierrez-Villagomez, J. M., and Trudeau, V. L. (2015). Development of an in vitro ovary culture system to evaluate endocrine disruption in wood frog tadpoles.J. Toxicol. Environ. Health A 78, 1137–1141. doi: 10.1080/15287394.2015.1074970
Wan, Y., Wang, B., Khim, J. S., Hong, S., Shim, W. J., and Hu, J. (2014). Naphthenic acids in coastal sediments after the hebei spirit oil spill: a potential indicator for oil contamination.Environ. Sci. Technol. 48, 4153–4162. doi: 10.1021/ es405034y
Wang, J., Cao, X., Huang, Y., and Tang, X. (2015). Developmental toxicity and endocrine disruption of naphthenic acids on the early life stage of zebrafish (Danio rerio).J. Appl. Toxicol. 35, 1493–1501. doi: 10.1002/jat.3166
Weintraub, H., Davis, R., Tapscott, S., Thayer, M., Krause, M., Benezra, R., et al. (1991). The myoD gene family: nodal point during specification of the muscle cell lineage. Science 251, 761–766. doi: 10.1126/science. 1846704
Wright, E. M., Loo, D. D., Panayotova-Heiermann, M., Lostao, M. P., Hirayama, B. H., Mackenzie, B., et al. (1994). “Active” sugar transport in eukaryotes.J. Exp. Biol. 196, 197–212.
Young, S. K., Baird, T. D., and Wek, R. C. (2016). Translation regulation of the glutamyl-prolyl-tRNA synthetase gene EPRS through bypass of upstream open reading frames with noncanonical initiation codons.J. Biol. Chem. 291, 10824–10835. doi: 10.1074/jbc.M116.722256
Conflict of Interest Statement: The authors declare that the research was
conducted in the absence of any commercial or financial relationships that could be construed as a potential conflict of interest.
Copyright © 2019 Gutierrez-Villagomez, Martyniuk, Xing, Langlois, Pauli, Blais and Trudeau. This is an open-access article distributed under the terms of the Creative Commons Attribution License (CC BY). The use, distribution or reproduction in other forums is permitted, provided the original author(s) and the copyright owner(s) are credited and that the original publication in this journal is cited, in accordance with accepted academic practice. No use, distribution or reproduction is permitted which does not comply with these terms.