i Département de génie
Cinétique de cristallisation, structure et applications des
stéréocomplexes de PLA
Crystallization kinetics, structure and applications of PLA
stereocomplexes
de doctorat Spécialité: génie chimique
Sajjad SAEIDLOU
Jury: Prof. Michel A. HUNEAULT (directeur de recherche) Dr. Hongbo Li
Prof. Basil Favis Prof. Mathieu Robert Prof. Nathalie Faucheux
ii
i
Le poly(acide lactique) ou PLA est une famille de polyester thermoplastique linéaire qui a connu un essor commercial important durant la dernière décennie. L'enthousiasme pour le PLA vient de sa nature biosourcée, de ses bonnes propriétés mécaniques comme un module élastique élevé et de la possibilité de le biodégrader. Toutefois, certaines carences comme une faible résistance thermique et une faible élasticité à l’état fondu limitent son champ d’application. Fait à noter, le monomère d’acide lactique possède deux stéréo-isomères (L et D). Il est possible de polymériser les isomères L ou D pour former respectivement le PLLA ou le PDLA mais de façon surprenante, le mélange de PLLA et de PDLA permet la formation d’une structure cristalline distincte appelée le stéréocomplexe. Cette forme cristalline a un point de fusion 50 oC plus élevé par rapport aux formes cristallines du PLLA ou de PDLA d’où un premier intérêt pour augmenter la résistance thermique du matériau. Dans ce travail, l’usage de petites quantités (0-5 % massique) de PDLA comme additif dans une phase majeure de PLLA sera analysé. L’effet du stéréocomplexe formé à haute température sur la nucléation du PLLA et sur les propriétés rhéologiques du mélange sera plus particulièrement étudié.
La présente thèse comprend une revue de littérature sur la cristallisation des PLA suivie de quatre parties expérimentales, conclusions et recommandations. La revue de littérature a pour objectif de réinterpréter l’ensemble des données disponibles sur la cristallisation du PLA afin d’en tirer des conclusions claires. La première partie expérimentale porte sur la cinétique de formation du stéréocomplexe à l'état fondu. Il a été constaté que la formation du stéréocomplexe est lente aux températures usuelles de mise en forme du PLLA ( 180 oC). De plus, la coexistence d’une morphologie baptisée dans ce travail « structure en réseau » et d’une morphologie sphérulitique a été révélée pour la première fois. Il a été démontré que la structure de réseau a une température de fusion moins élevée que la structure sphérulitique. Dans la seconde partie du travail, la cinétique de stéréocomplexation a été améliorée significativement pour adapter celle-ci aux cycles de refroidissement courts typiques des méthodes de mise en forme à l’état fondu. Ceci a été réalisé en ajoutant des agents nucléants qui initient la cristallisation à plus haute température et des agents plastifiants qui viennent augmenter la mobilité des polymères. Cette stratégie a permis de réduire le temps de cristallisation d’un ordre de grandeur. Dans un troisième temps, l'effet du stéréocomplexe sur les propriétés rhéologiques d’un mélange PDLA/PLLA a été investigué. En raison de son point de fusion élevé, le stéréocomplexe peut être préservé dans une matrice PLLA fondue et ainsi changer significativement les propriétés rhéologiques. La présence du stéréocomplexe a mené à une augmentation significative de la viscosité et de l'élasticité du PLA expliqué par la formation de points de « réticulation physique » dans la matrice amorphe. Enfin, dans la dernière partie expérimentale, le stéréocomplexe a été utilisé pour améliorer le comportement en moussage du PLA. Des expériences de visualisation et de moussage en mode discontinu ont montré que la présence de stéréocomplexe augmente la densité de nucléation de bulles et améliore significativement la morphologie de la mousse finale grâce à un effet de nucléation et à l’augmentation de l’élasticité du fluide. La revue de littérature et les trois premières parties expérimentales sont présentées sous forme d’articles scientifiques. La dernière partie expérimentale est à titre prospectif pour la suite du projet et ne sera pas soumis pour publication. Mots-clés : poly(acide lactique), stéréocomplexe, cristallisation
ii
Poly(lactic acid), or PLA, is a family of linear thermoplastic polyesters that has experienced strong market growth over the past decade. The enthusiasm for PLA originates from its bio-based nature, its good properties and its biodegradability. However, some of PLA deficiencies such as low thermal resistance and low melt elasticity have limited the development of this polymer. It is noteworthy that the lactic acid monomer has two stereo-isomers (L and D) that can be polymerized respectively into PLLA and PDLA but surprisingly, blending of PLLA and PDLA can lead to the formation of a “stereocomplex” which has a distinct crystalline structure from that of the homopolymers. This crystalline form has a melting point 50 oC greater than the crystalline PDLA or PLLA forms, thus it has by itself an interest in terms of heat resistance. In this work, the use of small amounts of PDLA (0-5%) in a matrix of PLLA will be explored. Particular emphasis will be on the nucleating ability of the stereocomplex (formed at high temperature) on PLLA crystallization and on its effect on the blends rheological properties. The current thesis comprises a literature review on PLA crystallization followed by four experimental sections. The objective of the literature review was to reinterpret the large body of data available on PLA in order to draw clear conclusions on PLA crystallization. The first experimental part of the work focused on the kinetics and conditions of stereocomplex formation in the melt state. It was found that stereocomplex formation is slow in the melt processing temperature range of PLLA ( 180 oC). Co-existence of a so-called “network structure” with a spherulitic structure was revealed for the first time. It was shown that the network structure has a lower melting point than the spherulitic one. In the second part of the work, stereocomplexation kinetics was improved significantly to match it with the fast cooling cycles typical of melt processing techniques. This was achieved by adding nucleating agents that initiated crystallization at higher temperatures and plasticizers that enabled more polymer fluidity. This strategy enabled an order of magnitude decrease in crystallization time. The third part of the work was the investigation of rheological properties upon formation of the stereocomplex structure in 0-5% PDLA in PLLA blends. Due to its higher melting point, the stereocomplex can be preserved in molten PLLA and alter significantly the blend melt rheology. Stereocomplex formation was monitored through rheological measurements and compared to classical calorimetry data. The presence of the stereocomplex lead to a significant increase in viscosity and in melt elasticity explained through the presence of physical crosslink points in the amorphous matrix. Finally, in the last experimental part of the work, the stereocomplex was employed to enhance PLA foaming behavior. Foaming visualization experiments as well as batch foaming tests showed that the presence of the stereocomplex can increase bubble nucleation density and led to a finer and more uniform foam morphology due to its nucleating effect and to the increased melt elasticity.
The literature review and the three first experimental sections are presented in Peer-reviewed journal format. The last experimental section is meant as an exploratory and prospective part for the project and will not be submitted for publication.
iii
I would like to express my sincere gratitude to my supervisor, Professor Michel Huneault, for placing his trust in me, supporting me and most importantly, his friendship during my graduate studies at Universite de Sherbrooke. Indeed, without his immense knowledge, encouragement and patience I was not able to finish this project.
For experimental work, I had a great privilege to work at National Research Council of Canada in Boucherville with enormous support of Doctor Hongbo Li. His inspiration and valuable advises has meant more to me than I could ever express. Also my greatest appreciation goes to the technicians and staff of this research center. I could not complete my work without their invaluable friendly assistance.
I would like to acknowledge financial support from the NSERC Network for Innovative Plastic Materials and Manufacturing Processes (NIPMMP) under the leadership of Professor Chul B. Park. I also gratefully thank Professor Park for his insightful advises and providing the experimental setup for the foaming experiment in Toronto.
I would like to extend my gratitude to my parents, Manij and Ali, for their unconditional love and support. I hope I have made them proud with this work.
Last but foremost, all my deepest love and appreciation to my brilliant and outrageously loving and supportive wife, Sahar.
iv
RÉSUMÉ I
ABSTRACT II
ACKNOWLEDGEMENTS III
LIST OF FIGURES VII
LIST OF TABLES XI
CHAPTER 1. Introduction 1
1.1 Context 1
1.2 Problem definition and objectives 2
1.3 Thesis organization 2
1.4 Original contributions 3
CHAPTER 2. Literature review 4
2.1 Poly(lactic acid) Crystallization 6
2.1.1 Introduction 6
2.1.2 Chain structure 8
2.1.3 Crystal structure 9
2.1.4 Structure-properties relationship 11
2.1.4.1 Glass transition temperature 11
2.1.4.2 Melting temperature and equilibrium melting point 12
2.1.4.3 Maximum achievable crystallinity 16
2.1.5 Crystallization kinetics 17
2.1.5.1 Kinetics through visual observation 17
2.1.5.2 Kinetics through calorimetry 23
2.1.6 PLA heterogeneous nucleation and plasticization 26
2.1.6.1 Nucleation 26
2.1.6.2 Plasticization 36
2.1.6.3 Combination of nucleation and plasticization 40
2.2 Poly(lactic acid) Stereocomplex 43
2.2.1 Structure of PLA stereocomplex 43
2.2.2 Stereocomplex detection and crystallinity measurement 44
2.2.3 Thermodynamic aspect 45
2.2.4 Parameters affecting co-crystallization 45
2.2.5 Stereocomplexation kinetics 51
v 3.1 Introduction 56 3.2 Experimental 58 3.2.1 Materials 58 3.2.2 Blending 58 3.2.3 Rheological characterization 59
3.2.4 Wide-angle X-ray Diffraction analysis 59
3.2.5 Differential Scanning Calorimetry 60
3.2.6 Hot-stage Optical Microscopy 60
3.3 Results and discussion 60
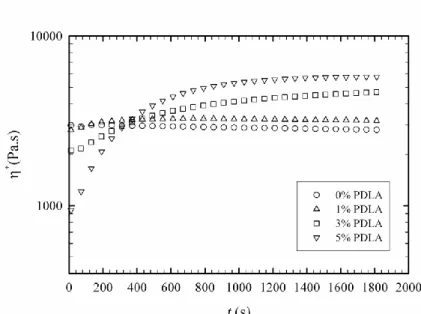
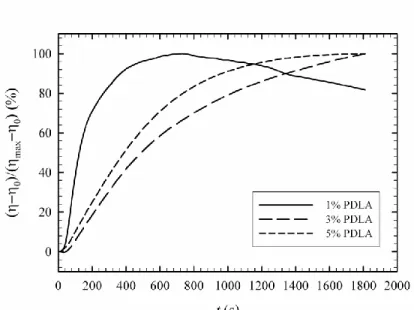
3.3.1 Rheology 60
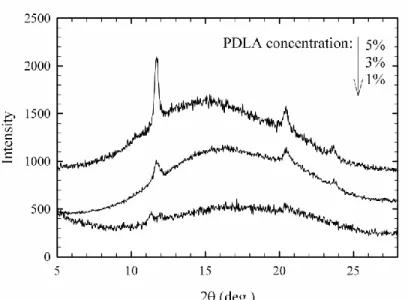
3.3.2 XRD analysis 64
3.3.3 Differential Scanning Calorimetry 66
3.3.4 Optical Microscopy 70
3.3.5 Discussion 74
3.4 Conclusions 75
CHAPTER 4. Effect of nucleation and plasticization on the stereocomplex
formation between enantiomeric poly(lactic acid)s 76
4.1 Introduction 78
4.2 Experimental 80
4.2.1 Materials 80
4.2.2 Blend preparation 81
4.2.3 Differential Scanning Calorimetry (DSC) 81
4.2.4 Hot-stage Optical Microscopy 82
4.3 Results and discussion 82
4.3.1 Non-isothermal DSC 82
4.3.2 Isothermal stereocomplex crystallization 86
4.3.3 PLA stereocomplex melting behavior 89
4.3.4 Optical microscopy observations 94
4.4 Conclusions 97
CHAPTER 5. Poly(lactic acid) stereocomplex formation: application to PLA
rheological property modification 98
5.1 Introduction 100
5.2 Experimental 102
vi
5.3 Results and discussion 103
5.3.1 Effect of stereocomplex on linear viscoelastic region 103 5.3.2 Rheological monitoring of stereocomplex formation 103 5.3.3 Effect of stereocomplex on PLA rheological properties 109
5.4 Conclusions 114
CHAPTER 6. Enhanced foaming behavior of poly(lactic acid) in the presence of PLA
stereocomplex 115
6.1 Introduction 115
6.2 Experimental 115
6.2.1 Materials 115
6.2.2 Blending and sample preparation 116
6.2.3 Foaming visualization 116
6.2.4 Batch foaming 117
6.3 Results and discussion 117
6.3.1 Foam visualization 117
6.3.2 Batch foaming 119
6.4 Conclusions 120
CHAPTER 7. Conclusions and recommendations 121
7.1 Conclusions 121
7.2 Recommendations 124
vii
Figure 2.1 Stereochemistry of lactic acid and lactide molecules ... 8 Figure 2.2 Tg vs. Mn for different D-lactate concentrations ... 12
Figure 2.3 Melting temperature as a function of D-lactate content ... 13 Figure 2.4 Tm and Tm0 as a function of minor repeating unit concentration, filled symbols for
PDLA and open symbols for PLLA... 14 Figure 2.5 PLA Melting point as a function of molecular weight ... 16 Figure 2.6 Effect of molecular weight and minor unit concentration on maximum enthalpy of fusion... 17 Figure 2.7 Spherulite density as a function of crystallization temperature... 18 Figure 2.8 Effect of D unit concentration on the spherulite growth rate of Poly(LL-co-meso-lactide) (open symbols, Mn ≈ 65 kg/mol) and Poly(LL-co-DD-Poly(LL-co-meso-lactide) (filled symbols, Mn ≈ 74 kg/mol) ... 22 Figure 2.9 Maximum spherulite growth rate as a function of molecular weight ... 22 Figure 2.10 Degree of crystallization of PLLA (Mn = 1.23×10⁵ g/mol, PDI = 1.8) vs. time for different crystallization temperatures ... 24 Figure 2.11 Crystallization half-time as a function of crystallization temperature for different D-lactate concentrations and molecular weights ... 25 Figure 2.12 t1/2 as a function of PDLA (Mn ≈ 14 kg/mol) and talc concentration for two PLLAs of
Mn = 56 and 94 kg/mol ... 33
Figure 2.13 Effect of PDLA concentration on peak crystallization temperature for various molecular weight and cooling rate. Solid trend lines and filled symbols: pre-crystallized stereocomplex, dashed lines and open symbols: direct stereocomplex formation from the melt . 34 Figure 2.14 Crystallization enthalpy as a function of cooling rate for different formulations ... 41 Figure 2.15 Crystallinity versus mold temperature for injection molded PLA ... 42 Figure 2.16 Crystal structure of PLA stereocomplex ... 44 Figure 2.17 Competition between stereocomplex and homocrystal formation in solution casting and precipitation methods ... 47 Figure 2.18 Competition between stereocomplex and homocrystal formation in solution casting and from the melt ... 48
viii
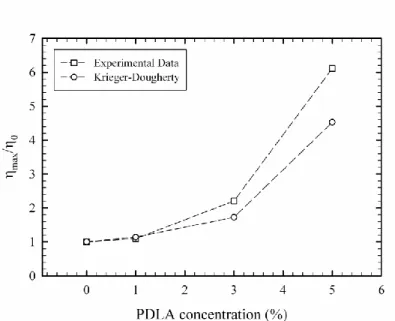
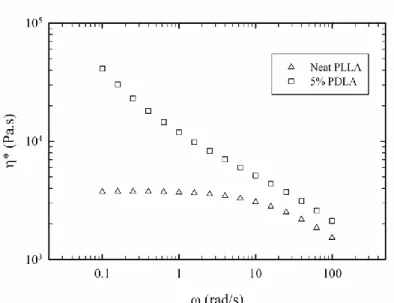
Figure 3.2 Degree of stereocomplex formation vs. time from time-sweep analysis at 180 oC for samples containing 1, 3 and 5% PDLA ... 62 Figure 3.3 Effect of PDLA concentration on viscosity increase ratio and comparison with Krieger-Dougherty model prediction ... 63 Figure 3.4 Frequency sweep behavior of PLA in the presence and absence of stereocomplex ... 64 Figure 3.5 X-ray diffraction patterns of samples containing 5% PDLA before and after time-sweep test ... 65 Figure 3.6 X-ray diffraction patterns of samples containing 1, 3 and 5% PDLA after time-sweep test ... 66 Figure 3.7 Isothermal crystallization peaks of the sample with 5% PDLA obtained at different temperatures ... 67 Figure 3.8 Degree of stereocomplexation expressed as a fraction of the maximum stereocomplex enthalpy obtained at different crystallization temperatures ... 67 Figure 3.9 Melting behavior of stereocomplex formed isothermally at different temperatures ... 69 Figure 3.10 Deconvoluted melting peaks for different isothermal crystallization temperatures, 1: lower temperature melting peaks; 2: higher temperature melting peaks ... 70 Figure 3.11 Optical micrographs of specimen after first thermal procedure, 1: neat PLLA; 2: 5% PDLA blend ... 71 Figure 3.12 Second thermal procedure for optical microscopy observations ... 73 Figure 3.13 Optical micrographs obtained during the thermal procedure described in Figure 3.12 ... 74 Figure 4.1 DSC cooling thermograms of neat PLLA (L), PLLA/5%PDLA (D5), PLLA/5%PDLA/5%PEG (D5P5) and PLLA/5%PDLA/10%PEG (D5P10) ... 83 Figure 4.2 DSC cooling thermograms of neat PLLA (L), PLLA/5%PDLA (D5), PLLA/ 1% talc (T1), PLLA/5%PDLA/1%talc (D5T1), PLLA/ 1%aromatic phosphonate (A1) and PLLA/5%PDLA/1%aromatic phosphonate (D5A1) ... 84 Figure 4.3 DSC cooling thermograms of all formulations in the stereocomplex formation region ... 85 Figure 4.4 DSC cooling thermograms of all formulations in the homocrystallization region ... 86
ix
Figure 4.6 Stereocomplex formation half-time (t1/2) as a function of isothermal crystallization
temperature ... 89 Figure 4.7 Melting behavior of the unmodified 5%PDLA blend (D5) after isothermal crystallization at 160-190 oC ... 89 Figure 4.8 Effect of isothermal crystallization temperature on the melting behavior of PLLA with 5% PDLA (D5): (a) network structure melting and (b) spherulitic structure melting ... 91 Figure 4.9 Hoffman-Weeks plot for the two stereocomplex melting peaks ... 92 Figure 4.10 Effect of nucleating agent and plasticizer on the PLA stereocomplex network and spherulite melting peaks after isothermal crystallization at (a) 170 oC and (b) 180 oC ... 93 Figure 4.11 Melting behavior of the blend with 5% high molecular weight PDLA after isothermal crystallization at 160-190 oC ... 94 Figure 4.12 Final stereocomplex crystalline morphology of D5 blend at 200 oC, isothermally crystallized at (a) 160 oC, (b) 170 oC, (c) 180 oC and (d) 190 oC ... 95 Figure 4.13 Final stereocomplex crystalline morphology at 200 oC, blends isothermally crystallized at 180 oC: (a) D5, (b) D5P10, (c) D5A1 and (d) D5A1P10 ... 96 Figure 5.1 Elastic modulus as a function of strain for annealed samples with PDLA concentration between 0 to 10%. ... 103 Figure 5.2 Elastic modulus as a function of time for initially amorphous samples with different PDLA concentrations ... 104 Figure 5.3 Variation of phase angle with time as an indication of stereocomplex formation .... 105 Figure 5.4 Relative crystallinity as a function of time for blends with 3, 5 and 10% PDLA. .... 106 Figure 5.5 Comparison of relative crystallinity as a function of time for 5% PDLA blend obtained by rheological and calorimetric measurements at Tc = 180 oC ... 107
Figure 5.6 Elastic modulus as a function of time for amorphous samples: 1% nucleating agent without and with 5% PDLA and 5% PDLA blend without nucleating agent ... 108 Figure 5.7 Comparison of relative crystallinity as a function of time for 5% PDLA blends without and with nucleating agent obtained by rheological and calorimetric measurements at 180
x
Figure 5.9 Yield stress as a function of PDLA concentration ... 112
Figure 5.10 Elastic (filled symbols) and loss (open symbols) moduli as a function of frequency for neat PLLA and blends with 3, 5 and 10% PDLA ... 113
Figure 5.11 Cole-Cole plots for neat PLLA and blends with 3, 5 and 10% PDLA: (a) G' versus G" and (b) η" versus η' ... 114
Figure 6.1 Schematic of the foaming visualization system ... 116
Figure 6.2 Pressure drop profile for different saturation pressures ... 117
Figure 6.3 Effect of saturation pressure on cell density at 180 oC for neat PLLA ... 118
Figure 6.4 Effect of foaming temperature on cell density at 1100 psi for 5% PDLA blend ... 118
Figure 6.5 Comparison of cell nucleation and growth for neat PLLA and PLLA with 5% PDLA at 160 oC and 1100 psi ... 119
Figure 6.6 SEM images of neat PLLA and PDLA with 5% PDLA foamed in a batch foaming process... 120
xi
Table 2.1: Properties of different PLA crystal types ... 10 Table 2.2 Reported equilibrium melting temperature and melting enthalpy for PLA ... 14 Table 2.3 Hoffman-Lauritzen Eq. parameters for PLLA ... 19 Table 2.4 Reported front factor and nucleation constant for different crystallization regimes .... 20 Table 2.5 Average Tg and Tm depression of PLA as a function of plasticizer type and
concentration ... 36 Table 3.1 Properties of polylactides ... 58 Table 4.1 Composition of the studied blends in wt. % ... 81
Chapter 1. Introduction
1.1 Context
Poly(lactic acid) is a linear thermoplastic polyester which has been the subject of a vast research in the past decade [1-6]. It is no wonder why it has been so popular these days as it possesses lots of advantages simultaneously. PLA is a bio-based polymer that can be produced from annually renewable resources such as starch and other polysaccharides [2]. On the other hand, it is a compostable polymer. Thus, it originates from and goes back to the nature. In terms of applications, PLA is even more interesting. Its biocompatibility and bioresorbability has made it suitable for specialty biomedical applications such as tissue engineering and drug delivery [7]. Moreover, good mechanical, optical and barrier properties in combination with compostability has positioned PLA as a cost-competitive biobased polymer substituting petroleum-based material in applications such as packaging, textiles and molded articles [1, 8, 9]. The other side of the coin is that this interesting polymer has some disadvantages which are obstacles for its further product development. The main weaknesses are low crystallinity and crystallization rate , a low heat resistance (originating from a low Tg about 55 oC and low crystallinity [6]), lack of
reactive groups and brittleness (low impact resistance) [4]. The main challenges for melt processing of PLA are its low melt strength and elasticity which is problematic in processes such as extrusion foaming and film blowing requiring a certain degree of melt strength [8].
Lactic acid is available in two enantiomeric forms called L-lactic acid and D-lactic acid. Most commercial PLA resins are polymerized primarily from L-lactic acid with D-Lactic acid being a “contaminant” with a level between 0-15 wt.% . In this context, the D component acts as a non-crystallizing comonomer and leads to a lowering of PLA final crystallinity and crystallization rate [6]. If pure enantiomeric L or D forms are used, the corresponding polymers are known as PLLA or PDLA respectively. These polymers have very similar properties with a melting point about 175 oC. Surprisingly, the co-crystallization of PLLA and PDLA chains yields a crystalline form called stereocomplex with a melting point 50 oC higher than PLLA or PDLA homocrystals [10]. This higher melting point structure could be employed to improve PLA heat resistance. In this work however, the focus has been placed on blends where PDLA is used as an additive, in the 0-10 wt.% concentration range, to form a minor stereocomplex phase that in turn can play a
role on PLLA crystallization (as a nucleant for homocrystallization) or on its melt rheology. For melt rheology, the minor stereocomplex phase will tie together different PLLA chains leading conceptually to a physically cross-linked structure within an amorphous molten PLA.
1.2 Problem definition and objectives
As we will see in the literature review, most of the published work on stereocomplexation involved solvent mixing and solution casting and competition between homocrystallization and stereocomplex formation was an important challenge when the viscosity of the media is high. It appeared that stereocomplexation from the melt and at elevated temperatures was not fully investigated and deserved more attention since the vast majority of polymer processing operations involve solvent-free melt processing, short processing times and fast cooling rates. Based on the current state of understanding, it was decided to focus the project according to the following objectives:
To study the structure and stereocomplex formation conditions in the molten state.
To examine the heterogeneous nucleation and plasticization on stereocomplex formation rate and microstructure and to determine the effect of a stereocomplex minor phase on the homocrystallization rate of PLA
To determine if the presence of the stereocomplex minor phase in amorphous (molten) PLA can increase PLA melt elasticity.
To assess the potential of the stereocomplex for the polymer foaming process
1.3 Thesis organization
The thesis has been organized in the following manner. In chapter 2, a literature review on PLA crystallization has been presented in two sections. Homocrystallization is reflected in the first section which is published as a review paper. The second part of the literature review focuses on the general knowledge about PLA stereocomplex. Chapters 3 to 6 are the four distinct experimental parts responding to the four main objectives described above. Chapter 3 presents a study of stereocomplexation kinetics from the melt and elucidates a dual network/spherulitic crystalline morphology which is formed at isothermal stereocomplex formation in the melt state. In chapter 4, the effect of nucleation and plasticization on stereocomplex formation and their effect on crystalline morphology is determined. In chapter 5, stereocomplex formation from the
melt is investigated by rheological measurements and the effect of the developed structure on PLA rheological properties are demonstrated. Chapter 6 presents the application of stereocomplex structure in the improvement of the PLA foaming process. Finally, in chapter 7, the most important conclusions of this work are summarized and some recommendations are given regarding the future work in this area.
1.4 Original contributions
This work has several original contributions to the subject of PLA stereocomplex in relation to the stated objectives. In the first phase of the project which aimed at the determination of the structure and conditions of stereocomplex formation in the melt state, a dual network/spherulitic crystalline morphology was reported for the first time for blends crystallized isothermally from the melt. In addition, the observation of a transcrystalline layer at the surface of stereocomplex spherulites was another original aspect at this stage. In the second experimental part where the enhancement of the stereocomplex formation kinetics in the melt state was intended, plasticization and heterogeneous nucleation were employed simultaneously for the first time in the case of PLA stereocomplex in melt blended systems. An aromatic phosphonate which was never used before for PLA stereocomplex nucleation was proved to be very effective. Also different stereocomplex crystalline morphologies were developed by the incorporation of nucleating agent and plasticizer and the variation of crystallization temperature. The third phase of the project was original in the sense that stereocomplex formation was not probed by rheological means in prior works. Kinetic curves obtained from rheological measurements were compared to common calorimetric curves and their difference was attributed to the change in the chain microstructure as a result of stereocomplex formation. Furthermore, another original aspect of the rheological experiments was the detection of a yield stress for PLA melt containing stereocomplex structure. Finally, the last phase of the project which was aimed to assess the potential of the stereocomplex for the foaming process was essentially original since it was not explored prior to the attempts reported in this thesis. Stereocomplex was shown to enhance cell nucleation through heterogeneous nucleation and stabilized cell formation resulting in a more homogeneous and finer cell morphology.
Chapter 2. Literature review
Avant-propos
Auteurs et affiliation:
Sajjad Saeidlou: , Faculté de
genie, Université de Sherbrooke
Michel A. Huneault: Département de génie chimi , Faculté de genie, Université de Sherbrooke
Hongbo Li: National Research Council of Canada
Chul B. Park: Department of Mechanical and Industrial Engineering, University of Toronto Date d’acception: 16 juillet 2012
État de l’acceptation: version finale publiée Revue: Progress in Polymer Science
Référence: Progress in Polymer Science, 2012.37: p. 1657-1677. Titre français: Cristallisation du poly(acide lactique)
Contribution au document: revue de la littérature pertinente aux travaux expérimentaux
Résumé français: Le poly(acide lactique) est un polyester thermoplastique biosourcé et compostable qui a rapidement évolué pour devenir un matériau de base compétitif durant la dernière décennie. Le principal obstacle à l’augmentation de l'utilisation du PLA est le contrôle de sa cristallinité. Comprendre le phénomène de cristallisation est particulièrement important pour contrôler le taux de dégradation du PLA, sa résistance thermique ainsi que ses propriétés optiques, mécaniques et barrières. La cristallisation du PLA a également été un sujet particulièrement riche d'un point de vue fondamental en raison de l'existence des deux formes énantiomères de l'acide lactique qui peuvent être utilisées pour contrôler le taux de cristallisation, mais aussi pour former des structures stéréocomplexes ayant un point de fusion élevé. Cet article présente un aperçu des connaissances actuelles sur les principes fondamentaux de la cristallisation du PLA dans des conditions de quiescence et sur les moyens pratiques d'améliorer son taux. Les données apportées par une littérature abondante sur la cristallisation
de PLA ont été compilées et analysées pour fournir des relations globales entre la cinétique de cristallisation et les caractéristiques principales de la structure moléculaire du PLA. En outre, les efforts les plus prometteurs dans l'amélioration de la cinétique de cristallisation du PLA par plastification ou nucléation hétérogène ont été discutés.
2.1 Poly(lactic acid) Crystallization
Sajjad Saeidloua, Michel A. Huneaulta, Hongbo Lib, Chul B. Parkc
aDepartment of Chemical and Biotechnological Engineering, Faculty of Engineering, Université
de Sherbrooke, Sherbrooke, QC, Canada J1K 2R1
bNational Research Council of Canada, 75, de Mortagne, Boucherville, QC, Canada J4B 6Y4 cDepartment of Mechanical and Industrial Engineering, University of Toronto, 5 King's College
Road, Toronto, ON, Canada M5S 3G8
Abstract: Poly(lactic acid) is a biobased and compostable thermoplastic polyester that has
rapidly evolved into a competitive commodity material over the last decade. One key bottleneck in extending the use of PLA is the control of its crystallinity. Understanding the crystallization behavior is particularly crucial to control PLA's degradation rate, thermal resistance as well as optical, mechanical and barrier properties. PLA crystallization has also been a particularly rich topic from a fundamental point of view because of the existence of the two enantiomeric forms of lactic acid that can be used to control the crystallization rate but also to form high melting point stereocomplex structures. This article presents an overview of the current understanding on the fundamentals of PLA crystallization in quiescent conditions and on the practical means to enhance its rate. Data from the abundant literature on PLA crystallization were compiled and analyzed to provide comprehensive relationships between crystallization kinetics and the main molecular structure characteristics of PLA. In addition, the most promising efforts in enhancing PLA crystallization kinetics through plasticization or heterogeneous nucleation were reviewed. Keywords: Poly(lactic acid), Polylactide, PLA, Crystallization, Kinetics, Review
2.1.1 Introduction
Poly(lactic acid) or PLA is a biodegradable polymer that can be produced from annually renewable resources [1]. It is an aliphatic thermoplastic polyester that boasts a high modulus, high strength and good clarity. Therefore, it has raised a lot of interest as a potential replacement for petroleum-based polymers. Before its introduction as a packaging and commodity material, specialty grades of PLA had been developed for biomedical uses. Its biocompatibility and
bioresorbability had made it a suitable choice for applications such as drug delivery systems, sutures, blood vessels, etc. [11]. The commercial introduction of bio-based PLA in 2003 has opened the way for more common applications. In particular, PLA has been finding an increasing number of applications in the packaging industry due to its good mechanical properties, transparency and compostability.
The term Poly(lactic acid) is slightly misleading. The PLA now commercialized for commodity applications is made from ring-opening polymerization of lactide, a dimer of lactic acid. Therefore, from a nomenclature point of view, we should refer to polylactide rather than to poly(lactic acid) but both terms are used indifferently in the scientific literature. Another precision that needs to be made is that PLA does not refer to a single material but rather to a family of materials with a range of properties due to the chiral nature of lactic acid as we will explain later. One general drawback of the PLA family of material is that they exhibit a lower glass transition temperature (Tg), up to about 60 oC, compared to competing polyesters. The
ubiquitous polyethylene terephthalate (PET), for example, possesses a Tg around 80 oC.
Therefore, unless PLA can be crystallized to a large extent, its thermal resistance will remain relatively poor. For example, heat deflection temperature (HDT) and Vicat penetration temperature were increased more than 30 and 100 oC respectively, after amorphous samples were fully crystallized. As well, an increase in flexural modulus and strength by 25% and increased impact resistance were reported following the full crystallization of amorphous PLA [12, 13]. On the other hand, if one is interested in maintaining the PLA clarity or maximizing the biodegradability of PLA, it might be useful to understand how to limit crystallization. Enzymatic degradation rate can be reduced by more than 7 times for highly crystalline PLA compared to the amorphous samples [14]. Furthermore, barrier properties are improved due to PLA crystallization. A study by Drieskens et al. [15] showed for crystallized PLA that oxygen and water vapor permeability coefficients were decreased by more than 4 and 3 times respectively, compared to amorphous references. This stresses the importance of PLA crystallization not only from a fundamental point of view but also for obvious market development considerations. Several authors have reviewed the synthesis, properties, processing and applications of PLA [1, 8, 9, 16-18]. The current review will focus specifically on the current understanding of PLA crystallization. In particular, we will examine the microstructure of PLA, the isothermal and
non-isothermal crystallization kinetics and will summarize the different strategies used to control or enhance crystallinity development during melt processing operations.
2.1.2 Chain structure
To understand the crystallization behavior of PLA, it is useful to first examine its chain structure. PLA can be synthesized by two polymerization routes, polycondensation of lactic acid or ring-opening polymerization of lactide [18]. In both cases, lactic acid is the feedstock for PLA production. Due to an asymmetric carbon atom, lactic acid has two optically active forms called L-lactic acid and D-lactic acid. When producing PLA from lactide, three forms are possible: the LL-lactide made from two L-lactates, the DD-lactide from two D-lactates, and the LD or meso-lactide made from a combination of one L- and one D-lactate. In Figure 2.1, schematics of the lactic acid and lactide molecules are illustrated.
Figure 2.1 Stereochemistry of lactic acid and lactide molecules
The polymers coming from pure L- or pure D- feed are referred to as PLLA and PDLA respectively. Commercial PLA grades however are usually based on an L-rich mixture as the majority of lactic acid bacteria (LAB) used in fermentation processes such as Lactobacillus and Lactococcus produce L-lactic acid predominantly. Due to purification issues, they typically comprise a minimum of 1-2% D units. Since the two repeating units are optically active, they rotate polarized light in opposite directions. Specific optical rotation values in chloroform at 25
oC ([α]25) equal to -156o and +156o are commonly used in the literature for 100% pure PLLA and
PDLA, respectively [19-23]. A higher content of one repeating unit in polymer chain results in a higher rotation angle in that direction. Thus, by employing the following equation [24], one can calculate the molar fraction of D units (XD) in PLA:
Based on the molar fraction and source of D units in PLA chains, i.e., DD-lactide or meso-lactide, another important parameter called the average isotactic sequence length ( ) is defined for L-lactide rich PLA as:
Equation 2.2
where a is a coefficient that depends on the source of D units in polymerization feed. It is equal to 1 if all D units are incorporated via meso-lactide, equal to 2 if they are all comprised of DD-lactide and between 1 and 2 depending on the ratio of meso and DD-DD-lactide in the polymerization feed. Using the coefficient 2 for DD-lactide is due to the paring of D units in the random copolymerization of LL-lactide and DD-lactide. Another clarification about the latter equation is that it is correct for random copolymers. In some cases by employing specific initiators, it is possible to have a preferential monomer insertion into the growing chain resulting in a PLA with longer isotactic sequences compared to a statistical copolymer with the same XD [21, 22].
A higher value means a higher level of chain order. Therefore, this parameter influences directly the crystallization behavior of PLA. It can be controlled by adjusting the ratio of LL, DD and meso-lactide in the monomer feed for PLA polymerization. However, in the course of polymerization, L or D units may convert into their counterpart form [25]. This undesirable reaction called racemization will influence and thus will disturb chain order. Another way that chain order may be disturbed is by inter or intramolecular trans-esterification reactions [19].
Chain architecture is another aspect of chain structure. PLA is typically linear in its structure, but it is possible to produce it in different branched architectures by employing multifunctional initiators [26-28] or co-monomers bearing initiation groups [29, 30] in polymerization reaction. Multifunctional chain extenders [31, 32] or peroxides [33, 34] sometimes used for PLA to counterbalance chain scission are other potential sources of branching. Accordingly, it is useful to understand the effect of branching parameters such as branch’s length, amount and architecture on PLA crystallization behavior.
2.1.3 Crystal structure
Different crystal structures have been reported for PLA, the formation of which depends on the crystallization conditions. The most common α-form occurring in conventional melt and
solution crystallization conditions was first reported by De Santis and Kovacs [35] and investigated further in a number of studies [36-38]. Based on WAXD and IR data, Zhang et al. reported the slightly different α′-form for PLA crystallized below 120 °C [39]. The chain conformation and crystal system of the α′-form is similar to α structure, but with a looser and less ordered chain packing. More recent studies suggest that only the α′ crystal is formed at crystallization temperatures below 100 °C while crystallization between 100 and 120 °C gives rise to the coexistence of α′ and α crystal structures [40, 41]. As a consequence of its looser chain packing and disordered structure, the α′ crystal leads to a lower modulus and barrier properties and to higher elongation at break compared to α crystal [42]. A β-form, first observed by Eling et al. [43], is created by stretching the α-form at high draw-ratio and high temperature such as in hot-drawing of melt or solution spun fibers [37, 43]. Melting temperature of the β structure is about 10 oC lower compared to the α crystal, implying that β form is thermally less stable [37]. Later, Puiggali et al. [44] suggested that β-form crystal is a frustrated structure with a trigonal cell containing three chains which are randomly oriented up and down. A more ordered crystal modification called γ was also reported by the same group [45]. In the γ-form which was obtained by epitaxial crystallization of PLA on hexamethyl benzene, two chains are oriented antiparallel in the crystal cell. Besides the homocrystallization of PLLA and PDLA, these two enantiomeric chains can co-crystallize together and form a stereocomplex [10]. In contrast to PLLA or PDLA homocrystals, the stereocomplex crystal cell contains one PLLA and one PDLA chain. Interestingly, melting point of the stereocomplex is about 50 °C higher than that of PLA homocrystal. Thus, stereocomplexation may provide greater temperature resistance to the material. Properties of PLA crystal form are summarized in Table 2.1. The densities were calculated based on the reported cell parameters and the number of monomers in each unit cell. Table 2.1: Properties of different PLA crystal types
Crystal
type Crystal system conformation Chain
Cell parameters ρ theoretical
(g/cm3) a (nm) b (nm) c (nm) α (°) β (°) γ (°) α [35] Pseudo-orthorombic 103 helical 1.07 0.645 2.78 90 90 90 1.247 α [38] Orthorombic 103 helical 1.05 0.61 2.88 90 90 90 1.297 β [37] Orthorombic 31 helical 1.031 1.821 0.90 90 90 90 1.275 β [44] Trigonal 31 helical 1.052 1.052 0.88 90 90 120 1.277 γ [45] Orthorombic 31 helical 0.995 0.625 0.88 90 90 90 1.312
SC [46] Triclinic 31 helical 0.916 0.916 0.870 109.2 109.2 109.8 1.274
SC [47] Trigonal 31 helical 1.498 1.498 0.87 90 90 120 1.274
2.1.4 Structure-properties relationship
2.1.4.1 Glass transition temperature
The glass transition temperature, Tg, plays an important role on the determination of PLA
crystallization window since polymer chain mobility is related to T-Tg. Figure 2.2 presents Tg
data as a function of molecular weight for different D-lactate contents. The Tg increases rapidly
when the molecular weight is increased to 80-100 kg/mol but then reaches a constant value. At a given molecular weight, an increase in optical impurity, i.e. increase in minor unit concentration (defined as D-lactate in the case of an L-rich PLA and as L-lactate for a D-rich PLA), decreases the glass transition temperature to some extent but its effect on Tg is not as significant as on Tm.
The data points for different D-lactate contents presented in Figure 2.2 have been fitted with the predictions of the Flory-Fox equation given by
Equation 2.3
where Tg∞ is the glass transition temperature for infinite molecular weight, K is a constant and Mn
is the number-average molecular weight. Accordingly, we have found that K increases linearly with D-lactate concentration and that Tg∞ shows a decreasing trend that can be predicted quite
well with a rational function.
Equation 2.4
Equation 2.5
where Tg∞ and K are respectively expressed in oC and in oC.kg/mol.
The solid curves in Figure 2.2 are the relationships obtained using Equation 2.3 and the equation parameters Tg∞ and K described above, showing that Tg of PLA can be correctly
Figure 2.2 Tg vs. Mn for different D-lactate concentrations, data adapted from [48-51]
PLA chain architecture is another influential parameter for Tg. Compared to the linear
structure, a branched PLA has a lower Tg value. This is due to the existence of a higher free
volume caused by the higher number of chain ends. Pitet et al. [29] reported a 10 oC decrease in Tg for hyper branched PLA produced by copolymerization of lactide and glycidol while Zhao et
al. [52] reported a 5 oC decrease in Tg for a 32-arms star shaped PLA produced by a poly(amido
amine) dendrimer initiator. For lower branching contents such as star or comb like architectures with 4-9 arms [28] or by adding chain extender [53], no significant difference in Tg was reported.
2.1.4.2 Melting temperature and equilibrium melting point
Figure 2.3 compares the melting point data from several authors as a function of D-unit content in the polymer structure. Pure PLLA (0% data) exhibits the maximum melting temperature, between 175 and 180 oC depending on authors. The melting point decreases linearly with the D-lactate content. The best linear fit for each data set is presented as well. The slope of these lines varies between -5.5 to -5.0, meaning that 1% D-unit content results in approximately 5 oC reduction in melting temperature. The difference between data presented in Figure 2.3 is due to the different molecular weight. For example, Kolstad reported Tm for PLA with Mn
between 50 to 130 kg/mol [54] while data reported by Witzke [51] and Bigg [55] concern PLA with Mw higher than 100 kg/mol. Furthermore, the thermal history applied by the authors
Figure 2.3 Melting temperature as a function of D-lactate content, data adapted from [51, 54-56]
The melting temperature of a polymer is expected to increase with the temperature at which it was crystallized (Tc). Due to the kinetic barrier for crystallization when approaching the
melting temperature, polymer crystallization is typically carried out at high undercoolings which limits the crystal thickness. However, in the limiting case when crystallization is in equilibrium with melting of crystals, the crystal grows large enough in all directions so that the melting point reaches its maximum value, the so-called equilibrium melting point (Tm0). The effect of the
D-content on the Tm0 of PLA can be calculated based on Hoffman-Weeks procedure [57].
Figure 2.4 addresses the effect of crystallization temperature and of minor unit concentration on melting point and presents the Tm0 values obtained for each minor unit concentration (i.e. the
Tc=Tm line). As expected, Tm decreases with minor unit concentration for all crystallization
temperature. The melting point for any given minor unit content clearly increases as a function of the crystallization temperature. The data at Tc = Tm is compared to the Baur Model prediction.
This model is used to calculate melting point depression due to random copolymerization with a non-crystallizable co-monomer. The Baur model [58] is a modification based on earlier development proposed by Flory [59] and is given by
where X is the molar fraction of crystallizable units, ΔHm0 is the equilibrium enthalpy of fusion,
R is the gas constant and is the average sequence length of crystallizable units (see Equation 2.2). The model is identical to the one proposed by Flory except for the 1/ term. The equilibrium melting point depression is well described by the Baur Model. The validity of the Baur equation was also reported by Huang et al. [60] as well as Baratian et al. [61] for PLA systems.
Figure 2.4 Tm and Tm0 as a function of minor repeating unit concentration, filled symbols for PDLA and open symbols for
PLLA, data adapted from [24]
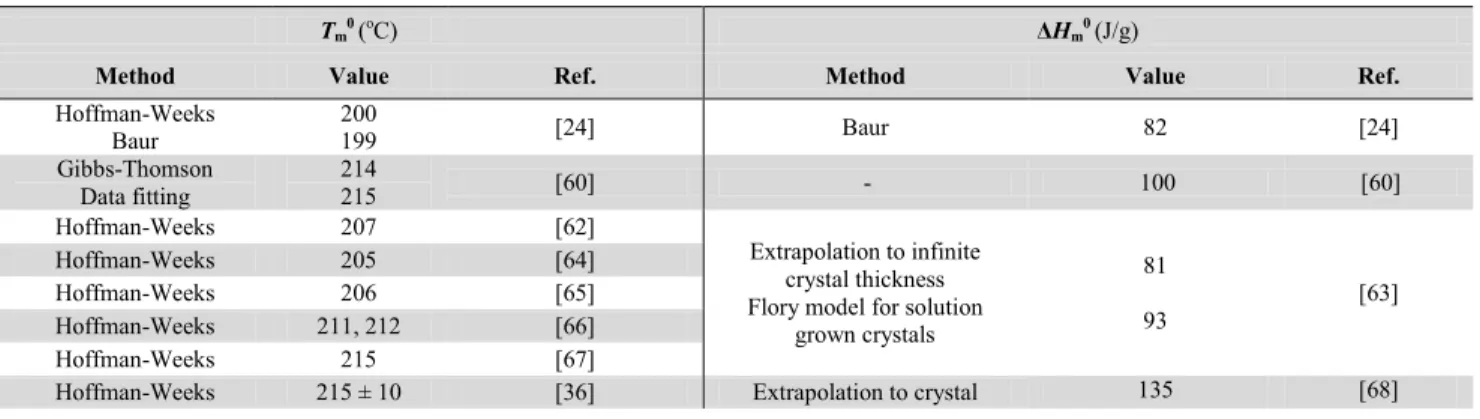
The reported equilibrium melting temperature and equilibrium enthalpy of fusion of PLA are summarized in Table 2.2 with their calculation methods. Most authors report equilibrium melting temperatures between 200 and 215 oC. Variations may be due to variations in molecular weights and purity of the investigated polymers. In terms of equilibrium melting enthalpies, estimations vary between 80 and 135 J/g.
Table 2.2 Reported equilibrium melting temperature and melting enthalpy for PLA
Tm0 (oC) ΔHm0 (J/g)
Method Value Ref. Method Value Ref.
Hoffman-Weeks Baur 200 199 [24] Baur 82 [24] Gibbs-Thomson Data fitting 214 215 [60] - 100 [60] Hoffman-Weeks 207 [62] Extrapolation to infinite crystal thickness Flory model for solution
grown crystals 81 93 [63] Hoffman-Weeks 205 [64] Hoffman-Weeks 206 [65] Hoffman-Weeks 211, 212 [66] Hoffman-Weeks 215 [67]
Marand Hoffman-Weeks 227 199 [48] density (Density-Enthalpy relation) Hoffman-Weeks (pseudo-equilibrium lamellar crystals) 215 [69]
Molecular weight is another factor that significantly influences the melting temperature. Figure 2.5 illustrates the melting point variation with the number averaged molecular weight Mn.
The data has been compiled from seven papers where the PLA had less than 1.25% minor units [24, 48, 50, 51, 61, 70, 71]. The melting temperature increases dramatically with molecular weight for low Mn but reaches an asymptotical value at Mn>100 kg/mol. It can be as low as 90°C
for PLA oligomers and increases up to 185 °C for PLA in the 100 kg/mol range. It is noteworthy that commercial PLA grades with a molecular weight in the 50-150 kg/mol range are in the high-molecular weight plateau region and therefore are not highly sensitive to high-molecular weight changes. In order to express the relationship between melting point and molecular weight in a simple way, the data from Figure 2.5 was fitted using the following equation:
Equation 2.7
with Tm∞= 181.3 oC and A = 1.02×10⁵ oCg/mol. This is a common molecular weight dependency
used for expressing changes in polymer properties such as glass transition temperature, tensile strength, etc. The property is expressed as a function of the number-averaged molecular weight Mn, and of a theoretical property value obtained at infinite molecular weight. As can be seen on
the figure, Equation 2.7 gives a fair account of the effect of molecular weight on the melting temperature.
Figure 2.5 PLA Melting point as a function of molecular weight, data adapted from [24, 48, 50, 51, 61, 70, 71]
In some circumstances, two peculiarities are observed in the DSC heating scans of semi-crystalline PLA. One is the emergence of a small exothermic peak just before the melting peak and the other one is the occurrence of a double melting peak. These two phenomena can be well explained by taking into consideration the crystallization conditions in parallel with the α' and α crystal formation requirements [40, 41, 72, 73]. When PLA is crystallized at temperatures corresponding to α' crystal formation, the small exotherm appearing just before the single melting peak is due to the transformation of disordered α' crystals to the ordered α-form. On the other hand, a double melting behavior appears when the crystallization temperature is situated in the region of simultaneous α' and α type formation. For high crystallization temperatures, only α crystals are produced leading to a single melting peak.
Effect of branched structure on the melting point was also reported in a number of studies [28, 31, 52, 53, 74]. Tm was insensitive to branching when different contents of reactive
copolymers (chain extenders) were employed to produce long chain branched PLA [31, 53]. However, in the case of star-shaped PLAs synthesized by multifunctional initiators, the magnitude of Tm reduction was in direct relation with the number of arms. Tm reduction between
5 and 40 oC were observed for branched PLAs with 4-9 arms [28, 74] and 32 arms [52], respectively. This behavior was attributed to the poor folding property of branched architecture due to steric hindrance as well as crystal imperfections caused by chain ends and branching points.
2.1.4.3 Maximum achievable crystallinity
Both the molecular weight and D-Lactate content determine the maximum achievable crystallinity. The enthalpy of fusion data obtained from various data sets are summarized in Figure 2.6. The maximum enthalpy of fusion decreases generally with molecular weight and minor unit concentration. The molecular weight effect can be explained by the higher restrictions of chain motion at higher molecular weights, while the reduction in maximum achievable crystallinity by increasing D-lactate content is expected from crystal disruption. At about 10 to 12 mol.% (in the case of random distribution) of non-crystallizable unit, crystallinity is extremely low and so lengthy that PLA can be considered completely amorphous. Furthermore, crystallinity is diminished if branching is imparted to PLA structure as a consequence of more
difficult chain segment transportation to crystallization sites. Compared to linear PLA, 7-15% less crystallinity was achieved for star-shaped and long chain branched PLA [28, 31, 52, 74].
Figure 2.6 Effect of molecular weight and minor unit concentration on maximum enthalpy of fusion, data adapted from [24, 54, 60, 70, 75-80]
2.1.5 Crystallization kinetics
2.1.5.1 Kinetics through visual observation
The overall crystallization kinetics is typically examined in terms of two independent phenomena: initial crystal nucleation and of subsequent crystal growth. In practice, optical microscopy on thin polymer films is used to determine the nucleation density and spherulite growth rates in isothermal conditions. The polymer film is usually first melted and rapidly cooled to the desired temperature. The size and number of spherulites can then be monitored over time. High-quality images and more accurate measurements are also reported by observation via an Atomic Force Microscopy technique [81, 82]. The relation between the number of crystallization sites (spherulite density) with crystallization temperature for PLA is illustrated in Figure 2.7. The spherulite density was shown to decrease with temperature and the decreasing rate gradually accelerates with temperature.
Figure 2.7 Spherulite density as a function of crystallization temperature, data adapted from [24, 79, 83, 84]
The growth phenomenon is evaluated by measuring spherulite radius with time. The crystal growth rate (G) is equal to the slope of the spherulite radius vs. time curve, while extrapolation of this data to zero-radius can be used to determine the induction time (related to nucleation kinetics). Usually G is constant for a specific Tc, implying a constant concentration of impurities
like non-crystallizable segments at the growth front because of their rejection to inter-lamellar regions. One of the most important theories on polymer crystallization is the Hoffman-Lauritzen theory that deals with the crystal growth kinetics [85, 86]. It defines three crystallization regimes based on the ratio between the rate of surface nucleation and the rate of chain deposition on the crystal surface. It is noteworthy that this theory concerns the secondary nucleation occurring on preformed lamellae. It is different from the primary nucleation defined as the initiation of a new lamella from a polymer melt. In regime I which covers low undercoolings, surface nucleation is slow and is the limiting factor while chain mobility is high. By decreasing temperature and moving to regime II, surface nucleation becomes more effective while chain movement is reduced. However the combination of the two factors gives higher growth rates. Finally, upon further cooling, we move to regime III. Contrary to regime I and due to high undercoolings, surface nucleation is maximum and chain motion is the limiting factor, resulting in lower growth rates compared to regime II. According to this theory, the crystal growth rate (G) of a homopolymer is given by:
where G0 is a pre-exponent constant known as front factor, U* is the activation energy for local
motion, R is the gas constant, Tc is the crystallization temperature, T∞ is the temperature at which
flow ceases, ΔT is the undercooling (Tm0-Tc), and f is a factor to account the change in heat of
fusion with temperature. Kg known as the nucleation constant is a parameter given by:
Equation 2.9
where a is a constant that depends on the crystallization regime (2 for regime II crystallization and 4 for regime I and III), b is the surface nucleus thickness, σ is the lateral surface free energy, σe is the fold surface free energy, Tm0 is the equilibrium melting temperature, ΔHf is the heat of
fusion for 100% crystallinity and k is the Boltzmann constant. Typical values of Hoffman-Lauritzen equation parameters reported for PLLA are summarized in Table 2.3.
Table 2.3 Hoffman-Lauritzen Eq. parameters for PLLA
Parameter Description Value
U* Activation energy for local motion 6.27 × 10³ J/mol [62]
R Gas constant 8.314 JK-1mol-1
T∞ Temperature at which flow ceases Tg-30 K
ΔT Undercooling Tm0 - Tc
f Factor to account the change in heat
of fusion with temperature 2Tc/(Tm 0+T
c)
Tm0 Equilibrium melting temperature (SeeTable 2.2)
b Surface nucleus thickness 5.17 × 10⁻¹⁰ m [36] σ Lateral surface free energy 12.03 × 10⁻³ Jm-2[62] σe Fold surface free energy 60.89 × 10⁻³ Jm-2[62] ΔHf Heat of fusion (SeeTable 2.2)
k Boltzmann constant 1.38 × 10⁻²³ JK-1
When the growth rate measurement is done for different crystallization temperatures, plotting versus will lead to a linear plot where the slope is -Kg and the
intercept is ln(G0). In addition, the regime change temperature can be obtained from the points of
slope variation. Regime I-II transition for PLA was reported to occur at 163 [62] or 147 oC [48] while regime II-III transition occurs at 120 oC [40, 48, 87, 88]. Furthermore, G is maximum at
about 130 oC [40, 60, 62, 87, 89]. In some cases, however, an unusual behavior is reported for the variation of G with Tc for PLA where two local maxima are observed at temperatures around
105-115 oC and 125-135 oC instead of a bell-shaped curve [48, 69, 82, 83, 88, 90-93]. The origin of this double peak behavior is not known exactly. Transition from regime II to III [48, 88, 94] or growth of α' and α crystal structures [91] are assumed to be the main causes for such behavior. Interestingly, the temperatures for regime II-III transition and transition from pure α to a mixture of α' and α crystal formation coincide (120 oC). Besides, there are arguments on whether the crystal structure or spherulite morphology remains the same [48, 90, 91] or varies for these two growth rate peaks [83].
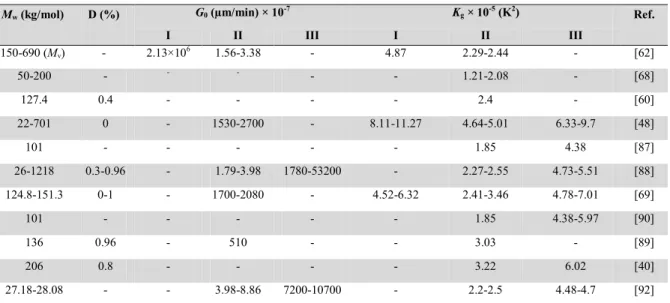
In Table 2.4, some of the reported values for Kg and G0 are summarized. Reported G0 data
are varying widely, however Kg values are more consistent. Additionally, ratios of Kg(III)/Kg(II)
and Kg(I)/Kg(II) are close to the theoretical value of 2.
Table 2.4 Reported front factor and nucleation constant for different crystallization regimes
Mw (kg/mol) D (%) G0 (µm/min) × 10-7 Kg × 10-5 (K2) Ref.
I II III I II III 150-690 (Mv) - 2.13×10⁶ 1.56-3.38 - 4.87 2.29-2.44 - [62] 50-200 - - - - - 1.21-2.08 - [68] 127.4 0.4 - - - - 2.4 - [60] 22-701 0 - 1530-2700 - 8.11-11.27 4.64-5.01 6.33-9.7 [48] 101 - - - 1.85 4.38 [87] 26-1218 0.3-0.96 - 1.79-3.98 1780-53200 - 2.27-2.55 4.73-5.51 [88] 124.8-151.3 0-1 - 1700-2080 - 4.52-6.32 2.41-3.46 4.78-7.01 [69] 101 - - - 1.85 4.38-5.97 [90] 136 0.96 - 510 - - 3.03 - [89] 206 0.8 - - - - 3.22 6.02 [40] 27.18-28.08 - - 3.98-8.86 7200-10700 - 2.2-2.5 4.48-4.7 [92]
For high melting point polyesters, like PLA, Hoffman et al. [95] related the lateral surface free energy to chain flexibility through the following equation:
Equation 2.10
where a0 is the surface nucleus height and equals to 5.97 Å for PLA according to Kalb and
unperturbed linear polymer chain over that of an equivalent random-flight chain. This ratio is a representation of chain flexibility and assumes higher values for stiffer polymer chains and more extended conformations. There is a discrepancy in the literature about PLA chain flexibility. Different values of C∞ are reported for PLA ranging from 2 up to 12 [49, 96-102]. Dorgan et al.
[49, 102] identified a number of reasons for this inconsistency and with a series of careful experiments in melt and solution state, they suggested that PLA has a flexible polymer chain with a characteristic ratio of about 6.5, in agreement with the simulation study by Blomqvist [101]. Presence of an oxygen atom in the backbone gives flexibility to the chain, having a nearly free-rotation around O-C bond. In terms of crystallization, this implies less extended chains that should pass a higher entropy barrier to crystallize [95]. Replacing the lateral surface free energy in Hoffman-Lauritzen model by Equation 2.10 likewise confirms that for a more flexible chain (smaller C∞), the exponential term associated to secondary nucleation becomes smaller and its
contribution to growth rate is reduced.
An additional factor affecting growth rate is the D-lactate concentration. This is illustrated in Figure 2.8 where the growth rate is plotted versus crystallization temperature for PLA of similar molecular weight but with different D-lactate concentration. Open symbols represent data for which D-unit is incorporated through copolymerization of LL-lactide with meso-lactide, while filled symbols are for LL-lactide copolymerized with DD-lactide. It should be noted that the nominal concentration of meso or DD-lactide for the samples with lowest D-unit concentration were 0%. The optimum Tc (at which G is maximum) is in the 115-130 °C range.
Increasing the optical impurity decreases dramatically the maximum spherulite growth rate. It is around 4.5 μm/min for a PLA with 0.4% D impurity and is decreased by a factor of 40 (less than 0.1 μm/min) with the addition of only 6.6% D-lactate. The way that D-unit is introduced into the PLA structure also influences the growth rate significantly. Comparison of the data sets with similar D-lactate concentration suggests that when DD-lactide is the source of impurity, the growth rate is higher compared to the situation where meso-lactide is the impurity source. This is logical since for DD-lactide, each two D-units are connected to each other. Thus, the average isotactic sequence length of L-units is doubled compared to the PLA having meso-lactide as the feed component (see Equation 2.2). Finally, from Figure 2.8 it is clear that the optimal crystallization temperature shifts to lower values when the D-lactate concentration increases.
Figure 2.8 Effect of D unit concentration on the spherulite growth rate of Poly(LL-co-meso-lactide) (open symbols, Mn ≈ 65 kg/mol) and Poly(LL-co-DD-lactide) (filled symbols, Mn ≈ 74 kg/mol), data adapted from [60, 61]
The molecular weight’s effect on the maximum growth rate is shown in Figure 2.9. The molecular weight is a number average, except for the viscosity average molecular weight data of Vasanthakumari and Pennings [62]. The data is for PLA having low D-unit concentration (0-1%). However, for some data points this parameter is not specified by the authors. Once more, we chose the general form of Flory-Fox equation for regression of the maximum growth rate data. Thereby, the following parameters were used to draw the solid-line curve in Figure 2.9:
Equation 2.11
where Gmax∞ = 1.4 µm/min and A = -3.8×10⁵ (µm.g)/(min.mol).
Figure 2.9 Maximum spherulite growth rate as a function of molecular weight, data adapted from [40, 48, 60, 62, 69, 79, 82, 83, 88, 89, 91-93]
Obviously, the growth rate decreases with molecular weight as expected from more restricted chain mobility. The decrease is sharp at lower molecular weights, while in the range of molecular weights typical of commercially available PLA, the effect is not as dramatic as that of the optical impurity.
2.1.5.2 Kinetics through calorimetry
Calorimetry is another technique used to study the crystallization kinetics. In particular, calorimetry enables quantification of transition temperatures and enthalpies in isothermal and non-isothermal modes. For isothermal characterizations, after initial quenching below the glass transition temperature or directly from the melt state, the amorphous polymer is rapidly brought to the selected crystallization temperature Tc. Heat flow is then measured as a function of time
until crystallization is completed. The heat flow data is converted into an absolute crystallinity level or more commonly, to a fraction relative to the final crystallinity level. Such crystallinity growth curves are illustrated in Figure 2.10 for a PLLA crystallized at temperatures between 90 and 130˚C. Once this data is obtained, it can be curve-fitted with the Avrami model:
Equation 2.12
where k is a kinetic rate constant and n is the Avrami exponent. The Avrami exponent is typically between 2 and 4 for polymer crystallization and is associated to the nucleation mechanism (homogeneous vs. heterogeneous and simultaneous vs. sporadic), dimensionality of crystal growth and growth mechanism, i.e., linear or diffusion controlled due to the high impurity concentration. The solid lines in Figure 2.10 are data regression obtained using the Avrami model. The Avrami exponents for this specific example were in the range of 2.5-2.8 for the temperature range of 90 to 130 oC, suggesting a change in crystal growth from two to three dimensional with simultaneous nucleation [103]. Likewise, there are other reports of the Avrami exponent around 2 [104-106], between 2.5 and 3.5 [54, 65, 79, 107-111] and between 3.5 and 4.3 [68, 112, 113]. The higher n values are attributed to three dimensional spherulitic growth with a sporadic or a combination of sporadic and simultaneous nucleation type, while the lower values are associated to two dimensional growth with instantaneous and some sporadic nucleation.
Figure 2.10 Degree of crystallization of PLLA (Mn = 1.23×10⁵ g/mol, PDI = 1.8) vs. time for different crystallization
temperatures, data adapted from [103]
To rapidly compare the crystallization rates of materials, it is convenient to report the crystallization half-time (t1/2) defined as the time required to attain half of the final crystallinity
(Xt = 0.5). The half-time is typically reported as a function of temperature enabling the determination of the optimal temperature window. In Figure 2.11, t1/2 is plotted versus
crystallization temperature for PLA having different molecular weights (Mn in kg/mol) and
D-lactate concentration. Even though the materials varied widely in terms of molecular weight and optical purity, all curves go through the typical minimum. This minimum is associated to the competition between the increased mobility and the reduced nucleation rate as a function of temperature. The lowest reported half-time was in the 2-3 minutes range. This is relatively high compared to other semi-crystalline commodity polymers. The half-time increases clearly with the D-lactate content and the typical U-shaped curves are shifted up. A useful general rule reported by Kolstad [54] is that the crystallization half-time increases by about 45% for each 1% increase in meso-lactide content. The data in Figure 2.11 does not enable a systematic evaluation of molecular weight effects but one-to-one comparison of data with similar D-contents show that the half-time was increased with molecular weight as expected from the reduced chain mobility.
![Figure 2.3 Melting temperature as a function of D-lactate content, data adapted from [51, 54-56]](https://thumb-eu.123doks.com/thumbv2/123doknet/2852661.70734/26.918.248.625.115.402/figure-melting-temperature-function-lactate-content-data-adapted.webp)
![Figure 2.6 Effect of molecular weight and minor unit concentration on maximum enthalpy of fusion , data adapted from [24, 54, 60, 70, 75-80]](https://thumb-eu.123doks.com/thumbv2/123doknet/2852661.70734/30.918.270.726.203.531/figure-effect-molecular-weight-concentration-maximum-enthalpy-adapted.webp)
![Figure 2.9 Maximum spherulite growth rate as a function of molecular weight , data adapted from [40, 48, 60, 62, 69, 79, 82, 83, 88, 89, 91-93]](https://thumb-eu.123doks.com/thumbv2/123doknet/2852661.70734/35.918.267.630.747.1016/figure-maximum-spherulite-growth-function-molecular-weight-adapted.webp)