Introduction of the GAM model for regional low-flow frequency analysis at
1
ungauged basins and comparison with commonly used approaches
2 3 4
T. B.M.J. Ouarda1*, C. Charron1, Y. Hundecha2, A. St-Hilaire1, F. Chebana1 5 6 7 8 9 1
Canada Research Chair in Statistical Hydro-Climatology,INRS-ETE, 490 de la Couronne, 10
Quebec, QC, G1K9A9, Canada 11
2
Swedish Meteorological and Hydrological Institute, Norrköping, Sweden 12 13 14 15 *Corresponding author: 16 Email: [email protected] 17 Tel: +1 418 654 3842 18 19 20 21 August 2018 22
Abstract
23Generalized Additive Models (GAMs) are introduced in this study for the regional estimation 24
of low-flow characteristics at ungauged basins and compared to other approaches commonly 25
used for this purpose. GAMs provide more flexibility in the shape of the relationships between 26
the response and explanatory variables in comparison to classical models such as multiple 27
linear regression (MLR). Homogeneous regions are defined here using the methods of 28
hierarchical cluster analysis, canonical correlation analysis and region of influence. GAMs and 29
MLR are then used within the delineated regions and also for the whole study area. In addition, 30
a spatial interpolation method is also tested. The different models are applied for the regional 31
estimation of summer and winter low-flow quantiles at stations in Quebec, Canada. Results 32
show that for a given regional delineation method, GAMs provide improved performances 33
compared to MLR. 34
Keywords: Low flows; Regional estimation; Canonical correlation analysis; Region of 35
influence; Hierarchical cluster analysis; Generalized additive models. 36
1. Introduction
38Assessment of low-flow characteristics is traditionally performed using different 39
approaches including flow duration curves, frequency analysis of extreme low-flow events and 40
continuous low-flow intervals, baseflow separation and characterization of streamflow 41
recessions (Smakhtin, 2001). Knowledge of the magnitude and frequency of low flows for 42
streams is important for water-supply planning and design, waste-load allocation, reservoir 43
storage design, and maintenance of quantity and quality of water for irrigation, recreation, and 44
wildlife conservation (Smakhtin, 2001). The frequency analysis of extreme low flows consists 45
in fitting appropriate probability distributions to the annual minimum flow (Lawal and Watt, 46
1996; Nathan and McMahon, 1990; Ouarda et al., 2008b; Russell, 1992) defined as the annual 47
minimum of daily or monthly discharges or averages of consecutive flows over a certain 48
number of days (Zalants, 1991). The most used low-flow statistics in hydrology are the 49
quantiles Qd T, of the minimum mean discharge over d days corresponding to a return period of 50
T years. These low-flow quantiles are operationally related to the concept of environmental
51
flows, which are flow regimes designed to maintain a river in some agreed ecological condition 52
(Acreman, 2005; Smakhtin and Eriyagama, 2008). 53
The reliability of the estimates of the desired low-flow characteristics, however, depends 54
on the amount of available streamflow data from which the at-site estimates are obtained. In 55
practice, it is often the case that many streams are poorly monitored, do not have enough record 56
to enable estimation of the required low flows, or are simply ungauged. To circumvent this 57
problem, various approaches have been attempted, which enable estimation of low-flow 58
characteristics at ungauged basins. A comprehensive review of methods of low-flow estimation 59
at ungauged sites has been presented by Smakhtin (2001). Statistical regionalization methods 60
have been among the most widely used schemes over the last decades to estimate low-flow 61
characteristics at ungauged or poorly gauged locations using data from gauged sites (Charron 62
and Ouarda, 2015; Durrans and Tomic, 1996; Gustard et al., 1997; Holmes et al., 2005; Laaha 63
and Blöschl, 2006; Rees et al., 2006; Requena et al., 2018; Tsakiris et al., 2011). 64
In practice, regionalization of low-flow characteristics is generally carried out with one 65
of two commonly used approaches. The first approach consists of estimating low-flow 66
characteristics from a set of explanatory variables using a regression model calibrated with at-67
site estimates of low-flow characteristics at gauged stations (Fennessey and Vogel, 1990; Vogel 68
and Kroll, 1990). The second approach is based on the assumption that the low-flow 69
distribution functions at all sites within a region considered to be homogeneous are the same 70
when standardized by a site specific index flow (Dalrymple, 1960). The parameters of the 71
regional low-flow distribution function are generally estimated from the corresponding 72
parameters of the local low-flow distribution functions obtained at each gauged site within the 73
region. Regional estimation of the required low-flow quantile is then performed by rescaling 74
the quantile value estimated from the regional distribution by the index flow. 75
In both regionalization approaches, the identification of sites that constitute a 76
homogeneous region is usually carried out. Different approaches can be implemented to 77
achieve this. It would be logical to group sites based on similarity of certain statistical 78
properties of their flow records. This, however, would only be possible if all the sites were 79
properly gauged. In order to allow estimation at ungauged sites, therefore, other methods that 80
do not require analysis of flow records are used. In the absence of detailed information on 81
catchment characteristics, sites may be grouped based on their geographic proximity (Smakhtin, 82
2001). However, geographic proximity does not guarantee the similarity of catchments and this 83
does not necessarily lead to the grouping of hydrologically similar sites. Indeed, the 84
hydrological response of a catchment is a function of a set of physiographic and meteorological 85
attributes of the catchment which are often not continuous in space. Alternatively, such 86
attributes can be employed as surrogates of the hydrological behaviour to define homogeneous 87
regions. 88
Several methodologies for grouping sites into homogeneous regions were developed in 89
the past for the regionalization of flood flows (Acreman and Sinclair, 1986; Burn, 1990; 90
Hosking and Wallis, 1993; Ouarda, 2016). Homogeneous regions have been defined as 91
geographically contiguous regions, geographically non-contiguous regions, or as hydrological 92
neighbourhoods. For the delineation of geographically non-contiguous regions, clustering 93
methods such as hierarchical cluster analysis (HCA) are often used. HCA identifies sites that 94
are identical with one another based on the distance between sites within the physiographic-95
meteorological space. The HCA method groups sites into fixed regions, which are exclusive of 96
one another. On the other hand, neighbourhood approaches identify hydrologically similar sites 97
for each target site separately. That means, every site can have a unique set of stations within its 98
neighbourhood. Obviously, this does not necessarily lead to homogeneous regions that are 99
exclusive of one another as in the case of HCA. This, consequently, might lead to having a 100
large number of stations in the neighbourhood of each target site depending on the criteria 101
employed for region delineation. The neighbourhood approach can be based on the region of 102
influence (ROI) principle (Burn, 1990) or on the use of canonical correlation analysis (CCA) 103
(Ouarda et al., 2001). In a comparison study dealing with regional flood frequency analysis 104
approaches, Ouarda et al. (2008a) indicated that the neighbourhood approach for the delineation 105
of groups of hydrologically homogeneous basins is superior to the fixed set of regions 106
approaches. This kind of comparison, although well established for floods, has not been carried 107
out for regional low-flow frequency analysis methods. 108
The spatial interpolation (SI) approach is based on the assumption that there is a 109
continuous and gradual spatial variation of flow characteristics. Based on this assumption, an 110
areal mapping of the flow characteristics is produced by interpolating the values at gauged sites 111
to estimate the values at unsampled locations. Interpolation techniques, such as regression or 112
kriging, were used for flow regionalization by a number of authors (Daviau et al., 2000; Eaton 113
et al., 2002; Huang and Yang, 1998). In order to avoid the scaling effect due to the differences 114
in the sizes of the contributing drainage areas at the observation sites, the map is produced 115
using specific flows (flows standardized by the size of the contributing area). Since flow 116
characteristics estimated at any gauged location in a region are assumed to be representative of 117
the whole catchment upstream of the gauge, the calculated flow values are usually assigned to 118
the centroids of gauged catchments (Smakhtin, 2001). The SI method does not take any of the 119
physiographic and meteorological attributes of a catchment into consideration and the 120
information for the regional estimation of the flow characteristics is acquired based only on 121
geographic proximity. This proximity, however, does not always guarantee similarity in the 122
hydrological response of catchments (Ouarda et al., 2001). Nevertheless, the approach can be 123
useful in the absence of detailed catchment physiographic and meteorological information. 124
Multiple linear regression (MLR), generally used in the regionalization of hydrological 125
extreme variables, assumes a linear relation between the response variable and the explanatory 126
variables. However, this assumption is not always met. To account for the presence of potential 127
non-linearities, alternative methods such as artificial neural networks (ANNs) or Generalized 128
Additive Models (GAMs) have been proposed. The use of ANNs for prediction and forecasting 129
in the fields of environmental and water resources modelling has become increasingly popular 130
since the early 1990s (Maier et al., 2010; Wu et al., 2014). ANNs were applied for the 131
regionalization of flood flows in Shu and Ouarda (2007), and low flows in Ouarda and Shu 132
(2009). The use of GAMs has been gaining rapid popularity in a number of fields such as 133
public health (Bayentin et al., 2010; Leitte et al., 2009; Vieira et al., 2009), renewable energy 134
(Ouarda et al., 2016), environmental studies (Wen et al., 2011; Wood and Augustin, 2002) and 135
hydrology (Rahman et al., 2018). Chebana et al. (2014) introduced GAMs for the 136
regionalization of flood flows. Nonlinear models were proven in a number of studies to be 137
superior to the traditional regression linear model for the estimation of hydrological extreme 138
variables (Durocher et al., 2015, 2016a, 2016b; Ouali et al., 2016a, 2016b, 2017; Wazneh et al., 139
2013, 2016). 140
The aim of the present work is to extend the application of the most recent methods used 141
in regional flood frequency analysis to the analysis of low-flow characteristics and compare 142
their performances in terms of reproducing at-site estimates. It is proposed here to introduce 143
GAMs to the regional estimation of low-flow characteristics and compare their performances 144
with the MLR approach frequently used in regionalization studies. The method of index flow is 145
not considered here based on the fact that it obtained equivalent performances to MLR in 146
previous studies (Ouarda et al., 2001). GAMs and MLR are used in conjunction with the 147
methods HCA, ROI and CCA for the delineation of homogeneous regions. GAMs and MLR are 148
also applied on the whole study area without the delineation of homogeneous regions. This is 149
justified by the fact that in Chebana et al. (2014), GAMs, in conjunction with the 150
neighbourhood approach, did not provide a significant gain in performance compared to the 151
linear approach. A SI method using splines is also applied in the present study. The regional 152
models are applied to a group of catchments in the province of Quebec (Canada) and 153
performances are compared. 154
The paper is organized as follows: A brief theoretical overview of the regionalization 155
approaches that are considered in this research is presented in the next section. The case study 156
is presented in Section 3. The methodology is presented in Section 4 and the results of the 157
intercomparison are illustrated in Section 5. Finally, the conclusions are presented in Section 6. 158
159
2. Theoretical background
1602.1. Delineation of homogeneous regions 161
2.1.1. Hierarchical cluster analysis (HCA)
162
HCA is a collection of statistical methods which identify groups of samples that behave 163
similarly or show similar characteristics. The first step in HCA is the establishment of the 164
similarity between each pair of stations in the dataset. This is done by computing the distance 165
between stations in the space defined by a group of selected physiographic-meteorological 166
variables using a distance function. The selected catchment attributes are chosen from those 167
that exhibit a relationship with the flow characteristics and for which the values are available 168
for all sites in the network (Burn, 1989). Then, stations are grouped into a binary hierarchical 169
cluster tree. In HCA, each station is initially assigned to its own singleton cluster by using a 170
linkage function which is based on the distance information generated in the first step. The 171
analysis then proceeds iteratively, at each stage joining the two most similar clusters into a new 172
one, until there is only one overall cluster. To represent the results of a cluster analysis, a 173
dendrogram (tree diagram) is used. Cluster formation is followed by a procedure for 174
determining groupings of clusters to create hydrologically homogeneous regions. This step can 175
be carried out either by detecting natural groupings in the hierarchical tree or simply by cutting 176
off the tree at a point which may be determined by the targeted number of clusters. 177
The application of HCA to the delineation of homogeneous regions is hence not 178
automatic, as the user must intervene at each step to select among a number of choices. In the 179
first step, the user must select the most relevant physiographic and/or meteorological variables 180
that will be used in the computation of the distances between stations. A variety of distances, 181
such as the Euclidean distance, Mahalanobis distance or City-block distance may be employed 182
at this stage. The choice of the linkage function (nearest neighbour, furthest neighbour, Ward’s 183
method, etc.) also has a significant impact on how the clusters are formed. Finally, the choice of 184
the cut-off distance on the hierarchical tree must reflect the objective pursued by the user, e.g. 185
finding the optimal number of clusters. For a more thorough description of the various aspects 186
of the HCA technique, the reader is referred to textbooks such as Rencher and Christensen 187
(2012). 188
2.1.2. Canonical correlation analysis (CCA)
189
Canonical correlation analysis (CCA) consists in reducing two groups of variables into 190
pairs of canonical variables, which are linear combinations of the variables in each group and 191
are established in such a way that the correlations between the pairs are maximized. There are, 192
in general, as many canonical pairs (p) as the minimum number of variables in either of the two 193
groups. The analysis is usually performed on the standardized data and the canonical variables 194
are also standardized such that they have a unit variance. In the context of identifying the 195
hydrological neighbourhood corresponding to a given basin for the regionalization of low 196
flows, the variables constituting the first group are defined as a set of low-flow characteristics, 197
which are generally established as low flows associated with different occurrence probabilities. 198
Those constituting the second group can be defined based on a set of physiographic and/or 199
meteorological characteristics of the drainage basins. 200
The identification of the hydrological neighbourhood of a basin using CCA is performed 201
based on the sampling theory of the canonical variables and the corresponding canonical 202
correlations. Let W and V be p-dimensional vectors of the canonical variables corresponding to 203
the hydrological and the physiographic-meteorological variables respectively, (λ1,…,λp) a
204
sequence of the corresponding canonical correlation coefficients, and Λ = diag(λ1,…,λp). If W
205
and V are jointly p-normally distributed, the conditional distribution of W given V is 206 approximately p-normal: 207
2
0 0 | Np , p W V v Λv I Λ , (1) 208where Ip is a p×p identity matrix, and v0 denotes the corresponding values of the canonical 209
physiographic variables for the target basin. Eq. (1) implies that W would be scattered around a 210
mean positionΛv with a conditional probability density function given by: 0 211
/2 2 1/2
2
1
0 0 0 1 | 2 exp 2 p p p f
W V v I Λ W Λv I Λ W Λv , (2) 212where
WΛv0
denotes the transpose of the matrix
W Λv 0
. The Mahalanobis distance 213given by the quadratic form of the conditional distribution, 214
1
2 2
0 p 0
D WΛv I Λ W Λv , can be used to define a homogeneous neighbourhood 215
for the target basin as the region in the canonical space W where the realizations w of W for 216
which V = v0 would be found. 217
The 100(1)% confidence level neighbourhood is therefore defined as the set of 218
basins having location vectors W in the hydrological canonical space such that: 219
2
1
2 0 p 0 ,p W Λv I Λ W Λv χ , (3) 220where χ2, pis such that, for an observed Mahalanobis distance χ , 2 P
χ2χ2,p
1 . Eq. (3)221
describes the interior of an ellipsoidal region in the canonical space W. Detailed description of 222
the theoretical background as well as application of the CCA methodology for the identification 223
of hydrological neighbourhoods is presented in Ouarda et al. (2000). 224
2.1.3. Region of influence (ROI)
225
Similar to the CCA approach, the ROI method is also based on the identification of 226
homogeneous neighbourhoods for each target site and was first proposed by Acreman (1987). 227
Later, Burn (1990) adopted it for the regionalization of flood flows and named it the “region of 228
influence” method. ROI was used for the estimation of low-flow statistics in Holmes et al. 229
(2002, 2005). In this method, each station is considered the centre of its own region formed by 230
stations with similar flow characteristics. The identification of a ROI for a given station is 231
based on a Euclidean distance in a multidimensional space defined by a set of statistical 232
measures of the hydrological attributes of a site as well as the physiographic and meteorological 233
attributes of the contributing basin. For ungauged sites, only physiographic and meteorological 234
catchment attributes are used to define the space. The ROI for a station constitutes all stations 235
within a certain critical distance from the target site. A similar concept is implemented in this 236
work for the regionalization of low-flow characteristics. 237
To avoid the possible bias that might result due to the inconsistency of the scales of the 238
different attributes, the Euclidean distance Dijbetween stations i and j is computed using the 239
standardized values of the hydrological and physiographic-meteorological attributes as: 240
12 2 1 K i j ij k k k D C C
, (4) 241 where i k C and j kC are the standardized values of attribute k for stations i and j respectively, 242
and K is the number of attributes used to define the Euclidean space. The attributes used to 243
define the space are selected based on the knowledge of their relevance to low-flow 244
characteristics of the contributing basin. Once they are selected, the stations to be included into 245
the ROI for a given target station are selected as those within a certain threshold distance i: 246
ROIi k D: ik
i . (5)247
The value of i is fixed in such a way that there is a good compromise between the number of 248
stations in the neighbourhood and the hydrological homogeneity of the selected stations. i has 249
a specific value for a given site and is a function of a set of physical conditions pertaining to the 250
site. More details concerning the method and the definition of the thresholds are given in 251
Ouarda (2016). 252
2.2. Regional estimation methods 253
2.2.1. Multiple linear regression (MLR)
254
The method of MLR allows to obtain a regional estimate of the low flow by establishing 255
a direct relationship between the hydrological variables (low-flow quantiles) and the 256
physiographic-meteorological explanatory variables. Topographic parameters such as relief of 257
the catchment (Vogel and Kroll, 1990, 1992), which is defined as the difference between the 258
elevations of the summit of the catchment and that of the gauging station, are among the 259
physiographic variables widely used for the estimation of low-flow quantiles. Additionally, 260
geological parameters such as the proportions of gravel and silt also have a significant influence 261
on low flows (Dingman and Lawlor, 1995). Among the meteorological variables, mean annual 262
precipitation is the most widely used variable (Chang and Boyer, 1977). Other parameters, such 263
as the 10-year return period value of the maximum temperature over seven consecutive days, 264
have also been implemented (Chang and Boyer, 1977). 265
The MLR method is applied on a group of catchments which are similar in terms of the 266
statistical properties of their hydrological responses (Hosking and Wallis, 1993). It is often 267
assumed that the relationship between the explanatory variables and the T-year return period d-268
day minimum flow has the following form: 269 , 0 1 exp( ) i p d T i i Q X
, (6) 270where i is a model coefficient associated with the explanatory variable X (i 0 is the ordinate 271
at the origin), p is the number of explanatory variables used in the model and is the 272
multiplicative error of the model. This error can also be additive and in that case, the 273 relationship becomes: 274 , 0 1 i p d T i i Q X
. (7) 275A logarithmic transformation is generally applied to linearize the relation in Eq. (6): 276
, 0 1
log log log
p d T i i i Q
X
. (8) 277The coefficients i of the model are generally estimated using the ordinary least squares 278
approach (Thomas and Benson, 1970), the weighted least squares method (Tasker, 1980) or the 279
generalized least squares method (Kroll and Stedinger, 1998; Stedinger and Tasker, 1985). 280
2.2.2. Spatial interpolation (SI)
281
Interpolation of low flows is generally performed at grids (regular or irregular) across 282
the study region using techniques such as 1) linear interpolation, where low flows are assumed 283
to vary linearly between adjacent observations, and 2) averaging technique, where the mean of 284
low flows of all stations contained within the grid cell is used as estimator, either as a simple 285
average or area-weighted average (Arnell, 1995). An interpolation method widely used in earth 286
sciences is the minimum curvature method (Smith and Wessel, 1990). This method consists in 287
fitting a twice differentiable surface through the observations. Physically, it can be interpreted 288
as stretching and deforming an elastic plate so that it fits all the observations. This might, 289
however, result in large oscillations and unrealistic inflection points in the fitted surface. To 290
avoid this, Smith and Wessel (1990) introduced a tension term in the flexibility equation that 291
leads to minimization of the oscillations and the inflection points. Formally, the fitted surface is 292
the solution of Eq. (9): 293
4 21
H
H 0, (9)294
where H is the low flow standardized by the drainage area,
4 and
2 are the biharmonic and 295Laplace operators respectively, and
0,1 is the tension term. Eq. (9) is solved under the 296constraint that the observed values are honoured at the observation locations.
0
leads to 297undesirable oscillations of the surface and
1
yields a harmonic surface. Johnston and 298Merrifield (2000) suggested a value of
0.25
for the interpolation at regular grids of 299geographic coordinates from irregularly spaced stations. 300
2.2.3. Generalized additive models (GAMs)
301
GAMs, introduced by Hastie and Tibshirani (1986), extend the generalized linear 302
models (GLMs) by replacing the linear predictor by a set of smooth functions of the 303
explanatory variables. GLMs are themselves a generalization of MLR in which the response 304
variable Y can follow any distribution of the exponential family and the link function g 305
transforms Y to a scale where the model is linear. For a response variable Y, GAMs can be 306 expressed by: 307 1 (E( | )) ( ) p j j j g Y f X
X , (10) 308where fj is the smooth function of the j-th explanatory variable Xj, X is a matrix whose 309
columns correspond to a set of p explanatory variables, is an intercept and g(.) is a 310
monotonic link function. With the smooth functions, GAMs are more flexible than GLMs by 311
allowing a non-linear relation between the response variable and each of the explanatory 312
variables. 313
The smooth function fj can be defined by a linear combination of q basis functions 314 ( ) ji b x : 315 1 ( ) ( ) q j ji ji i f x b x
, (11) 316where ji are smoothing coefficients. The smooth function in GAMs is often estimated by a 317
spline defined by a curve composed of piecewise polynomial functions, joined together at 318
points called knots. A number of spline types have been proposed in the literature: cubic 319
splines, P-splines, B-splines, etc. In a regression spline, the number of knots is considerably 320
reduced. For such spline, the position of the knots needs then to be chosen. However, with 321
penalized splines, the exact location and the number of the knots are not as important as the 322
smoothing parameters which control the smoothness of the spline. 323
The natural cubic spline interpolates each data value. To avoid the problem of 324
overfitting, GAMs are usually optimized by maximizing the penalized log-likelihood: 325 1 1 ( ) ( ) 2 p p j j j l l
β β β S β , (12) 326where β is a matrix of smoothing coefficients, β is the transpose of β,
l β
( )
is the log-327likelihood function, j is the smoothing parameter of the j-th smooth function fj, and Sj is a
328
matrix of known coefficients (Wood, 2008). The parameter j controls the degree of 329
smoothness of the smooth function. With values ranging from 0 to 1, 0 corresponds to the un-330
penalized case and 1 to the completely smoothed case. The optimum value of j is a right 331
balance between the fitting objective and smoothness. The function lp(.) is maximized for λ, a
332
given vector of smoothing parameters, by the penalized iteratively reweighted least squares 333
method (P-IRLS; Wood, 2004). λ is found iteratively according to a criterion such as the 334
generalized cross validation (GCV; Wahba, 1985), unbiased risk estimator (UBRE; Craven and 335
Wahba, 1978) or maximum likelihood (ML). 336
3. Case study
338The proposed approaches are applied to the hydrometric station network of southern 339
Quebec (Canada). The hydrological and physiographic-meteorological variables used in the 340
present study come from a low-flow frequency analysis study by Charron and Ouarda (2015). 341
In the present study, we analyse separately the summer and winter low-flow quantiles Qd T,
342
corresponding to return periods of T = 2 and 10 years for a duration of d = 7 days, and to a 343
return period of T = 5 years for a duration of d = 30 days. These indices are the most widely 344
used in Canada for the analysis of water supply systems during droughts and for the study of 345
the waste assimilative capacity of streams (Ouarda et al., 2008b). Data from 190 hydrometric 346
stations managed by the Ministry of Environment of Quebec (MENV) were used (Data are 347
available at https://www.cehq.gouv.qc.ca/hydrometrie/historique_donnees/default.asp). The 348
database does not include any nested catchments. Only stations that meet the following three 349
criteria were retained: First, the gauged river should have a flow regime that is natural. 350
Secondly, the station should have a historical record period of at least 10 years. Finally, the 351
historical data at the station should meet the basic assumptions of independence and 352
stationarity. The non-parametric test of Wald and Wolfowitz (1943) was used to test the 353
independence of the d-day low-flow series, and the non-parametric Kendall test (Kendall, 1975) 354
was used to test the stationarity of the d-day low-flow series. 355
Finally, 134 and 135 stations were retained for the analysis of Q30,T for the summer and 356
winter seasons, respectively. Similarly, 129 and 133 stations were retained for the analysis of 357
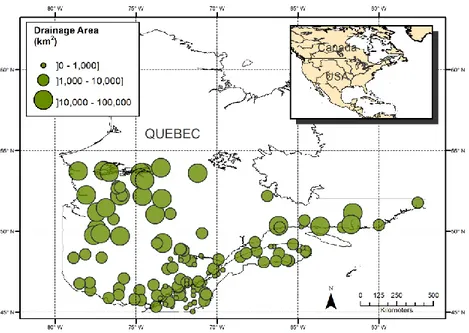
7,T
Q for the summer and winter seasons, respectively. Fig. 1 shows the location of the gauging 358
stations that were retained for any dry season and any low-flow duration. The diameters of the 359
circles are proportional to the basin areas which vary between 0.69 and 96,600 km2 with a 360
median value of 1548 km2. The stations cover a large area in the southern half of the province 361
of Quebec. The largest catchments are located towards the northern part of the study area. The 362
average flow record size is 32 years of data. Winter mean temperatures for the study area vary 363
between -10 °C in the south and -21 °C in the north. Summer mean temperatures vary between 364
20 °C in the south and 12 °C in the north. The typical annual hydrograph in the area is 365
characterized by an important spring flood caused by snow melt, followed by a summer dry 366
season. Important rainstorms usually cause another flood season in the fall, followed by a 367
winter dry season caused by the lack of liquid precipitation and during which the soil is often 368
frozen. Note that low-flow data at a number of these stations were analysed in several previous 369
studies for the detection of non-stationarities and for the multivariate characterization of low-370
flow descriptors (Ehsanzadeh et al., 2011; Khaliq et al., 2008; Lee et al., 2013, 2017). 371
A local low-flow frequency analysis was carried out at each station of the database in 372
order to estimate at-site low-flow quantiles Qd T, corresponding to the various return periods T 373
and durations d. Low-flow d-day series were fitted with the following statistical distributions 374
(Rao and Hamed, 2000): the Generalized Extreme Value distribution (GEV), Gumbel (EV1), 375
Weibull (W2), two- and three-parameter Lognormal (LN2 and LN3 respectively), Gamma (G), 376
Person type III (P3), Log-Pearson type III (LP3) and Generalized Pareto (GP) distributions. The 377
distribution that best fits the data at each station is then selected based on the Bayesian 378
information criterion (BIC; Schwarz, 1978) to allow for appropriate local estimation of low-379
flow quantiles. Fig. 2 illustrates the frequency with which the various distributions were 380
selected for the winter and summer 7-day low flows. Descriptive characteristics of the obtained 381
quantiles are summarized in Table 1. 382
A set of physiographic and meteorological variables for each catchment of the study 383
area are available and come from Charron and Ouarda (2015). The characteristics of the 384
selected stations are provided in the supplementary Table S1. Table 1 lists all the variables as 385
well as their descriptive statistics. Catchment delineation for the hydrometric stations of this 386
study was performed in the ESRI ArcGIS environment using the ESRI Arc Hydro Tools 387
available at resources.arcgis.com/en/communities/hydro. Arc Hydro Tools include 388
functionalities for catchment delineation from Digital Elevation Models (DEMs). The DEM 389
used in this study is Canada 3D available from Natural Resources Canada at 390
http://ftp.geogratis.gc.ca/pub/nrcan_rncan/elevation/canada3d/. Catchment rasters obtained 391
were after converted to polygon features which were used to compute the spatial averages of 392
the physiographic and meteorological variables in this study. 393
The catchment area (AREA), the latitude (LAT) and longitude (LONG) of the 394
catchment centroid were computed directly from the catchment polygon. The average slope of 395
the catchment (MSLP) was computed from the DEM. The variables related to the land 396
coverage, mean curve number (MCN), percentage of forest cover (PFOR) and percentage of 397
lakes (PLAKE), were computed from digital maps of Quebec (Maps are available from Natural 398
Resources Canada at http://open.canada.ca/en/open-maps). MCN consists of an area-weighted 399
average of the curve number (CN) values in the catchment. The major factors that determine 400
CN are the hydrological soil group, cover type, treatment, hydrological condition, and 401
antecedent runoff condition (USDA, 1986). Its values range from 0 to 100 with a lower value 402
representing the most pervious soil and a higher value representing the most impervious soil. 403
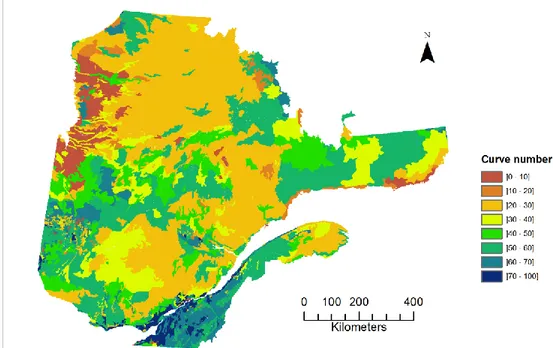
Fig. 3 shows the distribution of the values of CN within the study area. 404
The five meteorological variables, mean total annual precipitation (PTMA), average 405
summer/fall liquid precipitation (PLMS), average degree-days below 0 °C (DDBZ), average 406
degree-days above 13 °C (DDH13) and average number of days where mean temperature 407
exceeds 27 °C (NDH27), were computed through a spatial interpolation of the meteorological 408
data of the MENV. Universal kriging (Isaaks and Srivastava, 1989) was implemented for the 409
spatial interpolation. Using the geographic location of every meteorological station, an 410
interpolation of meteorological contour lines was performed for the whole province. The 411
meteorological stations which were selected had at least 15 years of data and the earliest 412 starting year is 1940. 413 414
4. Methodology
415 4.1. Regional models 416The methods presented in Section 2 for the delineation of homogeneous regions are used 417
in conjunction with the methods MLR and GAMs for the transfer of hydrological information. 418
These regional models are denoted by HCA+MLR, ROI+MLR, CCA+MLR, HCA+GAM, 419
ROI+GAM and CCA+GAM. As indicated in Section 1, other tested models are obtained by 420
applying MLR and GAMs to the whole dataset without delineation of homogeneous regions. 421
These models are denoted respectively by ALL+MLR and ALL+GAM. In this study, the R 422
package mgcv (Wood, 2006) is used to estimate the GAMs parameters. Cubic regression splines 423
are considered as smooth functions and the GCV score is used to optimize λ. The knots in 424
smooth functions are placed at a number of quantiles of the distribution of the unique values x 425
of a given explanatory variable. 426
For each regional model, different physiographic-meteorological attributes are used for 427
the summer and winter seasons. A backward stepwise regression method, applied to all stations, 428
is used to select the optimal explanatory variables to be used with the methods MLR and 429
GAMs. This stepwise method is presented in the next section. To apply the delineation 430
methods, variables considered to be the most relevant in terms of explaining the low-flow 431
processes need to be selected. In this study, the variables selected for MLR with the stepwise 432
regression method constitute the physiographic-meteorological variables used in each of the 433
delineation methods. The same homogeneous regions obtained for a given delineation method 434
are used in conjunction with either MLR or GAMs (i.e. the same regions are used for 435
HCA+MLR and HCA+GAM, for ROI+MLR and ROI+GAM, and for CCA+MLR and 436
CCA+GAM). 437
The SI method is also applied to the study area using the minimum curvature method 438
presented in Section 2.2.2. In that case, only variables LAT and LONG are used for 439
interpolation of specific quantiles and thus no selection of variables is required. The spatial 440
interpolation performed in this study was carried out with the Generic Mapping Tools (Wessel 441
et al., 2013). Once the map is produced, the low flow at an ungauged basin is estimated by 442
multiplying the contour value corresponding to the location of its centroid by its drainage area. 443
The contour value corresponding to the basin centroid is computed using the nearest neighbour 444
approach from the grid values. 445
With the standard methods used to define the threshold in ROI and CCA, the size of 446
homogeneous regions can vary considerably from one region to another. For instance, for a 447
given fixed threshold, stations located on the edge of the cloud of points defined by the 448
canonical space for CCA or the Euclidian space for ROI will have fewer stations within their 449
neighbourhood, while stations located near the center of the cloud of points will have more 450
stations within their neighbourhoods (Leclerc and Ouarda, 2007). Given that the sample size is 451
essential for the reliability of the estimates obtained by MLR and GAMs, it was decided that for 452
each target station, the size of the region is increased until a selected optimal size is reached. It 453
was decided to fix the size of each region to three times the number of parameters to estimate in 454
GAMs, which has more parameters to estimate than the MLR model. The number of 455
parameters to estimate in GAMs depends on the number of predictors in the model and the 456
number of knots in the smooth functions. 457
4.2. Stepwise regression 458
To select the optimal explanatory variables, the backward stepwise method is used 459
(Marra and Wood, 2011). In this approach, the regression method (MLR or GAMs) is initially 460
applied with a model including all the explanatory variables. At each step, the variable with the 461
highest p-value, for the null hypothesis that the parameter (for MLR) or the smooth term (for 462
GAMs) is zero, is removed. The procedure ends when the p-values of all the remaining 463
variables are below a given threshold (5%). For the aim of simplicity, the explanatory variables 464
obtained with the stepwise regression procedure applied to Q7,2 are used as the explanatory 465
variables to estimate the other quantiles. Quantile Q7,2 is used as the quantile of reference 466
because, having the smallest return period, it can be considered the most reliable quantile. 467
4.3. Validation 468
A leave-one-out cross-validation technique (Jackknife method) was employed to 469
evaluate the performance of the regional estimates of the low-flow quantiles. The at-site 470
estimate of the quantile value of interest at a given station is temporarily removed from the 471
sample and a new value is estimated from the regression relationship established using data 472
from the remaining stations within the homogeneous region. This process is repeated for the 473
entire set of gauged sites. The estimated quantiles are then compared with the at-site quantile 474
estimates computed from the observed values. The following five indices are used to evaluate 475
the performances: the Nash criterion (NASH), the root mean squared error (RMSE), the relative 476
root mean squared error (rRMSE), the mean bias (BIAS), and the relative mean bias (rBIAS). 477
These performance indices are frequently used for the assessment of low flows (see Ouarda and 478 Shu, 2009). 479 480
5. Results
481In this section, results of the selection of the physiographic and meteorological variables 482
included in the MLR and GAMs are first presented. Then, results related to the delineation 483
methods and the SI method are discussed. Finally, a comparison of the different regionalization 484
models is presented. 485
5.1. Selection of the physiographic and meteorological variables for MLR 486
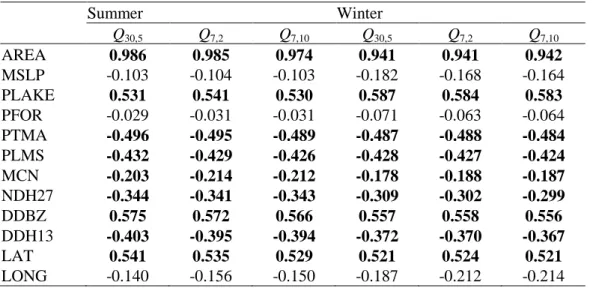
Pearson correlation coefficients between the various explanatory variables and low-flow 487
quantiles are presented in Table 2. These results suggest that the catchment area (AREA) is a 488
particularly important variable and explains most of the variance of low-flow quantiles. Other 489
important variables are PLAKE, mean annual total and liquid precipitation (PTMA and PLMS), 490
number of days where the temperature is higher than 27 °C (NDH27), degree-days below 0 °C 491
and higher than 13 °C (DDBZ and DDH13), and latitude (LAT). The log-linear regression 492
model in Eq. (8) is considered for the estimation of the low-flow quantiles. Following the 493
application of the backward stepwise procedure with MLR, the models for the summer season 494
are defined by: 495
30,5log 31.69 1.07 log(AREA) 1.94 log(DDBZ) 0.62 log(MCN) 2.07 log(PTMA) 0.17 log(NDH27) 0.05log(PLAKE)
Q
, (13)
496
7,2log 25.93 1.05log(AREA) 1.78log(DDBZ) 0.76 log(MCN) 1.50 log(PTMA) 0.15log(NDH27) 0.08log(PLAKE)
Q
, (14)
497
7,10log 32.26 1.09 log(AREA) 2.13log(DDBZ) 0.80 log(MCN) 1.97 log(PTMA) 0.19 log(NDH27) 0.04 log(PLAKE)
Q
, (15)
498
and the models for the winter season are defined by: 499
30,5log 9.40 0.98log(AREA) 0.14 log(PLAKE) 0.79 log(PLMS) 0.28log(MCN)
Q
, (16)
500
7,2log 9.02 0.97 log(AREA) 0.15log(PLAKE) 0.81log(PLMS) 0.36 log(MCN)
Q
, (17)
501
7,10log 9.63 1.00 log(AREA) 0.17 log(PLAKE) 0.92 log(PLMS) 0.54 log(MCN)
Q
, (18)
502
where the predictors in Eqs. (13)-(18) are ordered from the most to the least significant. The 503
stepwise procedure allows a selection of variables that minimizes the correlations between the 504
explanatory variables. The AREA is the most important variable and variables AREA, MCN 505
and PLAKE are important for both seasons. Mean annual total precipitation PTMA and mean 506
annual liquid precipitation PLMS are selected for the summer and winter season respectively. 507
Two temperature-related variables are selected for summer low flows (degree-days below 0 °C 508
DDBZ and number of days higher than 27 °C NDH27) while no temperature variables are 509
selected for winter low flows. 510
5.2. Selection of the physiographic and meteorological variables for GAMs 511
A different selection of variables is expected with GAMs because predictors presenting 512
a non-linear relationship with the explained variable were disadvantaged with MLR over those 513
presenting a linear relationship. The logarithmic transformation of the response variables was 514
necessary in order to meet the assumption of constant variance of the residuals. It was also 515
found that applying the logarithmic transformation to the variable AREA improves 516
considerably the performances. Following the application of the backward stepwise procedure 517
with GAMs, and given that a large number of variables would also require a large number of 518
stations in the neighbourhoods, the optimal number of variables during summer was identified 519
to be 6. The model used for the summer season within the models HCA+GAM, ROI+GAM and 520
CCA+GAM is then defined by: 521
, 1
2 34 5 6
log log AREA (DDH13) (MCN)
(PLMS) (PLAKE) (DDBZ) d T Q f f f f f f . (19) 522
Following the application of the backward stepwise procedure with GAMs, the model for the 523
winter season is defined by: 524
, 1
2 34 5
log log AREA (PLAKE) (PLMS)
(MCN) (DDBZ) d T Q f f f f f . (20) 525
Variables AREA, PLAKE, MCN, mean annual liquid precipitation PLMS and degree-days 526
below 0 °C DDBZ are important for both seasons. In addition, with GAMs, degree-days higher 527
than 13 °C DDH13 is included for summer low flows. 528
The smooth functions obtained for log(Q7,10) for the summer and winter seasons are 529
presented in Figs. 4 and 5 respectively. Smooth functions allow interpreting the influence of 530
each variable without the effect of the others. It can be observed that log(AREA) is perfectly 531
linear with log(Q7,10) for both seasons with narrow confidence intervals and small residuals. 532
Some variables present important non-linear behaviours (e.g. MCN for both seasons, degree-533
days below 0 °C DDBZ for summer, and mean annual liquid precipitation PLMS and PLAKE 534
for winter) while others are linear (e.g. degree-days higher than 13 °C DDH13 and PLAKE for 535
summer, and degree-days below 0 °C DDBZ for winter). The slopes of the smooth functions of 536
PLAKE are positive. This is explained by the fact that lakes sustain the streamflow during dry 537
periods. The slopes of the smoothing functions of MCN are negative, reflecting the fact that 538
more impervious (pervious) soil retains (releases) more water during dry seasons. The smooth 539
functions of mean annual liquid precipitation PLMS for both seasons are increasing because 540
precipitation recharges groundwater. The negative slope and the positive slope of the smoothing 541
functions of degree-days higher that 13 °C DDH13 and degree-days below 0 °C DDBZ, 542
respectively, for summer low flows indicate that the colder the region is, the higher the low 543
flow will be during summer. A possible explanation is that temperature influences snow melt 544
during spring and for colder regions, the release of water from snow melt is delayed, resulting 545
then in higher low flows during the summer season. In the case of winter low flows, the slope 546
of the smooth function of degree-days below 0 °C DDBZ is negative because colder 547
temperatures increase the length of the dry season leading to a decrease in low flows. Note that 548
these previous conclusions cannot be made only on the basis of the correlation coefficients in 549
Table 2. For instance, the positive coefficient of correlation for PLAKE is in agreement with 550
the positive slope of the smooth function of PLAKE. However, in the case of the precipitation-551
related variables, correlations are negative while the slopes of the smooth functions are positive, 552
and in the case of degree-days below 0 °C DDBZ for winter, correlations are positive while the 553
slope of the smooth functions are negative. Thus, conclusions drawn from Pearson’s 554
correlations differ from those obtained from GAMs. Because of their additive nature, GAMs 555
allow to interpret the impact of a given explanatory variable on the response variable 556
independently of the other explanatory variables. These results demonstrate that relationships 557
based only on correlations can be misleading. 558
5.3. Delineation of regions with HCA, ROI and CCA 559
For the application of the HCA method, the standardized Euclidean distance measure 560
based on the catchment descriptors selected for each season was employed to determine the 561
similarity between stations. Clustering was performed using Ward’s algorithm (Ward, 1963), 562
which is based on minimizing the sum of the square of the distances between each site within a 563
given cluster and the centroid of the cluster to ensure maximum similarity of the elements of 564
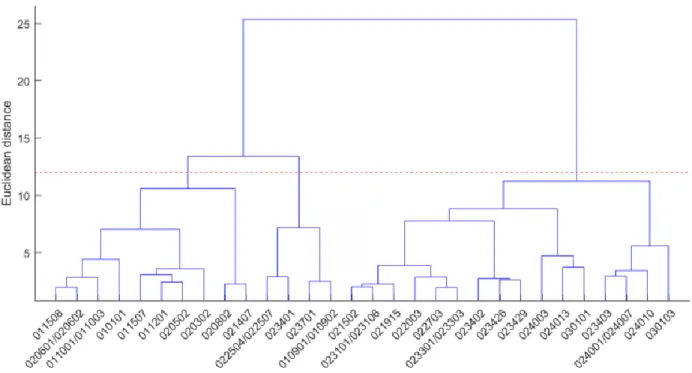
the cluster (group). Fig. 6 shows the dendrogram obtained after application of this algorithm for 565
the summer season. The choice of the cut-off distance has a significant impact on the number of 566
stations in the regions and on the performances. The distance should not be too short to avoid 567
very small regions in which case the regression would be impossible or would lead to weak 568
performances. With this method, the number of stations in each region could be very different. 569
In the present case, the cut-off distance is selected to provide three regions for both seasons. 570
The regions include 61, 33 and 42 stations for summer and 76, 30 and 30 stations for winter 571
respectively. 572
Considering that 6 and 5 variables, respectively, were used for the summer and winter 573
low flows and that 5 knots were considered in the smooth functions, the optimal neighbourhood 574
size for the ROI and CCA methods was fixed at 75 and 63 stations for the summer and the 575
winter season, respectively. CCA requires the normality of the hydrological and physiographic-576
meteorological variables. Some variables were hence transformed to achieve normality. As one 577
can see in Table 1, some of the physiographic and meteorological variables show clear 578
asymmetry. Thus, a logarithmic transformation was applied to the low-flow quantiles, AREA 579
and DDBZ. For PLAKE, a square root transformation was found to be more appropriate. Fig. 7 580
illustrates the hydrological and physiographic-meteorological canonical spaces for both 581
seasons. No consistent clusters of stations are visible in the canonical hydrological spaces, 582
indicating that the delineation of fixed regions may not be the most appropriate approach. This 583
confirms that the neighbourhood approach adopted in the present study is more appropriate. 584
5.4. Method of spatial interpolation (SI) 585
The studied quantiles at each station were standardized by the area of the drainage basin 586
corresponding to the station. The obtained values of specific quantiles were estimated at a 587
regular grid of 2’ longitude × 2’ latitude using the minimum curvature method discussed in 588
Section 2.2.2. Fig. 8 shows the contour maps of specific quantiles of Q7,2 for low flows during 589
the summer and winter seasons. The map for the summer season displays generally a vertical 590
gradient of specific quantiles with a positive trend towards the north. This indicates an increase 591
in the specific quantiles from warmer to colder regions. The same relation of summer low flows 592
with temperature was observed previously in Section 5.2 with the smooth functions. For the 593
winter season, no similar vertical gradient is visible and the distribution of specific quantiles is 594
more homogeneous through the study area. This indicates a weaker influence of the 595
temperature on winter low flows which was also observed in Sections 5.1 and 5.2. 596
5.5. Comparison of regional models 597
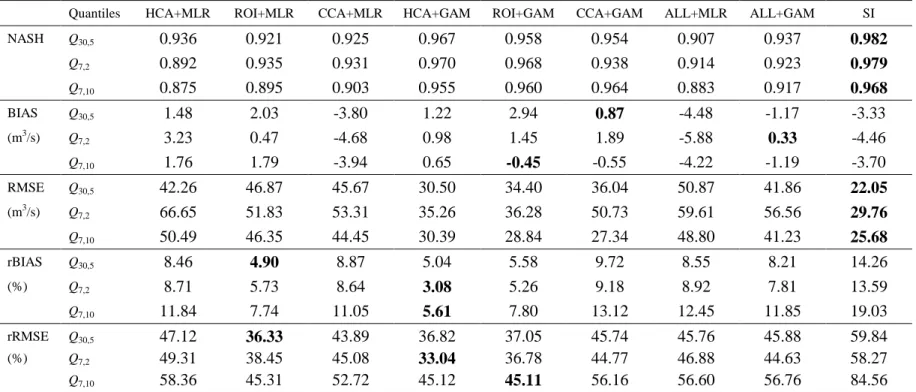
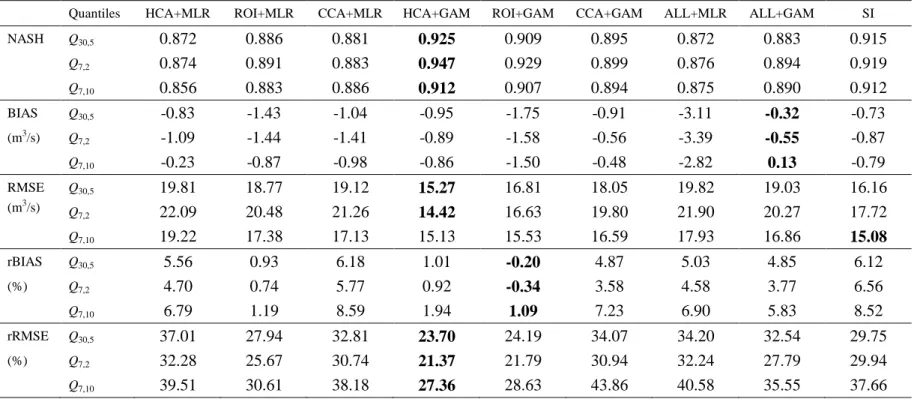
A comparison of the performances obtained with the different regional models is carried 598
out in this subsection. The performance indices obtained from the cross-validation analysis for 599
summer and winter low-flow quantile estimates are presented in Tables 3 and 4, respectively. 600
The indices associated with relative errors (rBIAS and rRMSE) provide a different set of 601
information than the indices associated with absolute errors (NASH, BIAS, RMSE) since the 602
latter ones end up giving an overly large weight to a few extremely large basins. This is 603
especially the case for the present database since basin areas range from less than one km2 to 604
almost 100,000 km2. Plots of regional estimates versus at-site values for the summer and winter 605
low-flow quantiles Q7,10 are presented in Figs. 9 and 10, respectively. Plots of the relative 606
residuals for summer and winter low-flow quantiles Q7,10 are presented in Figs. 11 and 12, 607
respectively. It can be noticed in these later figures that the highest relative errors are obtained 608
for catchments with small to moderate areas and which have thus more weights in the indices of 609
relative errors. 610
The cross-validation results indicate that, according to NASH, better fits are obtained 611
for summer low flows than for winter low flows. This may be explained by the facts that more 612
significant variables were included in the regional models for summer low flows and that the 613
correlations presented in Table 2 are for most cases higher for the summer quantiles. On the 614
other hand, higher rBIAS and rRMSE values are obtained for summer low flows. Among the 615
models using MLR, the ROI+MLR model provides generally the best performances for both 616
seasons regardless of the absolute or relative error indices. Methods using the neighbourhood 617
approach in conjunction with MLR (CCA+MLR and ROI+MLR) provide generally better 618
performances than the method using the fixed regions approach (HCA+MLR). The difference 619
in relative error between the two approaches can be significant, as for instance rRMSE is 58% 620
with HCA+MLR for the summer quantile Q7,10 while it is 45% with ROI+MLR. 621
The application of GAMs without the delineation of regions (ALL+GAM) leads to an 622
improvement of the absolute error indices in comparison to the models that use MLR. With 623
respect to the relative error indices, performances of ALL+GAM are rather similar to those 624
obtained with ALL+MLR, HCA+MLR and CCA+MLR, but not as good as those obtained with 625
ROI+MLR. When GAMs are used in conjunction with HCA or ROI, significant improvements 626
are obtained compared to ALL+GAM. The delineation method that benefits the most from the 627
introduction of GAMs is HCA, where the performances obtained are comparable or better than 628
those of ROI+GAM. In this regard, HCA+GAM is the best model with respect to RMSE and 629
rRMSE for the winter low flows. For a given delineation method as well as for the information 630
transfer methods applied to the whole study area, better performances are generally obtained 631
with the model using GAMs instead of the one using MLR. Overall best results are obtained 632
with ROI+GAM and HCA+GAM for both seasons, as these two combinations usually lead to 633
best performance indices for both absolute and relative cases. 634
Results also indicate that SI obtained good performances with respect to the absolute 635
error indices. However, poor results are obtained for the summer season with respect to the 636
relative error indices. Good performances for the summer season with respect to the absolute 637
error indices can be attributed to the fact that the biggest basin is much better estimated with SI 638
than with the other methods as it can be noticed in Fig. 9. These general poor performances are 639
somewhat expected considering the spatial discontinuity in catchment physiographic and 640
meteorological characteristics. However, the method has the advantage of allowing the 641
estimation at ungauged basins in cases where other catchment characteristics are not available. 642
6. Conclusions
644In this study, GAMs were introduced for the estimation of low-flow quantiles. 645
Comparison with other methods commonly employed for the regionalization of low flows was 646
also carried out. In all, nine regionalization models were compared. For six of them, MLR and 647
GAMs were applied within homogeneous regions using three different methods for the 648
delineation of homogeneous regions: hierarchical clustering analysis of the sites based on their 649
relative proximity within the physiographic-meteorological space, the region of influence 650
approach based on the proximity of the target site with the other sites within the physiographic-651
meteorological space, and canonical correlation analysis of a group of low-flow characteristics 652
and a group of physiographic and meteorological attributes of the sites. Within each delineated 653
region, either MLR or GAMs were used for the transfer of hydrological information. For two 654
other models, MLR and GAMs were applied to all stations of the study area without the 655
delineation of homogeneous regions. Finally, in the last model, a technique of spatial 656
interpolation was applied over the specific low flows of the study area. 657
The models were applied to a large selection of catchments in the province of Quebec. 658
The dataset on which the proposed methods were applied represents a challenge because it 659
includes a wide range of catchment sizes, including basins smaller than one km2 to others as 660
large as 100,000 km2. Additionally, most of the quantiles are concentrated around rather low 661
values. 662
GAMs allow to relate the hydrological variables to the explanatory variables through 663
non-linear functions, while the commonly used MLR assumes a linear relationship between the 664
response variable and the explanatory variables. However, hydrological processes are complex 665
in nature and the assumption of linearity is not always met. In order to improve the estimates, 666
GAMs were introduced here for the estimation of low-flow characteristics. The main advantage 667
of GAMs is that they provide explicit expressions of the functions between the response 668
variable and each of the explanatory variables. 669
A stepwise regression method was applied to the study dataset to select the optimal 670
variables to be included in the regional models. It was observed that some variables included in 671
GAMs present important non-linear behaviours. A leave-one-out cross-validation technique 672
was implemented to evaluate the performance of each of the approaches. GAMs applied to the 673
whole set of stations without homogeneous regions were found to lead to a good performance 674
with respect to the absolute error indices, while with respect to the relative error indices, this 675
model was found to be comparable to the approaches using MLR. When the homogeneous 676
regions approach was used in conjunction with GAMs, better performances were obtained 677
compared to the approach where GAMs are applied to the whole study area. These results 678
prove that it is best practice to delineate homogeneous regions before applying GAMs. 679
Performances were also improved when GAMs instead of MLR were used with the 680
homogeneous regions approach. In general, GAMs with the HCA and ROI approaches provide 681
the best overall results. These results indicate that it is relevant to use GAMs for the regional 682
estimation of low-flow characteristics. The results of this study show that the use of GAMs 683
instead of the linear model improves significantly the performances. GAMs can be easily 684
applied with available software tools. The delineation of homogeneous regions represents an 685
additional effort but results in significant improvements. 686
Another approach implemented here is based on the spatial interpolation of low-flow 687
characteristics from gauged sites to estimate the values at ungauged sites. While geographic 688
proximity of catchments by itself is not a good indicator of hydrological similarity between 689
catchments, the spatial interpolation method, which is based on the estimation of the low-flow 690
characteristics from the geographic pattern of the low flows is also found to produce acceptable 691
results. This is, indeed, a desirable outcome in that it signifies the usefulness of such an 692
approach in the absence of more informative descriptors for the regionalization of low flows. 693
Future work should focus on the extension of the Regional Streamflow Estimation 694
Based Frequency Analysis (RSBFA) approach to the low-flow case. This approach was 695
recently developed by Requena et al. (2017) and is based on the prior estimation of daily 696
streamflows at the target ungauged site (Shu and Ouarda, 2012). Future research should also 697
explore the impact of adopting the RSBFA on the combination of local and regional low-flow 698
information when the target site is partially gauged, and compare the results to more complex 699
statistical models such as the Bayesian model proposed by Seidou et al. (2006). The extension 700
of the regional models compared in the present study to the multivariate case is also of interest. 701
702
Acknowledgements 703
The support provided by the Natural Sciences and Engineering Research Council of 704
Canada (NSERC) and the Ministry of Environment of Quebec is gratefully acknowledged. The 705
authors are grateful to the Editor-in-Chief, Dr. Dan Ames, and to three anonymous reviewers 706
for their comments which helped improve the quality of the manuscript. 707