Série Scientifique
Scientific Series
99s-01
Globalization and Worker
Welfare in Late Nineteenth
Century Europe
Michael Huberman, Wayne Lewchuk
Montréal Janvier 1999
CIRANO
Le CIRANO est un organisme sans but lucratif constitué en vertu de la Loi des compagnies du Québec. Le financement de son infrastructure et de ses activités de recherche provient des cotisations de ses organisations-membres, d=une subvention d=infrastructure du ministère de l=Industrie, du Commerce, de la Science et de la Technologie, de même que des subventions et mandats obtenus par ses équipes de recherche. La Série Scientifique est la réalisation d=une des missions que s=est données le CIRANO, soit de développer l=analyse scientifique des organisations et des comportements stratégiques.
CIRANO is a private non-profit organization incorporated under the Québec Companies Act. Its infrastructure and research activities are funded through fees paid by member organizations, an infrastructure grant from the Ministère de l=Industrie, du Commerce, de la Science et de la Technologie, and grants and research mandates obtained by its research teams. The Scientific Series fulfils one of the missions of CIRANO: to develop the scientific analysis of organizations and strategic behaviour.
Les organisations-partenaires / The Partner Organizations $École des Hautes Études Commerciales
$École Polytechnique $Université Concordia $Université de Montréal $Université du Québec à Montréal $Université Laval
$Université McGill $MEQ
$MICST
$Alcan Aluminium Ltée $Banque Nationale du Canada $Bell Canada
$Caisse de dépôt et placement du Québec
$Développement des ressources humaines Canada (DRHC) $Egis
$Fédération des caisses populaires Desjardins de Montréal et de l=Ouest-du-Québec $Hydro-Québec
$Imasco $Industrie Canada $Microcell Labs inc.
$Raymond Chabot Grant Thornton $Téléglobe Canada
$Ville de Montréal
© 1999 Michael Huberman et Wayne Lewchuk. Tous droits réservés. All rights reserved. Reproduction partielle permise avec citation du document source, incluant la notice ©.
Short sections may be quoted without explicit permission, provided that full credit, including © notice, is given to the source.
ISSN 1198-8177
Ce document est publié dans l=intention de rendre accessibles les résultats préliminaires de la recherche effectuée au CIRANO, afin de susciter des échanges et des suggestions. Les idées et les opinions émises sont sous l=unique responsabilité des auteurs, et ne représentent pas nécessairement les positions du CIRANO ou de ses partenaires.
This paper presents preliminary research carried out at CIRANO and aims to encourage discussion and comment. The observations and viewpoints expressed are the sole responsibility of the authors. They do not necessarily represent positions of CIRANO or its partners.
Globalization and Worker Welfare in
Late Nineteenth Century Europe
*
Michael Huberman
H, Wayne Lewchuk
IRésumé / Abstract
* Corresponding Author: Michael Huberman, CIRANO, 2020 University Street, 25th floor, Montréal, Qc,
Canada H3A 2A5 Tel: (514) 985-4013 Fax: (514) 985-4039 e-mail: hubermam@cirano.umontreal.ca
† Université de Montréal and CIRANO ‡ McMaster University
Cet article porte sur la relation entre la tendance vers la convergence en Europe à la fin du dix-neuvième siècle et l'indicateur de bien-être choisi. On construit un indice de bien-être des travailleurs qui comprend les séries de salaires de Williamson et deux nouvelles séries sur les heures de travail et les réglementations dans le marché du travail. Par rapport au PIB par habitant, le nouvel indice de bien-être indique une faible tendance vers la convergence. Partout en Europe, le bien-être des travailleurs était varié. Il est évident que la croissance économique était liée à l'augmentation des échanges internationaux, alors que le bien-être des travailleurs dépendait plus du taux de syndicalisation ou des politiques d'un gouvernement central puissant.
This paper asks whether the trend toward convergence in late nineteenth century Europe depends on the welfare measure used. We construct a Worker Development Index (WDI) composed of Williamson’s real wage estimates, and new series of work hours and labor market regulations. Compared to GDP/person, the WDI shows a weaker tendency to converge. Across Europe, workers’ experiences in the so-called "glory days" varied. Although increased trade led to higher levels of output, workers’ welfare depended to a greater extent on union representation or a strong central authority.
Mots Clés : Mondialisation, convergence, heures de travail, bien-être des travailleurs
1
Introduction
The claim that globalization in the late nineteenth century, the precursor of the contemporary global world, led to widespread improvements in economic and social well-being has become something of a stylized fact. Forbes magazine observed unabashedly that 1860 to 1913 "were the glory days of the global hand. Goods, labor and capital flow[ed] freely between nations, and the standard of living r[ose] across much of the world."1 The specialist literature makes the stronger claim that increased trade and the movement of capital, labor and technology led to the convergence of productivity (GDP/person and GDP/hour worked) across developing and developed economies.2 Recently, Williamson and his collaborators have extended this analysis in their studies of the effect of trade and other factors, such as migration, on real wage convergence.3 They have begun as well to explore the impact of globalization on trends in income equality. Not withstanding their results, in opting for real wages as a measure of welfare this line of research raises some fundamental questions with both weak and strong claims concerning trends and convergence in productivity and standards of living before WWI: What measure best captures the impact of the global hand on social and economic welfare? Is the tendency toward convergence conditional on the choice of welfare measure? And what is the impact of trade on alternate measures of welfare? This paper attempts to address these points.
Most studies of income convergence for the period before 1913 rely heavily on Angus Maddison’s estimates of GDP/person and GDP/hour worked.4 There are two reasons to be suspicious of these estimates. First, there are a number of weaknesses in Maddison’s work hour figures. Second, it is widely recognized that GDP/person is an imperfect indicator of welfare in periods of institutional flux, such as the late nineteenth century which saw important changes in workers’ entitlements and legislated work conditions. For these reasons, economic historians have turned to other measures. Williamson, in attempting to control for varying work hours, has constructed annual series of real wages for a standard unit of time. Crafts has exploited the United Nations Human Development Index (HDI) to measure changes in welfare over time.5
1
April 21, 1997.
2 Among others, see Barro and Sala-i-Martin, Economic Growth. 3
Williamson, "Evolution"; "Globalization"; Hatton and Williamson, Age of Migration; O’Rourke, Taylor and Williamson, "Factor Price Convergence"; and Taylor and Williamson, "Convergence and Mass Migration."
4
Maddison, Economic Growth; Phases; "Growth and Slowdown"; and Monitoring. 5
2
HDI is a composite index constructed from measures of longevity of life, education and income. In making the case for using HDI, Crafts wrote: "It is the lives that people lead that are taken to be of intrinsic importance rather than the incomes that they enjoy."6
This paper follows Crafts’ approach and constructs a composite index of worker welfare, the Worker Development Index (WDI), for a selected group of European countries. The index combines Williamson’s real wage series and two new data series, one on the changing pattern of work hours between 1870 and 1900, and the other on the rate of introduction of labor market regulations and social insurance between 1830 and 1913. We examine the relationship between WDI, GDP/person, real wages and HDI to shed light on the impact of changes in broad macroeconomic variables, including the degree of openness and political and social changes, on welfare. We find that workers, firms and governments made trade-offs among wages, working hours and conditions, and entitlements to unemployment and health insurance. Although increased trade made have led to converging trends in factor prices, there were countervailing changes in other work arrangements. As a result, workers of all nations did not share equally in the so-called glory days of the international economy. We also find that while lowering tariffs had a positive impact on GDP, it was less important in determining worker welfare.
This paper is organized in four sections. In the first section, we bring to light some problems with Maddison's hour worked series. Section 2 develops new estimates of hours worked in Europe between 1870 and 1900. Unlike Maddison's estimates, our series show that work hours were not uniform across countries and sectors. We use this new data to construct leisure adjusted estimates of worker welfare. Section 3 extends the analysis to the conditions of work and the treatment workers could expect if they fell injured, sick or had to retire. Following Crafts, Section 4 combines the evidence on work hours and labor market regulation, along with real wages, in a WDI. We then evaluate the link between trade and WDI.
Maddison’s estimates of GDP and work hours
Maddison's estimates of real GDP and hours worked are generally taken as the starting point in the study of international levels of incomes. Although Maddison and others have revised his original figures for GDP, the work-hour
6
3
estimates have received less attention. For the period before 1913 Maddison wrote:
Because of the uncertainty surrounding these [hours of work] rather arbitrary figures, we have assumed that the movement [our emphasis] in working hours from 1870 to 1913 was the same in all our countries [Western Europe and North America]. This is probably a reasonable assumption.7
Further, because Maddison had better estimates for the UK than other countries, he assumed that all countries had the same work hours per week as Britain until 1913 (even Canada and the US).8
There are good grounds to be suspicious of Maddison’s underlying assumptions. The actual work hours for Britain used by Maddison are not consistent with the estimates of 56 work hours per week in 1873 and 46.6 hours in 1913 reported by R.C.O. Matthews and his collaborators.9 Nor can it be assumed that the pattern of hour changes was identical across countries, even those going through similar stages of industrialization. While the decline of work hours in the UK had a lot to do with rising income levels, trade unions and social reformers affected significantly the timing of the decline. Consequently, it is difficult to extrapolate from the UK case as Maddison has done.
How did Maddison’s assumptions about work hours affect his findings of overall convergence of GDP/hour worked? Williamson, recognizing the weaknesses of the Maddison’s hour data, sought to construct a series of real wages for comparable periods of work time.10 Assuming that distortions in the labor market did not affect the relation between wages and productivity, how well Maddison’s GDP/hour series tracks Williamson’s wage series provides some measure of the former’s reliability.11 Figure 1 traces the coefficient of
7 Maddison, Economic Growth, p. 225. 8
Maddison’s numbers are reproduced in Table 3. The observed variation in annual hours is due to different assumptions Maddison made about the number of weeks worked per year. See footnote 19 below.
9
Matthews, Feinstein, Odling-Smee, British Growth. 10
Williamson, "Evolution", was not completely successful in controlling for work hours. Of the European wage observations in the Williamson data for the period between 1850 and 1914, nine percent reflect earnings per hour, 23 percent daily earnings, 16 percent weekly earnings and 11 percent monthly or annual earnings; 40 percent of all observations are unspecified.
11 Hatton and Williamson, Age of Migration, noted some factors that explain differences in the rates of convergence of real wages and GDP/person. The trends in the two variables should be the same, however.
4
variation of Maddison’s GDP/hour series for 12 European countries (Austria, Belgium, Denmark, Finland, France, Germany, Great Britain, Italy, Netherlands, Norway, Sweden, Switzerland, and Williamson’s real wages series for 12 countries (excluding Austria, Finland and Switzerland; including Ireland, Portugal and Spain).12 Maddison’s series shows little change between 1870 and 1895, but for the entire period, 1870 to 1913, the dispersion in productivity narrowed by about 40 percent. Williamson found gradual convergence in real wages until 1905 or so, after which convergence either stopped or even reversed itself in Europe. Indeed, Williamson appears to be less than enthusiastic about labor market integration within Europe than between New and Old World. In short, the differences between the conventional measures of productivity and real wages suggest that Maddison’s underlying hours series needs to be improved upon before we can draw any conclusions about growth rates and standards of living in the glory days.
12
In calculating c.v.’s for Figure 1 we use estimates of GDP/hour as found in Maddison’s baseline work, Economic Growth.
5
Trends in hours worked in Europe, 1870-1899: some new
evidence
Data collected by the US Department of Labor, under the supervision of Carroll Wright, provide a comparative picture of work hours in North America and Europe for the late nineteenth century.13 The Department consulted over 714 sources on non-agricultural work hours, mainly published and unpublished government accounts. The virtue of the report is that it combines both manufacturing and non-manufacturing sectors, and, in this regard, is more reliable than series that rely on observations on a small sample of businesses, usually textile mills or mines, only. The report distinguished as well between women’s and men’s work hours.
Here we use all data gathered for European countries between 1870 and 1899. Table 1 gives the relevant descriptive statistics. Of the 4,902 observations collected, about 55 percent are from the UK; 14 percent from Germany; 13 percent from France. The survey’s breakdown by sector is roughly similar across countries (services account for between five to eight percent and textile and manufacturing about 45-50 percent); as a result the resulting average and annual work hours series are left uncorrected.14 No doubt the small sample sizes for certain countries, like Denmark, make it hazardous to ascertain annual movements, and in constructing the annual series in Table 2 some smoothing procedure was required.15 We opted to use a five-year moving average, although the following results do not vary greatly under different assumptions.
Independent estimates of work hours provide a check on the reliability of our source and procedures. Average hours in the UK calculated from the report correspond to Matthews and his collaborators’ average for 1873-1913; the trends in German and French hours we report in Table 2 are similar to those found in other studies.16 There are differences between the estimates based on
13 Fifteenth Annual Report. Carter, Ransom, and Sutch, "Historical Labor," provide background material on the collection.
14
Iron and steel includes engineering; the service sector is composed of clerks, bookkeepers and transport workers.
15
Because of the differing proportions of male and female workers in the sample and because male workers hours were not everywhere greater than women’s, Table 2 is based on male workers only.
16
Hoffmann, Das Wachstum; Marchand and Thélot, Deux siècles; Villa, Analyse macroéconomique.
6
the report and data available for Denmark, Belgium and Italy, but these latter series rely heavily on observations for single business enterprises.17
Tables 1 and Tables 2 do not sit well with Maddison’s assertions about work hours. The level of and changes in British hours were distinctly different from that found in Europe. The work week was 20 percent shorter in the UK than in Belgium in 1870, a country whose GDP/person was second to the UK’s.18 These findings hold across all sectors. Within Europe there was also great variability. Germany saw the greatest decline in work hours; some countries like France showed no significant change; still others like Italy experienced first a rise and then a decline in work hours.
Some comment ought to be made about the long work hours and the increase or stability in hours in several countries given the rise in levels of income. Table 3 presents annual work hours (per worker and per person) for 1870 and 1899 based on our sample and estimates for 1870 and 1913 from Maddison. The figures of annual work hours for our first two benchmarks (H&L) are calculated on the assumption that the numbers of weeks worked for each country in the period was constant.19 The new estimates reveal extremely long work hours in Belgium, Germany and Switzerland in 1870, and in Spain in 1899, but these totals correspond to the figure of 3,366 to 3,538 work hours calculated by Voth for London in 1800.20 Why would employers in newly developing countries stick with such long work hours? One strand in the literature suggests that employers were not aware of the impact on health of very long hours; others have observed that employers actually believed along with Nassau Senior that profits are earned in the last hour of work.21
17 Christensen, Lønudviklingen inden; Scholliers, Wages Manufacturers; Federico, L'Industria mondiale.
18
As a comparison, Rosenbloom, "One Market," found only a two to three percent difference in work hours in midwestern and eastern cities in the US in the 1890s.
19
The estimates are averages from Maddison, Economic Growth, who assumed in his calculations of annual hours that the number of weeks worked per year declined in the period. Our reading of the literature suggested that changes in the number of work weeks (mainly the introduction of holidays) was generally postponed until after WWI (Cross, Quest for Time). In the period before 1913, workers, unions and social reformers focused their demands on the length of the workday and not the number of workweeks. We assume: Belgium 47.73 weeks of work per year; Denmark 47.42; France 47.42; Germany 47.51; Great Britain 47.89; Italy 46.50; Netherlands 47.73; Spain 46.50; Switzerland 48.06.
20 Voth, "Time and Work." Atack and Bateman, "How Long was the Workday," reported a similar result for the US in 1880.
21
7
The data series suggest an alternative explanation based on the observation that the trend in work hours for most countries had an inverse U shape.22 In the UK work hours and the work week were shorter before industrialization than during the first generation of factory work. For the textile sector, M.A. Bienefeld set the working week at 69 hours at the turn of the nineteenth century, rising to 72 by 1830, before beginning the long and gradual descent to 54 hours by 1914.23 The reasons for the initial increase in the UK as elsewhere are complex. Rising capital labor ratios provided employers with an incentive to work longer hours. As well, the lack of a long-term commitment between employer and employees may have led firms to set the length of the working day at a higher level than was consistent with the long-run health and productivity of workers. As worker attachment to their rural roots loosened and as employers faced increased costs from high labor turnover, the two parties could begin thinking about long-term interests and began reducing the length of the working day in a way consistent with these interests. As for the rate in decline in hours, this varied across countries depending upon the relative strength of unions, social reformers and employers’ associations. We will return to this issue in a later section.
The inverse U shaped pattern implies that countries do catch-up or, better, level-off and this explains the evidence of convergence found in Table 3. Among our sample of countries, the coefficient of variation of hours per worker and per person narrowed from 1870 to 1899. Still, the spread (maximum-minimum) in work hours in the 1870s (Belgium - UK) and 1899 (Spain - UK) actually widened.
As reported, the divergence in work hours between countries is an underestimate of workers’ welfare because it does not include gains to workers owing to increased leisure time. Fewer hours worked by the employed implies greater leisure, which presumably adds to workers’ utility. This is not true for the unemployed or for those working fewer hours than they would like to. Still, standard neo-classical analysis suggests that adults in countries with fewer hours worked will be better off relative to those in countries with more hours worked at the same level of GDP/person. This implies that units like the UK were better off than income estimates that do not control for different
22 The pattern is found in Phelps Brown and Browne, "Hours of Work." The number of weeks worked exhibited a similar inverse U pattern. Woodward, "Means of Payment", and de Vries, "Employer’s Guide," estimated 43 work weeks per year in seventeenth century England and the Netherlands. Clark and van der Werf, "Work in Progress," challenged the view that work hours increased during or before the industrial revolution.
23
8
work hours have suggested. Moreover, as UK work hours fell relatively, leisure-augmented GDP would have diverged across Europe.
We pursue this logic and reevaluate GDP/person to take into account differences in hours worked across countries. Following Beckerman, the adjustment is based on changes in work hours from the base period (1870) to 1899.24 For Belgium Table 3 reports GDP/person of $3579 in 1899 and a decrease of 94.92 work hours per person between 1870 and 1899. Assume, following Crafts, that labor’s share of income was 70 percent; the gain in leisure is 0.7 x 2.72 per hour (the average GDP/hour worked in 1899) x 94.92 = $180. Thus the leisure-augmented GDP/person is = $3759 (last column Table 3).
The differences between GDP/person and GDP/leisure make clear the importance of work hours in measuring worker welfare. For Switzerland in 1899, leisure-augmented GDP is 10.8 percent higher than GDP/person; for France, GDP is actually higher by 4.2%; while for Belgium the two measures are about the same. As a result, country rankings vary with the welfare measure chosen. The dispersion of workers’ experiences also widens. All measures of dispersion (bottom panel Table 3) for GDP/leisure are greater than those for GDP/person.25
Labor market regulation and social insurance
The number of hours spent at work and the wages received in exchange for this time are two important determinants of worker welfare. A third is the conditions workers face while at work and the income they can expect when unable to sell their labor time due to unemployment, illness or old age. Between 1850 and 1913, work and time spent out of work came to be regulated by labor market legislation such as Factory Acts, and by the enactment of social insurance entitlements against unemployment, illness and old age.26 There are no direct measures that would permit comparisons of working conditions and social insurance payments across time and between countries prior to 1913. Instead, in this section we aim to construct a Labor
24
The calculations in this paragraph are based on Beckerman, "Comparative Growth"; and Crafts, "Human Development Index." We assume that the quality of leisure time consumed was constant (that is, no technical or organizational change).
25
Bell and Freeman, "Amercians and Germans," found similar results using different techniques for the period after 1945.
26
For an extended discussion of this transition and the role of social protection, see Rimlinger, Welfare Policy.
9
Market Regulation Index using data collected from government documents and contemporary surveys that recorded the spread of regulations and social insurance entitlements. We use this index as a proxy for the actual conditions of work and social insurance payments.27 While it is reasonable to assume that working conditions were better in countries with well-developed labor market regulations and that social insurance payments were higher were entitlements were defined, some caution is needed. Contemporary British policy makers often observed that while on paper continental nations tended to regulate the labor of children and women more closely, enforcement of regulations was in practice more thorough in the UK than on the Continent. No attempt will be made to correct for this type of error, although it warrants further research.
Our Labor Market Regulation Index for 17 European countries between 1830 and 1913 exploits the same methodology underlying the United Nation’s Human Development Index (HDI).28 The Index itself is a composite of 11 equally weighted labor market regulations and social insurance entitlements. For each component minimums and maximums were defined with the minimum representing the state of labor markets around 1830 and the maximum conditions in 1913:
27
Sources consulted: Factory acts, hours of labor for young workers and women, age of admission to factory work, age at which night work permitted, night work for women - Brooke, Factory Law; Fraser, Evolution of Welfare; IALL, Report of the Fourth General Meeting; and UK, Parliamentary Papers, vol. LXXIII, 1905, p. 81. Workers’ compensation - Ambrosius and Hubbard, Social and Economic History; Bellom, "État actuel;" Congrès International Rapports; Droz, "État de la question;" Villard, Workmen's Accident Compensation; US Commissioner of Labor, "Workmen's Insurance;" and US Department of Labor, "Workmen's Compensation." Factory inspection - IALL, First Comparative Report; ILO, Factory Inspection; and ILO, Organisation of Labour. Old age pensions, sickness insurance, unemployment insurance -Ambrosius and Hubbard, Social and Economic History; Association Internationale, "State Unemployment Insurance;" Blaustein and Craig, International Review; Fraser, Evolution; and Rimlinger, Welfare Policy.
28
10
MINIMUMS MAXIMUMS
Labor market regulations
(For discrete regulations, 1 signifies regulation in place; 0 not in place)
1) Minimum age children allowed 8 14
to work in manufacturing establishments
2) Maximum length of working day 14 6
of young workers
3) Age at which night work allowed 8 18
4) Women excluded from night work 0 1
5) Length of working day for women 14 10
6) Factory Act adopted 0 1
7) Factory inspection in place 0 1
Social insurance settlements
1) Workers Compensation Insurance 0 1
2) Unemployment Insurance 0 1
3) Sickness Insurance 0 1
4) Old Age Insurance 0 1
We then calculated an index measuring in percentage terms the progress each country had made between the minimum and the maximum. To illustrate, in 1837 the Swiss established 16 as the minimum age for children to work at night. Using the minimum and maximum values we established, the Swiss earned a score of (16-8)/(18-8) = 0.8 for this component in 1840. The Labor Market Regulation Index is the average (equally weighted) of the 11 components and measures the overall progress each country had made in introducing different regulations and social insurance entitlements.
The choice of minimum and maximum standards merits some elaboration. The minimums represent working conditions and entitlements around 1830 before the enactment of state policy, while the maximums reflect conditions found in 1913 under the most progressive legislation or alternatively those set by the 1890 Berlin Conference on Labour in Factories and Mines.29 Admittedly the choice of endpoints is arbitrary (thus an argument could be made that the minimum age of child workers was actually below eight years). Having said that, this approach meets our objective in establishing the distance countries had traveled from an unregulated to regulated world. For all of the
29
11
social insurance entitlements, and a number of the labor market regulations, minimums took the value of zero in the absence of state policy; maximums were assigned the value of one where policy had been enacted. No attempt was made to give precise monetary values to any of the social insurance entitlements. Where states introduced partial and/or voluntary plans for sick, unemployment and pension benefits, and worker compensation as a precursor to more comprehensive entitlements, a value of 0.5 was assigned.30
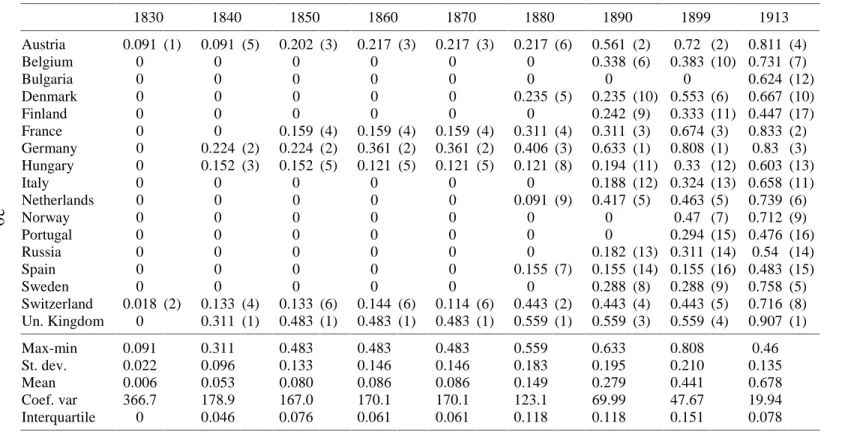
The indices found in Table 4 show that for the period 1830 to 1913 countries moved to regulate labor markets and to define social insurance entitlements at different times and to different degrees. In 1830 only two countries, Switzerland and Austria, had any type of regulation in place. By 1850 they were joined by France, Germany, Hungary and the UK. Thereafter, the UK took the leadership; it had a factory inspectorate, and laws that restricted child labor and established a maximum 11 hour work day for women. The period from 1850 to 1870 saw little change in terms of the number of countries regulating their labor markets and the extent of regulation in each country. The next wave of regulation was initiated by the Swiss during the 1870s; by 1880 it was second only to the UK in its willingness to regulate labor. The mantle of change quickly passed to Germany which introduced in the 1880s and 1890s new laws to regulate labor and new types of social insurance entitlements. Germany increased employers’ liabilities for accident victims in 1871, introduced a sickness insurance scheme in 1883, created a state administered workers compensation scheme in 1884, and introduced old age pensions in 1889. By 1890, Germany had the distinction of having the most comprehensive list of labor market regulations and social insurance entitlements. The UK did not match these improvements and by 1899 ranked only fourth, after having led other European countries in the introduction of regulations for much of the century.
The index illustrates the role of politics in shaping labor market institutions.31 Consider the British and German models. Inspired by liberalism, the UK was anxious to provide a framework for stable labor markets, but was reluctant to
30
A number of countries increased employer liabilities in the case of accidents before introducing state administered worker compensation schemes. These intermediate plans were valued at 0.5.
31
According to Léon-Eli Troclet, "Législation sociale," nineteenth century European states fell into one of three distinct categories: The first comprised countries where liberalism had taken hold, such as Britain and to some degree France; the second group was composed of authoritarian regimes, Germany and Switzerland, with some elected representation; the third group consisted of countries like Spain and Italy with little or no representation.
12
restrict the right of individuals to enter into contracts. At an early date, individuals were given new rights to protect themselves through collective bargaining; those deemed unable to defend their self-interest, including women and children, were offered special protections.32 But the adult male worker was expected to fend for himself and to make his own provision for unemployment, old age and accident insurance. The UK moved earlier than almost any other European nation to regulate the employment of women and children. Still, during the 1870s and 1880s British officials quickly rejected the Swiss proposal to limit the working day of workers across Europe. Indeed, facing growing foreign competition, coalitions of male (skilled and semi-skilled) workers and employers advocated loosening employment regulations. In the textile industry, for example, male spinners and employers lobbied to prevent age restrictions for young workers.33 The UK was also slow to adopt the advances in social insurance pioneered elsewhere in part because they viewed this as an infringement of the rights of adult males to contract. As long as the British working class accepted these compromises, British policy makers resisted following the leads of Continental nations after 1870. That said, the spread of collective bargaining and of Labor politics towards the end of the century, and the resulting changes in the nature of class relations, forced the state to find means to protect both skilled and unskilled. In 1897 the replacement of accident compensation by a compulsory insurance scheme marked the first meaningful regulation that infringed on the rights of male adults to make their own deals with their employers. Benefits for the old were accorded in 1908 with the provision of state pensions for the general population; the unemployed were offered relief in 1911.
In Germany the battle between democracy and the absolutist monarchy had yet to be resolved by 1913 and the state pursued its role as regulator.34 The nature of German protective legislation was shaped by the challenges of the conservative land-owning class who opposed the spread of modern industrial society, and the demands of the most powerful socialist party in Europe which sought state protection from the evils associated with industrial society. In order to consolidate the power of the state, Bismarck used labor market regulations and social insurance as a means to undermine the right and the left. As a result, the evolution of labor market regulations and social insurance entitlements in Germany was almost the mirror image of that found in the UK.
32
For a discussion, see Low, "Short History"; and Ogus, "Great Britain." 33 Winstanley, "Factory Workforce," p. 134.
34
This paragraph is based on Canning Languages of Labor; Machlan, "Workers’ Insurance;" Rimlinger, Welfare Policy; and Zollner, "Germany."
13
Bismarck focused on social insurance schemes because they were seen as the most effective way to build and maintain the loyalty of the working class to the monarchy. Health insurance was introduced in 1883, accident insurance in 1884 and old age pensions in 1889; these measures were in place before similar programs were available in the UK. Factory legislation to regulate labor markets and the promotion of trade unions to facilitate working class self-help played less of a role in Germany. Bismarck believed that these changes would hamper the competitive position of German industry and, if applied only to women, would harm their opportunities in the labor market. The German state would only move towards labor market regulations in the last decade of the century as labor strife and socialist agitation continued to challenge the existing government. In 1890 Wilhelm II, prompted by a major strike in the coal mining regions the previous year, announced the "new course" which included comprehensive labor market regulations on the British model, a half century after they became the norm in the UK.
In many respects the UK and Germany had converged by WWI, both adopting a wide range of labor market regulations and social insurance. But for most of the century they were on very different paths and the timing and their commitment to these policies reflected differences in political forces as much as common economic factors. For all of Europe, our measures of convergence (bottom panel of Table 4) suggest that some uniformity in regulatory environment is observed only at the end of the period. Between 1830 and 1900 the gap between the most and least regulated nation grew and the interquartile spread increased as well. The coefficient of variation only began falling towards the end of the century.
A worker development index
In the preceding sections we developed new measures of work hours and labor market regulation. We now combine this information, along with Williamson’s real wage series (UK = 100 in 1905), into a composite index. Using the same methodology as above, we define minimums and maximums for the three components:
MINIMUM MAXIMUM
Wages 26 110
Hours of work 3500 2500
14
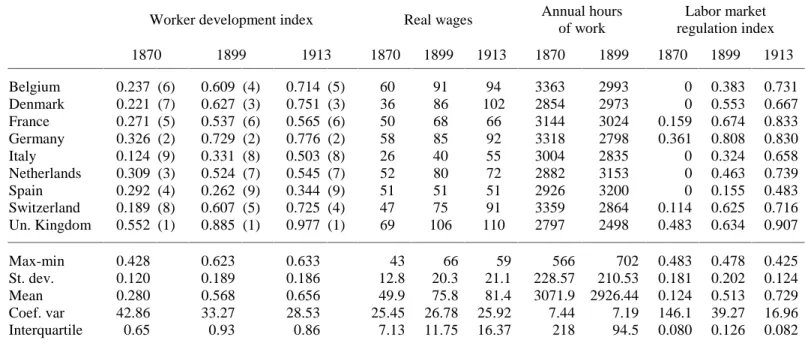
The resulting series (the first three columns of Table 5), in which real wages carry a weight of 50 percent, work hours 25 percent and labor regulation 25 percent, gives us a single, comprehensive measure of the quality of life of European workers from 1870 to 1913.35
We cannot be certain there was convergence in workers’ welfare across Europe in the period. With mobile capital, technology and workers – about 50 percent of European migrants in the period actually staid in Europe – one would have expected some equalization of the returns to labor across the continent.36 Consider the case of Italian workers who moved to France because of attractive wages. As a result, either wages or benefits would have increased in Italy, and/or work hours declined. There is evidence in Table 5 that adjustments of this sort were taking place at all margins. In 1899 a Belgian worker could expect to receive comparatively high wages, but long work hours and little in the way of labor regulation. A Danish worker could expect to receive slightly lower wages than the Belgians, but work shorter hours in a slightly better labor market environment. A German worker would receive as well lower wages than his Belgian neighbor, but work about 200 hours less each year in the most highly regulated environment. Despite these trade-offs, based on the measures of dispersion reported in Table 5, it is not evident that a level playing field in labor costs was obtained by 1913. Although the coefficient of variation of the WDI declines over the period, the gap between the best and least well-off workers increased, and the spread actually widens considerably from 1870 to 1899. Spain's WDI actually fell between 1870 and 1899 and by 1913 it was barely higher than it had been in 1870. Belgium, Denmark and Switzerland enjoyed substantial increases, while gains in France and the Netherlands were more modest.
Contemporary attitudes toward a legislated level playing field mesh with the finding that compensating adjustments of wages, hours and entitlements did not necessarily lead to equal returns to labor.37 The movement for a standardized regulatory environment was first led by Switzerland, a small open economy whose employers beginning in the 1870s showed concern that demands for increased benefits and regulation would reduce its competitiveness. Yet it was not until 1890 when the leading European nations
35
We have experimented with other weights, but the results did not differ greatly. Note that for 1870 and 1899 we employ our new estimates of hours per worker per week. Our data do not extend to 1913 and we assume that the hours worked in 1913 were the same as hours in 1899. 36
On internal migration in Europe, see Rosoli, "Italian Migration." 37
15
met in Berlin to craft a set of labor standards.38 The Germans because of their tradition of state regulation and their plan to modify their own labor code were sympathetic to the Swiss position enunciated two decades earlier. But other economies desired to protect their distinct cost advantages. The UK sent delegates to Berlin reluctantly and with clear instructions not to accept projects that went beyond the limits established by existing British legislation; the French supported British positions, albeit in some cases only reluctantly. Belgium, along with Portugal and the Netherlands, opposed much of what was proposed. It is not surprising that the effort in Berlin failed.39 Not only was there disagreement between rich and poor countries but among the developed countries themselves - a conflict that represented the different combinations of wages, work hours, work conditions and entitlements European workers could expect to receive.
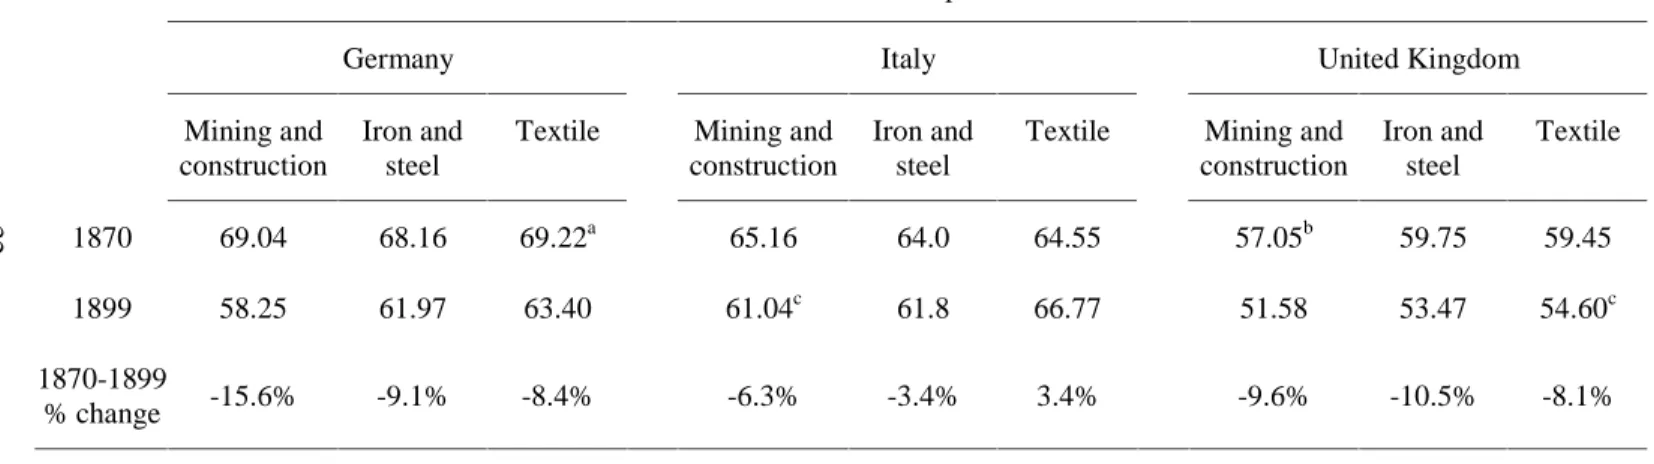
The dispersion of WDI across countries is but part of the story. Within countries there were wide differences in workers’ welfare. First, there were differences in women’s experiences. In six of nine countries, women tended to work longer hours then men. Second, owing to global trade forces, workers’ welfare varied by sector. For Germany, the UK and Italy, Table 6 gives average work hours in 1870 and 1899 in three sectors: mining and construction which can be taken to represent the non-tradable sector; textiles (mainly cotton and woolen), representing tradable goods produced by semi-skilled workers; and iron and steel (including engineering) which can be identified with the output of skilled workers. Whereas the decline in work hours in the non-tradable sector in Germany and UK was in line with the overall reduction in work hours in the two countries, in the semi-skilled sector firms were more reluctant to reduce hours by the same proportion because of stiffer international competition. Italian textile firms actually increased their work hours over the period. In skilled trades, where the UK and Germany had a distinct advantage, average hours declined to a greater extent than in the tradable semi-skilled sector.40
Globalization was not the only factor that impacted on workers’ welfare. There are also political and social factors to consider. The northern European
38
This paragraph is based on Follows, International Labour Organization; and Delevigne, "History of Labor Legislation."
39
Nonetheless, Berlin was the first step towards the birth of the International Association for Labour Legislation in 1901, the forerunner of the post WWI International Labour Organization. See Shotwell, Origins; and Johnston, ILO.
40
These findings are consistent with the view held by Wood, "How Trade Hurt," for the period after 1945.
16
countries were more egalitarian than many of their neighbors.41 Returning to Table 1, the spread (maximum - minimum) between low and high work-hour sectors, was 2.7 hours in Denmark and 5.32 in the Netherlands; in contrast it was 7.81 hours in France; and 9.0 in the UK, about the same as could be found in Spain.
The Danish case, because it highlights the potentially countervailing or reinforcing roles of macroeconomic policy and social and economic factors in determining workers’ standard of living, merits further consideration. In terms of WDI, it moved from seventh place in 1870 to third in 1899 and 1913. Denmark remained committed to free-trade in wheat and this is revealed in the change in factor prices; real wages nearly tripled between 1870 and 1900. But at the same time, owing to its unique political makeup, the country was among the first to introduce factory inspection and sickness insurance.42 Like Germany, its government was not responsible to the national assembly. However, it had a strong trade union movement and it was the first country to develop a bipartite national institutional structure of industrial relations. For the entire sample, Table 7 examines the correlation in 1899 between macroeconomic variables (open market forces, government finances and political and union structure), and measures of welfare (WDI, HDI and GDP/person.)43 TARIFF is the rate of protection of wheat imports; GOVT is expenditures on health, unemployment insurance and housing and is a measure of resource redistribution; VOTE is the percentage of the male population eligible to vote; and UNION refers to the percentage of union members in the labor force.
WDI is more closely related to GDP/person than HDI which makes sense given the weight of economic factors, wages and work hours, in WDI. The determinants of WDI and GDP/person vary, however. While GDP is negatively related to tariffs as expected, the relation between openness and WDI is very weak. WDI is highly correlated with union membership and, to a lesser extent, government expenditures. Neither UNION nor VOTE nor GOVT is strongly correlated with GDP/person. Thus, while GDP increased in the glory days, workers everywhere were not necessarily better off because of open market polices. There were internal questions concerning the
41 Lindert’s ("Comparative History of Income," p. 220) estimates of wealth confirm this tendency. 42
Crouch, Industrial Relations, pp. 95-124. 43
All values are for 1899 or 1900 except HDI and UNION which are for 1913. GDP/person is from Maddison, Monitoring; HDI from Crafts, "Human Development," pp. 310-11; TARIFF is from Bairoch, "Trade Policy," p. 76; VOTE and UNION are from Crouch, Industrial Relations, pp. 98, 108-111; GOVT is from Lindert, "Social Spending," p. 10.
17
distribution of these gains. Workers depended on the support of unions or a central authority to get their share.
We estimated a number of basic regressions (OLS) to confirm these tendencies (t-statistics in parentheses). Because of the small number of observations, we limited the regressions to two independent variables.
(1) WDI = 0.434 - 0.002TARIFF + 0.032UNION
(-1.239) (4.011)
R2 = 0.82 F = 13.48 (p = 0.01).
A five percent increase in union membership would have added about 0.150 units to a country’s WDI, enough for France to have jumped from being sixth to third in the rankings in 1899. The impact of the tariff is negligible, if non existent.
(2) WDI = 0.485 - 0.002TARIFF + 0.242GOVT
(-0.840) (1.813)
R2 = 0.7 F = 3.92 (p = 0.08).
Although regression (2) performs less well than (1), a small change in government social spending contributes quite a lot to a country's WDI ranking. A one percent increase in the Netherlands would have moved it from seventh to second place in WDI rankings in 1899.
(3) GDP/person = 3509 - 30.35TARIFF + 238.39GOVT
(-2.222) (0.386)
R2 = 0.58 F = 4.19 (p = 0.07).
This result is consistent with Williamson's claims that those economies which remained open tended to grow faster and converge to the leader. Governments did not contribute much to growth.44
44
With HDI as the dependent variable, only VOTE is significant: HDI = 0.420 + 0.003VOTE
(2.212)
18
We draw the following conclusions, albeit tentative given our sample size and the restricted time period examined, about the dispersion of WDI between countries and the determinants of WDI. The evidence is mixed whether or not WDI converged over the period. The weak trend toward convergence, or lack of, was the result of differences in political and institutional arrangements - the legacy of history - among countries. Workers seem to have done better where unions put pressure on governments to redistribute income. Workers’ welfare was not necessarily related to open market polices. Indeed, as customs earnings were an important source of government receipts in the period, the tariff can be interpreted as a key policy tool in making workers better off.
Conclusion: Labor markets during the glory days
This paper has sought to widen our understanding about the standard of living in late nineteenth century Europe. Combining information about wages, work hours, work conditions, labor market regulations and social entitlements, the WDI reveals a weak trend in the convergence of worker welfare across nations. While increased economic trade in the period may have created competitive tensions between nations and stimulated factor price effects within nations, these forces did not lead automatically to an integrated international labor market. Owing to different labor market histories and national social and political pressures, countries had developed different means to distribute the dividends of increased trade. As a result, countries had different work hours; national authorities differed as well in their health and safety records; still others had different child labor laws and regulations concerning pensions and unemployment. The failed attempt at Berlin in 1890 to harmonize labor legislation revealed the extent of divergence in these areas in late nineteenth century Europe. Indeed, the fact that Berlin happened at the end of the period, not the beginning, suggests that if anything the gap between nations had grown over the century rather than converged.
The research and conclusions reported here suggest some further avenues of investigation. First, we need to extend our knowledge of work hours both for the period before 1870 and after 1900. Second, we need to be wary of GDP/hour estimates that assume that work hours were constant across countries in the nineteenth century. Third, to more fully evaluate how well economic agents were really doing, we need to situate measures of welfare, such as GDP/person and the HDI, in their appropriate legal and social context. Finally, and more generally, convergence studies must look beyond factor price ratios, and trends in income and productivity. We need to consider as
19
well the institutional environment. We need to better understand why globalization does not lead inevitably to convergence in labor institutions and work arrangements for nineteenth century Europe – as well as the contemporary world.45
45
On the integration of labor market institutions in the contemporary period, see Jacoby, ed., Workers of Nations.
20
References
Alcock, Antony E. History of the ILO. New York: Octagon Books, 1971. ˝
Ambrosius, Gerold and William H. Hubbard. A Social and Economic History of 20th Century Europe. Cambridge: Harvard University Press, 1989. Association internationale pour la lutte contre le chômage. "State
Unemployment Insurance in Various Countries." Reports to the Première Assemblée Générale, 1913.
Atack, Jeremy and Fred Bateman. "The Effect of Long Hours of Work on Productivity." In Hours of Workand Means of Payment: The Evolution of Conventions in Pre-Industriel Europe, edited by Carol S. Leonard and B.N. Mironov. Proceedings of the Eleventh International Economic History Congress, Milan, 1994.
Atack, Jeremy and Fred Bateman. "How Long Was the Workday in 1880? Journal of Economic History 52, no. 1 (1992): 129-60.
Baircoch, Paul. "European Trade Policy, 1815-1914." In Cambrige Economic History of Europe, Volume VIII: The Industrial Economies: The Development of Economic and Social Policies, edited by Peter Mathias and Sidney Pollard. Cambridge: Cambridge University Press, 1989. Barro, Robert J. and Xavier Sala-i-Martin. Economic Growth. New York:
McGraw Hill, 1995.
Beckerman, W. "Comparative Growth Rates of 'Measurable Economic Welfare': Some Experimental Calculations." In Economic Growth and Resources, vol. 2, edited by R.C.O. Matthews, 36-59. New York: St. Martin's Press, 1980.
Bell, Linda and Richard B. Freeman. "Why Do Americans and Germans Work Different Hours?" National Bureau of Economic Research, Working Paper no. 4808, 1994.
Bellom, Maurice. "État actuel de la question des accidents du travail dans les différents pays." Congrès International des Accidents du Travail, 1897, Rapports, Brussels, 1897.
Bienefeld, Manfred A. Working Hours in British Industry. London: Weidenfeld and Nicolson, 1972.
21
Blaustein, Saul J. and Isabel Craig. An International Review of Unemployment Insurance Schemes. Kalamazoo: Upjohn Institute, 1977.
Brooke, Emma. Factory Laws of European Countries. London, 1898.
Canning, Kathleen. Languages of Labor and Gender: Female Factory Work in Germany, 1850-1914. Ithaca: Cornell Univerity Press, 1996.
Carter, Susan B., Roger L. Ransom, and Richard Sutch. "The Historical Labor Statistics Project at the University of California." Historical Methods, 24, no. 2 (1991): 52-65.
Christensen, J.P. Lønudviklingen inden for dansk håndværk og industri 1870-1914. Copenhagen: Akademisk Forlag, 1975.
Crafts, N.F.R. "The Human Development Index and Changes in Standards of Living: Some Historical Comparisons." European Review of Economic History 1, no. 3 (1997): 299-322.
---. "Some Dimensions of the 'Quality of Life' During the British Industrial Revolution." Economic History Review 50, no. 4 (1997): 617-39.
Cross, Gary. A Quest for Time: The Reduction of Work in Britain and France, 1840-1940. Berkeley: University of California Press, 1989. Crouch, Colin. Industrial Relations and European State Traditions. Oxford:
Clarendon, 1993.
Delevingne, M. "The Pre-War History of International Labor Legislation," In The Origins of the International Labor Organization, vol. 1, edited by J.T. Shotwell. New York: Columbia University Press, 1934.
de Vries, Jan. "An Employer's Guide to Wages and Working Conditions in the Netherlands." In Hours of Workand Means of Payment: The Evolution of Conventions in Pre-Industriel Europe, edited by Carol S. Leonard and B.N. Mironov. Proceedings of the Eleventh International Economic History Congress, Milan, 1994.
Droz, Numa. "État de la question des accidents du travail." Congrès International des Accidents du Travail, Rapports, vol. 1. Paris, 1889. Ehrenberg, Ronald G. Labor Markets and Integrating National Economies.
Washington: Brookings Institution, 1994.
Federico, Giovani. L'Industria mondiale della seta dalla Restaurazione alla grande crisi. Venice: Marsilio, 1994.
22
Follows, J.W. Antecedents of the International Labour Organization. Oxford: Oxford University Press, 1951.
Fraser, Derek. The Evolution of the British Welfare State, 2ed. London: Macmillan, 1984.
Hatton, Timothy J. and Jeffrey G. Williamson. The Age of Migration: Causes and Economic Impact. New York: Oxford University Press, 1998. Hentschel, Volker. "German Economic and Social Policy, 1815-1939." In
Cambridge Economic History of Europe, vol. VIII, edited by Peter Mathias and Sidney Pollard. Cambridge: Cambridge University Press, 1989.
Hoffmann, Walter. Das Wachstum der deutschen Wirtschaft seit der Mitte des 19. Jahrhunderts. Berlin: Springer Verlag, 1965.
International Association for Labour Legislation (IALL). Report of the 4th General Meeting of the Committee of the IALL. Geneva, September 26-29, 1906. London, 1907.
---. First Comparative Report on the Administration of Labour Laws: Inspection in Europe. London, 1911.
International Labour Office (ILO). Factory Inspection: Historical Development and Present Organization in Certain Countries. Geneva: ILO, 1923.
---. The Organisation of Labour Inspection in Industrial and Commercial Undertakings. Geneva: ILO, 1939.
Jacoby, Sandford, editor. The Workers of Nations: Industrial Relations in a Global Economy. New York: Oxford University Press, 1995.
Johnston, George A. The ILO. London: Europa, 1970.
Lindert, Peter H. "Toward a Comparative History of Income and Wealth Inequality." In Income Distribution in Historical Perspective, edited by Y.S. Brenner, Harmut Kaelbe, and Mark Thomas. Cambridge: Cambridge University Press.
---. "The Rise of Social Spending." Explorations in Economic History 31, no. 1 (1994): 1-38.
Low, M. "A Short History of Labor Legislation in Great Britain." Bulletin of the Bureau of Labor, Washington, no. 70 (1907): 534-61.
23
Machlan, L. "Workers’ Insurance Versus Protection of the Workers: State Social Policy in Imperial Germany." In Social History of Occupational Health, edited by Paul Weindling. London: Croom Helm, 1985. Maddison, Angus. Economic Growth in the West. New York: Twentieth
Century Fund, 1964.
---. Phases of Capitalist Development. New York: Oxford University Press, 1982.
---. "Growth and Slowdown in Advanced Capitalist Economies." Journal of Economic Literature 25, no. 3 (1987): 649-98.
---. Monitoring the World Economy, 1820-1992. Paris: Organization for Economic Cooperation and Development, 1995.
Marchand, O. and C. Thélot. Deux siècles de travail en France. Paris: INSEE, 1991.
Matthews, R.C.O., C.H. Feinstein, and J.C. Odling-Smee. British Economic Growth, 1856-1973. Stanford: Stanford University Press, 1982. Ogus, Anthony I. "Great Britain." In The Evolution of Social Insurance
1881-1981, edited by Peter A. Kohler and Hans Zacher. London: St. Martin's Press, 1982.
O'Rourke, Kevin H., Alan Taylor, and Jeffrey G. Williamson. "Factor Price Convergence in the Late Nineteenth Century." International Economic Review 37 (1996): 499-530.
Phelps Brown, Ernest H. and Margaret H. Browne. "Hours of Work." In International Encyclopedia of the Social Sciences, vol. 8, 487-90. New York: Colliers.
Rimlinger, Gaston V. Welfare Policy and Industrialization in Europe, America and Russia. New York: Wiley, 1971.
Rolin-Jaequemyns, M.G. "La conférence de Berlin sur la législation du travail et le socialisme dans le droit international," Revue de droit international et de législation comparée 22 (1890): 3-27.
Rosenbloom, Joshua L. "One Market or Many? Labor Market Integration in the Late Nineteenth Century United States." Journal of Economic History 50, no. 1 (1990): 85-109.
Rosoli, Gianfausto. "Italian Migration to European Countries from Political Unification to WWI." In Labor Migration in the Atlantic Economies, edited by Derek Hoerder. Westport, Conn.: Greenwood Press, 1985.
24
Scholliers, Peter. Wages, Manufacturers and Workers in the Nineteenth Century Factory: The Voortman Cotton Mill in Ghent. Oxford: Berg, 1996.
Shotwell, James T., editor. Origins of the ILO, vol. 1. New York: Columbia University Press, 1934.
Taylor, Alan M. and Jeffrey G. Williamson. "Convergence in the Age of Mass Migration." European Review of Economic History 1, no.1 (1997): 27-63.
Troclet, Léon E. "Législation sociale internationale." Les Cahiers de l'Institut de Sociologie Solvay, Cahier #4 (1952) Bruxelles.
United Kingdom. Parliamentary Papers. International Conference on Labour, vol. LXXIII, 1905.
U.K. Commercial. "Further Correspondence Respecting the International Labour Conference at Berlin," C-6042, no. 16 (1890): 1-183.
United States. Department of Labor Fifteenth Annual Report of the Commissioner of Labor: Wages in Commercial Countries. Washington, 1900.
United States. "Workmen's Insurance and Compensation Systems in Europe." 24th Annual Report of the Commissioner of Labour, 1909. Washington, 1911.
United States."Workmen's Compensation Laws of the United States and Foreign Countries." Bulletin of the United States Bureau of Labor Statistics, Department of Labor, no. 126, Washington, 1914.
Villa, Pierre. Une analyse macroéconomique de la France au XXe siècle. Paris: CNRS, 1993.
Villard. H.G. Workmen's Accident Compensation and Insurance in Belgium, Norway, Sweden, Denmark and Italy. New York, 1913.
Voth, Hans-Joachim. "Time and Work in Eighteenth Century London." Journal of Economic History 58, no. 1 (1998): 29-58.
Williamson, Jeffrey G. "The Evolution of Global Labor Markets since 1830: Background Evidence and Hypotheses." Explorations in Economic History 32, no. 2 (1995): 141-196.
---. "Globalization, Convergence, and History." Journal of Economic History 56, no. 2 (1996): 277-306.
25
Winstanley, Michael. "The Factory Workforce." In The Lancashire Cotton Industry: A History since 1700, edited by Mary B. Rose. Preston: Lancashire County Books, 1996.
Wood, Adrian. "How Trade Hurt Unskilled Workers."Journal of Economic Literature 9, no. 1 (1995): 57-81.
Woodward, Donald. "The Means of Payment and Hours of Work in Early Modern England." In Hours of Workand Means of Payment: The Evolution of Conventions in Pre-Industriel Europe, edited by Carol S. Leonard and B.N. Mironov. Proceedings of the Eleventh International Economic History Congress, Milan, 1994.
Zollner, D. "Germany." In The Evolution of Social Insurance: 1881-1981, edited by Peter A. Kohler. and Habs Zacher. London: St. Martin’s Press, 1982.
0,2
0,25
0,3
0,35
0,4
1870
1875
1880
1885
1890
1895
1900
1905
1913
Williamson (real wages)
Maddison (GDP/hour)
Figure 1
CONVERGENCE IN EUROPE, 1870-1913:
MADDISON AND WILLIAMSON
Source: See text.
Table 1: Average hours of work per week, 1870-1899
(number of observation) [percentages]
Hours of work per week
All Men Women ConstructionMining and Iron and Steel Textile Manufacturing Service Belgium 67.64 (171) 67.31 (149) 69.09 (22) 65.73 (41) 68.07 (43) 70.54 (54) 63.04 (23) 68.60 (10) [87.1] [12.9] [24.0] [25.1] [31.6] [13.4] [5.8] Denmark 62.22 (45) 61.88 (43) 69.50 (2) 61.55 (11) 61.78 (9) 63.33 (3) 62.22 (18) 64.25 (4) [95.5] [4.4] [24.4] [20.0] [6.6] [40.0] [8.9] France 65.14 (638) 65.02 (535) 65.77 (103) 62.83 (149) 65.01 (139) 66.73 (196) 63.00 (104) 70.64 (50) [83.9] [16.1] [23.3] [21.8] [30.7] [16.3] [7.8] Germany 65.27 (664) 65.28 (608) 65.20 (56) 62.11 (140) 65.06 (152) 66.33 (139) 66.28 (179) 68.07 (54) [91.6] [8.4] [21.1] [22.9] [20.9] [26.9] [8.1] Italy 64.27 (270) 63.91 (232) 66.45 (38) 62.20 (44) 62.89 (76) 66.61 (83) 63.88 (42) 64.92 (25) [85.9] [14.0] [16.2] [28.1] [30.7] [15.5] [9.3] Netherlands 65.31 (178) 65.35 (173) 64.00 (5) 64.22 (47) 66.94 (47) 64.60 (30) 64.21 (41) 69.53 (13) [97.2] [2.8] [26.4] [26.4] [16.9] [23.0] [7.3] Spain 64.76 (76) 64.87 (70) 63.50 (6) 61.31 (16) 64.76 (21) 63.82 (17) 63.93 (15) 70.71 (7) [92.1] [7.9] [21.0] [27.6] [22.4] [19.7] [9.2] Switzerland 65.07 (140) 64.34 (122) 70.06 (18) 62.00 (38) 63.58 (24) 69.07 (42) 64.70 (33) 64.33 (3) [87.1] [12.9] [27.1] [17.1] [30.0] [23.6] [2.1] United 55.27 (2720) 55.13 (2491) 56.76 (229) 53.27 (1004) 56.70 (662) 56.33 (528) 54.80 (428) 62.31 (98) Kingdom [91.6] [8.4] [36.9] [24.3] [19.4] [15.7] [3.6] 59.69 (4902) 59.47 (4423) 61.73 (479) 56.38 (1490) 60.32 (1173) 61.81 (1092) 59.85 (883) 66.18 (264) [90.2] [9.8] [30.4] [24.0] [22.3] [18.1] [5.1]
Source: See text.
Table 2: Hours of work per week, 1870-1899, Men (five year moving averages)
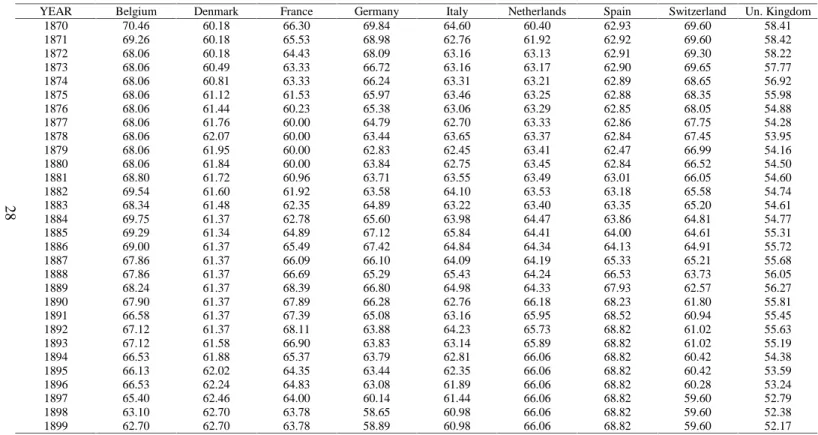
YEAR Belgium Denmark France Germany Italy Netherlands Spain Switzerland Un. Kingdom 1870 70.46 60.18 66.30 69.84 64.60 60.40 62.93 69.60 58.41 1871 69.26 60.18 65.53 68.98 62.76 61.92 62.92 69.60 58.42 1872 68.06 60.18 64.43 68.09 63.16 63.13 62.91 69.30 58.22 1873 68.06 60.49 63.33 66.72 63.16 63.17 62.90 69.65 57.77 1874 68.06 60.81 63.33 66.24 63.31 63.21 62.89 68.65 56.92 1875 68.06 61.12 61.53 65.97 63.46 63.25 62.88 68.35 55.98 1876 68.06 61.44 60.23 65.38 63.06 63.29 62.85 68.05 54.88 1877 68.06 61.76 60.00 64.79 62.70 63.33 62.86 67.75 54.28 1878 68.06 62.07 60.00 63.44 63.65 63.37 62.84 67.45 53.95 1879 68.06 61.95 60.00 62.83 62.45 63.41 62.47 66.99 54.16 1880 68.06 61.84 60.00 63.84 62.75 63.45 62.84 66.52 54.50 1881 68.80 61.72 60.96 63.71 63.55 63.49 63.01 66.05 54.60 1882 69.54 61.60 61.92 63.58 64.10 63.53 63.18 65.58 54.74 1883 68.34 61.48 62.35 64.89 63.22 63.40 63.35 65.20 54.61 1884 69.75 61.37 62.78 65.60 63.98 64.47 63.86 64.81 54.77 1885 69.29 61.34 64.89 67.12 65.84 64.41 64.00 64.61 55.31 1886 69.00 61.37 65.49 67.42 64.84 64.34 64.13 64.91 55.72 1887 67.86 61.37 66.09 66.10 64.09 64.19 65.33 65.21 55.68 1888 67.86 61.37 66.69 65.29 65.43 64.24 66.53 63.73 56.05 1889 68.24 61.37 68.39 66.80 64.98 64.33 67.93 62.57 56.27 1890 67.90 61.37 67.89 66.28 62.76 66.18 68.23 61.80 55.81 1891 66.58 61.37 67.39 65.08 63.16 65.95 68.52 60.94 55.45 1892 67.12 61.37 68.11 63.88 64.23 65.73 68.82 61.02 55.63 1893 67.12 61.58 66.90 63.83 63.14 65.89 68.82 61.02 55.19 1894 66.53 61.88 65.37 63.79 62.81 66.06 68.82 60.42 54.38 1895 66.13 62.02 64.35 63.44 62.35 66.06 68.82 60.42 53.59 1896 66.53 62.24 64.83 63.08 61.89 66.06 68.82 60.28 53.24 1897 65.40 62.46 64.00 60.14 61.44 66.06 68.82 59.60 52.79 1898 63.10 62.70 63.78 58.65 60.98 66.06 68.82 59.60 52.38 1899 62.70 62.70 63.78 58.89 60.98 66.06 68.82 59.60 52.17
Source: See text.
Table 3: Hours worked per worker and per person
(ranking)
Hours per worker Hours per person GDP/person ($ 1990 int) 1870 Maddison 1870 H&L 1899 H&L 1913 Maddison 1870 Maddison 1870 H&L 1899 H&L 1913 Maddison 1899 Maddison 1899 Leisure augmented Belgium 2964 3363 2993 2605 1245.3 1412.9 1318.0 1147.3 3579 (3) 3759 (3) Denmark 2945 2854 2973 2553 1279.1 1239.5 1272.9 1092.9 2840 (7) 2788 (6) France 2945 3144 3024 2588 1363.7 1455.8 1550.3 1209.2 2884 (6) 2760 (7) Germany 2941 3318 2798 2584 1213.3 1368.9 1204.8 1112.7 3045 (5) 3339 (5) Italy 2886 3004 2835 2536 1425.0 1483.2 1343.4 1201.3 1663 (9) 1784 (9) Netherlands 2964 2882 3153 2605 1133.1 1102.1 1191.9 984.1 3703 (2) 3508 (4) Spain 2926 3200 1433.8 1504.1 2040 (8) 1973 (8) Switzerland 2984 3359 2864 2624 1439.2 1641.7 1421.7 1293.0 3463 (4) 3838 (2) Un. Kingdom 2984 2797 2498 2624 1250.6 1172.3 1088.3 1143.0 4670 (1) 4922 (1) Max-mina 98 566 702 88 306.2 539.6 462.0 308.9 3007 3138 St. dev. 31.42 228.5 210.4 31.8 106.9 168.7 151.4 91.6 901.05 979.11 Coef. var 1.02 7.44 7.19 1.2 8.3 12.3 11.4 7.9 29.07 30.73 Interquartileb 15.5 226.6 115.3 23 82.5 117.5 120.3 94.3 600.5 607.5
Notes: a The difference between the maximum and minimum values b
Interquantile spread is equal to the value of the (75th percentile - 25th percentile) / 2 Sources: Maddison, Monitoring; Crafts, "Dimensions".
Table 4: Labor market regulation index (ranking) 1830 1840 1850 1860 1870 1880 1890 1899 1913 Austria 0.091 (1) 0.091 (5) 0.202 (3) 0.217 (3) 0.217 (3) 0.217 (6) 0.561 (2) 0.72 (2) 0.811 (4) Belgium 0 0 0 0 0 0 0.338 (6) 0.383 (10) 0.731 (7) Bulgaria 0 0 0 0 0 0 0 0 0.624 (12) Denmark 0 0 0 0 0 0.235 (5) 0.235 (10) 0.553 (6) 0.667 (10) Finland 0 0 0 0 0 0 0.242 (9) 0.333 (11) 0.447 (17) France 0 0 0.159 (4) 0.159 (4) 0.159 (4) 0.311 (4) 0.311 (3) 0.674 (3) 0.833 (2) Germany 0 0.224 (2) 0.224 (2) 0.361 (2) 0.361 (2) 0.406 (3) 0.633 (1) 0.808 (1) 0.83 (3) Hungary 0 0.152 (3) 0.152 (5) 0.121 (5) 0.121 (5) 0.121 (8) 0.194 (11) 0.33 (12) 0.603 (13) Italy 0 0 0 0 0 0 0.188 (12) 0.324 (13) 0.658 (11) Netherlands 0 0 0 0 0 0.091 (9) 0.417 (5) 0.463 (5) 0.739 (6) Norway 0 0 0 0 0 0 0 0.47 (7) 0.712 (9) Portugal 0 0 0 0 0 0 0 0.294 (15) 0.476 (16) Russia 0 0 0 0 0 0 0.182 (13) 0.311 (14) 0.54 (14) Spain 0 0 0 0 0 0.155 (7) 0.155 (14) 0.155 (16) 0.483 (15) Sweden 0 0 0 0 0 0 0.288 (8) 0.288 (9) 0.758 (5) Switzerland 0.018 (2) 0.133 (4) 0.133 (6) 0.144 (6) 0.114 (6) 0.443 (2) 0.443 (4) 0.443 (5) 0.716 (8) Un. Kingdom 0 0.311 (1) 0.483 (1) 0.483 (1) 0.483 (1) 0.559 (1) 0.559 (3) 0.559 (4) 0.907 (1) Max-min 0.091 0.311 0.483 0.483 0.483 0.559 0.633 0.808 0.46 St. dev. 0.022 0.096 0.133 0.146 0.146 0.183 0.195 0.210 0.135 Mean 0.006 0.053 0.080 0.086 0.086 0.149 0.279 0.441 0.678 Coef. var 366.7 178.9 167.0 170.1 170.1 123.1 69.99 47.67 19.94 Interquartile 0 0.046 0.076 0.061 0.061 0.118 0.118 0.151 0.078
Sources: See text.
Table 5: Worker development index (ranking)
Worker development index Real wages Annual hours of work Labor market regulation index 1870 1899 1913 1870 1899 1913 1870 1899 1870 1899 1913 Belgium 0.237 (6) 0.609 (4) 0.714 (5) 60 91 94 3363 2993 0 0.383 0.731 Denmark 0.221 (7) 0.627 (3) 0.751 (3) 36 86 102 2854 2973 0 0.553 0.667 France 0.271 (5) 0.537 (6) 0.565 (6) 50 68 66 3144 3024 0.159 0.674 0.833 Germany 0.326 (2) 0.729 (2) 0.776 (2) 58 85 92 3318 2798 0.361 0.808 0.830 Italy 0.124 (9) 0.331 (8) 0.503 (8) 26 40 55 3004 2835 0 0.324 0.658 Netherlands 0.309 (3) 0.524 (7) 0.545 (7) 52 80 72 2882 3153 0 0.463 0.739 Spain 0.292 (4) 0.262 (9) 0.344 (9) 51 51 51 2926 3200 0 0.155 0.483 Switzerland 0.189 (8) 0.607 (5) 0.725 (4) 47 75 91 3359 2864 0.114 0.625 0.716 Un. Kingdom 0.552 (1) 0.885 (1) 0.977 (1) 69 106 110 2797 2498 0.483 0.634 0.907 Max-min 0.428 0.623 0.633 43 66 59 566 702 0.483 0.478 0.425 St. dev. 0.120 0.189 0.186 12.8 20.3 21.1 228.57 210.53 0.181 0.202 0.124 Mean 0.280 0.568 0.656 49.9 75.8 81.4 3071.9 2926.44 0.124 0.513 0.729 Coef. var 42.86 33.27 28.53 25.45 26.78 25.92 7.44 7.19 146.1 39.27 16.96 Interquartile 0.65 0.93 0.86 7.13 11.75 16.37 218 94.5 0.080 0.126 0.082
Notes: WDI is composed of real wages (50%), hours (25%) and regulation (25%). WDI in 1913 is based on 1899 work hours. Swiss wages are inferred from GDP/person (Maddison) and UK real wages (1905=100).
Sources: Wages from Williamson, "Evolution"; work hours from Table 3; regulation index from Table 4.
Table 6: Hours of work by sector for selected countries
Hours of work per week
Germany Italy United Kingdom
Mining and construction
Iron and steel
Textile Mining and construction
Iron and steel
Textile Mining and construction Iron and steel Textile 1870 69.04 68.16 69.22a 65.16 64.0 64.55 57.05b 59.75 59.45 1899 58.25 61.97 63.40 61.04c 61.8 66.77 51.58 53.47 54.60c 1870-1899 % change -15.6% -9.1% -8.4% -6.3% -3.4% 3.4% -9.6% -10.5% -8.1% a 1871 b 1872 c 1895
Source: See text.
Table 7: Rank correlations
(’p’ values)
GDP/person HDI WDI TARIFF GOVT UNION VOTE
GDP/person 1.00 HDI 0.73 1.00 (0.026) WDI 0.84 0.79 1.00 (0.004) (0.011) TARIFF -0.76 -0.57 -0.57 1.00 (0.018) (0.110) (0.106) GOVT 0.49 0.71 0.72 -0.53 1.00 (0.180) (0.034) (0.029) (0.139) UNION 0.66 0.63 0.88 -0.43 0.65 1.00 (0.055) (0.070) (0.002) (0.246) (0.056) VOTE 0.51 0.64 0.70 -0.485 0.61 0.35 1.00 (0.161) (0.063) (0.037) (0.184) (0.083) (0.363)
Sources: See text.
Liste des publications au CIRANO *
Cahiers CIRANO / CIRANO Papers (ISSN 1198-8169)
96c-1 Peut-on créer des emplois en réglementant le temps de travail ? / Robert Lacroix 95c-2 Anomalies de marché et sélection des titres au Canada / Richard Guay, Jean-François
L'Her et Jean-Marc Suret
95c-1 La réglementation incitative / Marcel Boyer
94c-3 L'importance relative des gouvernements : causes, conséquences et organisations alternative / Claude Montmarquette
94c-2 Commercial Bankruptcy and Financial Reorganization in Canada / Jocelyn Martel 94c-1 Faire ou faire faire : La perspective de l'économie des organisations / Michel Patry
Série Scientifique / Scientific Series (ISSN 1198-8177)
99s-01 Globalization and Worker Welfare in Late Nineteenth Century Europe / Michael Huberman et Wayne Lewchuk
98s-41 Dynamic Equilibrium with Liquidity Constraints / Jérôme Detemple et Angel Serrat 98s-40 Monetary Policy Rules with Model and Data Uncertainty / Eric Ghysels, Norman R.
Swanson et Myles Callan
98s-39 Environmental Risks: Should Banks Be Liable? / Karine Gobert et Michel Poitevin 98s-38 Better Observability Promotes the Adoption of More Flexible Technologies / Marcel
Boyer, Armel Jacques et Michel Moreaux
98s-37 Job Characteristics, Wages and the Employment Contract / W. Bentley MacLeod et Daniel Parent
98s-36 Observability, Commitment and Flexibility / Marcel Boyer, Armel Jaques et Michel Moreaux
98s-35 Pricing ang Hedging Derivative Securities with Neural Networks and a Homogeneity Hint / René Garcia et Ramazan Gençay
98s-34 Gender Composition and Wages: Why Is Canada Different from the United States? / Michael Baker et Nicole M. Fortin
98s-33 Effects of the Fiscal Treatment of Tax Losses on the Efficiency of Markets and the Incidence of Mergers / Michel Poitevin
98s-32 Travail pendant les études et abandon scolaire : Causes, conséquences, et politiques d'intervention / Marcel Dagenais, Claude Montmarquette, Daniel Parent, Benoit Durocher et François Raymond
98s-31 Collusive Allocation of Tradeable Pollution permits / Ngo Van Long et Antoine Soubeyran
98s-30 Pollution, Pigouvian Taxes, and Asymmetric International Oligopoly / Ngo Van Long et Antoine Soubeyran
98s-29 Quadratic M-Estimators for ARCH-Type Processes / Nour Meddahi et Éric Renault
* Vous pouvez consulter la liste complète des publications du CIRANO et les publications elles-mêmes sur notre site World Wide Web à l'adresse suivante :
![Table 1: Average hours of work per week, 1870-1899 (number of observation) [percentages]](https://thumb-eu.123doks.com/thumbv2/123doknet/7675851.241097/30.1188.179.994.252.671/table-average-hours-work-week-number-observation-percentages.webp)