HAL Id: tel-02152975
https://tel.archives-ouvertes.fr/tel-02152975
Submitted on 11 Jun 2019HAL is a multi-disciplinary open access archive for the deposit and dissemination of sci-entific research documents, whether they are pub-lished or not. The documents may come from teaching and research institutions in France or abroad, or from public or private research centers.
L’archive ouverte pluridisciplinaire HAL, est destinée au dépôt et à la diffusion de documents scientifiques de niveau recherche, publiés ou non, émanant des établissements d’enseignement et de recherche français ou étrangers, des laboratoires publics ou privés.
Signs in Ambient Assisted Living Environments
Ibrahim Sadek Ibrahim Hussein Tahoun
To cite this version:
Ibrahim Sadek Ibrahim Hussein Tahoun. Nonintrusive Nocturnal Remote Monitoring of Vital Signs in Ambient Assisted Living Environments. Systems and Control [cs.SY]. Université Montpellier, 2018. English. �NNT : 2018MONTS102�. �tel-02152975�
Présentée par Ibrahim SADEK IBRAHIM HUSSEIN TAHOUN
Le 10 Avril 2018
Sous la direction de Mounir MOKHTARI, Zhang HAIHONG, Jit BISWAS
Devant le jury composé de :
[M. Timo JAMSA, Professeur, Faculté de Médecine, Université d'Oulu, Finlande] [M. David FOFI, Professeur, Université de Bourgogne, France]
[M. Philippe FRAISSE, Professeur, Université de Montpellier, France] [M. Eric CAMPO, Professeur, Université de Toulouse, France] [M. Mounir MOKHTARI, Professeur, Institut Mines-Télécom, France]
[Rapporteur] [Rapporteur] [Examinateur] [Examinateur] [Directeur de thèse]
Titre de la thèse
Télésurveillance Nocturne Non Intrusive De Signes
V it aux Dan s D es En vi ronn ement s D ’as s ist anc e A
L ’autonom ie A Domi ci le
THÈSE POUR OBTENIR LE GRADE DE DOCTEUR
DE L’UNIVERSITÉ DE MONTPELLIER
En Informatique
École doctorale : Information Structures Systèmes I2S
In front of a jury composed of:
[M. Timo JAMSA, Professor, Faculty of Medicine, University of Oulu, Finland] [M. David FOFI, Professor, University of Burgundy, France]
[M. Philippe FRAISSE, Professor, University of Montpellier, France] [M. Eric CAMPO, Professor, University of Toulouse, France] [M. Mounir MOKHTARI, Professor, Institute Mines Telecom, France]
[Reviewer] [Reviewer] [Examiner] [Examiner] [Thesis Director]
THESIS TO OBTAIN THE DEGREE OF DOCTOR OF PHILISHOPY
DELIVERED BY THE UNIVERSITY OF MONTPELLIER
Specialty Computer Science
Doctoral School: Information, Structure and Systems (I2S)
Research Unit: Image and Pervasive Access Lab, CNRS UMI 2955, Singapore
Presented by Ibrahim SADEK IBRAHIM HUSSEIN TAHOUN
On 10 April 2018
Under the Supervision of Mounir MOKHTARI, Zhang HAIHONG, Jit BISWAS
Thesis Title
Nonintrusive Nocturnal Remote Monitoring of Vital
Signs in Ambient Assisted Living Environments
v
Acknowledgments
First and foremost, I would like to thank all the people who supported and col-laborated with me to achieve this work. I could not have made it without your help.
I would also like to extend my deepest gratitude to my thesis director, Professor. Mounir Mokhtari, the Image and Pervasive Access Lab’s (IPAL) director, for giving me the opportunity to explore this work and for his expert advice, and encourage-ments. I would like to thank him for giving me the opportunity to interact and collaborate with scientists and industrial partners throughout meetings and demos. I would also like to thank him for the freedom and trust which he granted to me during my work.
I would like to give great thanks to Professor. Jit Biswas who gave me a lot of support and guidance throughout my thesis. Further, he assisted me a lot in my publications by giving advice and reviewing my papers. I would also like to thank him for initiating the collaboration between IPAL and Khoo Teck Puat (KTPH) hospital, Singapore.
Further thanks go to Professor. Bessam Abdulrazak for his interest in my research and also for his valuable contributions in my publications.
I would like to extend my appreciation to Dr. Edwin Seet for his role in data collection during our clinical study at KTPH. Moreover, I would also like to thank him for his contribution to my journal publication.
Special thanks go to Ms. Chia Audris for his valuable contribution and support during our clinical study. Without her support, we could not have completed the study.
Special thanks go to my colleagues at IPAL for their help and support during my stay, especially Dr. Thibaut Tiberghien, Dr. Joaquim Bellmunt, Martin Kodys, Antoine Demarasse, Fabien Clavier, Angela Saenz, Anssuya Etwaro. I also thank my fellow PhDers and my other colleagues.
I would like to thank my colleagues at the University of Montpellier for their help and support in my Ph.D. registration, especially Dr. Hamdi Aloulou, Firas Kaddachi, and Dr. Romain Endelin.
My Ph.D. was partially supported by A*STAR Graduate Academy (AGA). I would also like to give warm thanks to Prof. Zhang Haihong who accepted to be my co-supervisor and for his follow up throughout my research.
And last, but not least important, very special thanks go to my beloved wife Lamees, parents, who supported and encouraged me during stressful moments.
Abstract
Nonintrusive and long-term monitoring of human physiological functions are essential requirements for early diagnosis and prophylaxis due to many reasons, one of the most important being improving the quality of life. In this research, we focus on sleep monitoring as a substantial vector of quality of life. Sleep is a fundamental and vital physiological function. Getting enough quality sleep is necessary to a person’s mental health, physiological well-being, quality of life, and safety. Sleep-disordered breathing, specifically obstructive sleep apnea can result in serious health issues, including hypertension and stroke.
The current approaches for diagnosing sleep disorders are burdensome, intrusive, and can affect the patient’s sleep quality. As a result, there is a crucial need for less cumbersome systems to diagnose sleep-related problems. We propose to use a novel nonintrusive sleep monitoring system based on a microbend fiber-optic mat placed under the bed mattress. The sleep quality is assessed based on different parameters, including heart rate, breathing rate, body movements, wake up time, sleep time, night movement, and bedtime. The proposed system has been validated in a health and wellness environment in addition to a clinical environment as follows.
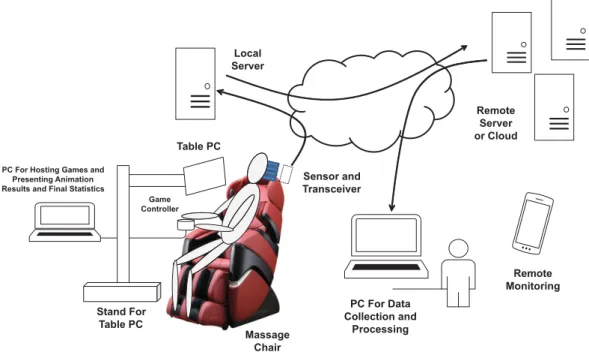
In the former case, the heart rate is measured from noisy ballistocardiogram signals acquired from 50 human volunteers in a sitting position using a massage chair. The signals are unobtrusively collected from a microbend fiber optic sensor embedded within the headrest of the chair and then transmitted to a computer through a Bluetooth connection. The heart rate is computed using the multiresolution analysis of the maximal overlap discrete wavelet transform. The error between the proposed method and the reference ECG is estimated in beats per minute using the mean absolute error where the system achieved relatively good results (10.12 ± 4.69) despite the remarkable amount of motion artifact produced owing to the frequent body movements and/or vibrations of the massage chair during stress relief massage. Unlike the complete ensemble empirical mode decomposition algorithm, previously employed for heart rate estimation, the suggested system is much faster. Hence, it can be used in real-time applications.
In the latter case, we evaluated the capacity of the microbend fiber optic sensor to monitor heart rate and respiration unobtrusively. In addition, we tested the capacity of the sensor in discriminating between shallow breathing and no breathing. The proposed sensor was compared to a three-channel portable monitoring device (ApneaLink) in a clinical setting during a drug-induced sleep endoscopy. Across all ten patients recruited for our study, the system achieved satisfactory results in the mean heart rate and the mean respiratory rate with an error of 0.55 ± 0.59 beats/minute and 0.38 ± 0.32 breaths/minute, respectively. Besides, the Pearson correlation coefficient between the proposed sensor and the reference device was 0.96 and 0.78 for heart rate and respiration, respectively. On the contrary, the proposed sensor provided a very low sensitivity (24.24 ± 12.81%) and a relatively
high specificity (85.88 ± 6.01%) for sleep apnea detection. It is expected that this preliminary research will pave the way toward unobtrusive detection of obstructive sleep apnea in real-time.
Following successful validation of the proposed system, we have successfully deployed our sleep monitoring system in thirteen apartments with mainly senior residents over six months. Nevertheless, in this research, we concentrate on a one-month deployment with three senior female residents. The proposed system shows an agreement with a user’s survey collected before the study. Furthermore, the system is integrated within an existing ambient assisted living platform with a user-friendly interface to make it more convenient for the caregivers to follow-up the sleep parameters of the residents.
Keywords: Ballistocardiography; E-Health; Sleep apnea; Technology and services for assisted-living and elderly; Technology and services for home care; Vital signs
Résumé
En vue du diagnostic précoce et la prophylaxie, la surveillance des fonctions physi-ologiques humaines est exigée d’être essentiellement à la fois non intrusive et à long terme. Parmi nombreuses motivations, l’une des plus importantes est l’amélioration de la qualité de vie. Dans cette recherche, nous nous concentrons sur la surveillance du sommeil comme un vecteur substantiel de qualité de vie. Le sommeil est une fonction physiologique fondamentale et vitale. Avoir suffisamment de sommeil de qualité est nécessaire pour la santé mentale, pour le bien-être physiologique, pour la qualité de vie et pour la sécurité d’une personne. La respiration irrégulière pendant le sommeil, particulièrement l’apnée obstructive du sommeil, peut entraîner de graves problèmes de santé, y compris l’hypertension artérielle et accident vasculaire cérébral.
Les approches actuelles pour diagnostiquer les troubles du sommeil sont lourdes, intrusives et peuvent influer sur la qualité du sommeil du patient. Il y a donc un besoin crucial de systèmes moins encombrants pour diagnostiquer les problèmes liés au sommeil. Nous proposons d’utiliser un nouveau système de suivi du sommeil non intrusif basé sur un tapis à fibre optique à microflexion placée sous le matelas de lit. La qualité du sommeil est évaluée en fonction de différents paramètres, y compris la fréquence cardiaque, le rythme respiratoire, les mouvements du corps, l’heure du réveil, la durée du sommeil, le mouvement nocturne et l’heure du coucher. Le système proposé a été validé dans un environnement de santé et de bien-être, en plus d’un environnement clinique comme suit.
Dans le premier cas, la fréquence cardiaque est mesurée à partir de signaux ballistocardiogramme bruités acquis de 50 volontaires en position assise à l’aide d’une chaise de massage. Les signaux sont recueillis discrètement à partir d’un capteur de fibre optique microflexible intégrée dans l’appui-tête de la chaise, puis transmis à un ordinateur par une connexion Bluetooth. La fréquence cardiaque est calculée à l’aide de l’analyse multi-résolution de la transformée discrète en ondelettes à chevauchement maximal. L’erreur entre la méthode proposée et électrocardiogramme de référence est estimée en battements par minute en utilisant l’erreur absolue moyenne où le système a obtenu des résultats relativement bons (10.12±4.69) malgré la quantité remarquable d’artefact de mouvement produit en raison des fréquents mouvements corporels et/ou vibrations de la chaise de massage pendant le massage de soulagement du stress. Contrairement à l’algorithme complet de décomposition du mode empirique de l’ensemble, précédemment utilisé pour l’estimation de la fréquence cardiaque, le système proposé est beaucoup plus rapide. Par conséquent, il peut être utilisé dans les applications temps réel.
Dans ce dernier cas, nous avons évalué la capacité du capteur de fibre optique microflexible pour suivre la fréquence cardiaque et la respiration d’une manière discrète. En outre, nous avons testé la capacité du capteur dans la discrimination entre la respiration superficielle et pas de respiration. Le capteur proposé a été
comparé à un dispositif de surveillance portatif à trois canaux (ApneaLink) dans un milieu clinique au cours d’une endoscopie sous anesthésie. Parmi les dix patients recrutés pour notre étude, le système a obtenu des résultats satisfaisants quant à la fréquence cardiaque moyenne et quant à la fréquence respiratoire moyenne avec une erreur de 0.55 ± 0.59 battements/minute et de 0.38 ± 0.32 respirations/minute, respectivement. De plus, le coefficient de corrélation Pearson entre le capteur proposé et le dispositif de référence était de 0.96 et 0.78 pour la fréquence cardiaque et la respiration, respectivement. Au contraire, le capteur proposé a fourni une très faible sensibilité (24.24±12.81%) et une spécificité relativement élevée (85.88±6.01%) pour la détection de l’apnée du sommeil. On s’attend à ce que cette recherche préliminaire ouvre la voie vers la détection discrète de l’apnée obstructive du sommeil en temps réel.
Suite à la validation réussie du système proposé, nous avons déployé avec succès notre système de surveillance du sommeil pendant plus de 6 mois dans treize appartements habités principalement par les personnes âgées. Néanmoins, dans cette recherche, nous nous concentrons sur un déploiement d’un mois avec trois résidents seniors de sexe féminin. Le système proposé montre l’accord avec l’enquête utilisateur recueillie avant l’étude. En outre, le système est intégré dans une plate-forme d’autonomie assistée existante avec une interface conviviale pour rendre plus commode pour les aidants le suivi des paamètres de sommeil des résidents.
Mots-clés: Balistocardiographie ; E-Santé ; Apnée du sommeil ; Technologie et services pour les personnes âgées et assistées ; Technologie et services pour les soins à domicile ; Signes vitaux
Publications
Papers in refereed journals
1. Sadek, I., Seet, E., Biswas, J., Abdulrazak, B., Mokhtari, M., 2018. Nonin-trusive Vital Signs Monitoring for Sleep Apnea Patients: A Preliminary Study. IEEE Access, 6, pp.2506-2514. [Impact factor 3.244].
doi:10.1109/ACCESS.2017.2783939
2. Sadek, I., Mokhtari, M., 2018. Nonintrusive Remote Monitoring of Sleep in Home-Based Situation. Journal of medical systems, Springer Nature, 42, 64.
[Impact factor 2.456].
doi:10.1007/s10916-018-0917-6
Papers in refereed conferences
1. Sadek, I., Biswas, J., Fook, V.F.S., Mokhtari, M., 2015. Automatic heart rate detection from FBG sensors using sensor fusion and enhanced empirical mode decomposition, in: 2015 IEEE International Symposium on Signal Processing and Information Technology (ISSPIT). IEEE, pp. 349–353.
doi:10.1109/ISSPIT.2015.7394358
2. Sadek, I., Biswas, J., Yongwei, Z., Haihong, Z., Maniyeri, J., Zhihao, C., Teng, T.J., Huat, N.S., Mokhtari, M., 2016. Sensor data quality processing for vital signs with opportunistic ambient sensing, in: Proceedings of the Annual International Conference of the IEEE Engineering in Medicine and Biology Society, EMBS. Institute of Electrical and Electronics Engineers Inc., pp. 2484–2487.
doi:10.1109/EMBC.2016.7591234
3. Sadek, I., Biswas, J., Abdulrazak, B., Haihong, Z., Mokhtari, M., 2017. Continuous and unconstrained vital signs monitoring with ballistocardiogram sensors in headrest position, in: 2017 IEEE EMBS International Conference on Biomedical and Health Informatics, BHI 2017. Institute of Electrical and Electronics Engineers Inc., pp. 289–292.
doi:10.1109/BHI.2017.7897262
4. Sadek, I., Bellmunt, J., Kodyš, M., Abdulrazak, B., Mokhtari, M., 2017. Novel unobtrusive approach for sleep monitoring using fiber optics in an ambient assisted living platform, in: Lecture Notes in Computer Science (Including Subseries Lecture Notes in Artificial Intelligence and Lecture Notes
in Bioinformatics). Springer Verlag, pp. 48–60. doi:10.1007/978-3-319-66188-9_5
Contents
1 Introduction 1
1.1 Research Description . . . 1
1.2 Current Healthcare Challenges . . . 2
1.2.1 Growing Numbers of Elderly People . . . 2
1.2.2 Prevalence of Chronic Diseases . . . 4
1.2.3 Shortage of Caregivers . . . 5
1.2.4 Rising Costs of Healthcare. . . 5
1.3 Research Objectives of this Thesis . . . 7
1.4 Structure of the Thesis . . . 7
2 Background 9 2.1 Introduction . . . 9 2.2 Cardiovascular System . . . 10 2.3 Respiratory System. . . 11 2.4 Physiology of Sleep . . . 13 2.5 Sleep Monitoring . . . 14 2.6 Polysomnography . . . 15 2.7 Actigraphy . . . 17
2.8 Consumer Sleep Tracking Devices . . . 18
2.8.1 Wearable Sleep Tracking Devices . . . 19
2.8.2 Sleep Tracking Apps on Smart-phones . . . 20
2.8.3 Bed-Based Sleep Tracking Devices . . . 22
2.9 Conclusion . . . 25
3 Literature Review 27 3.1 Introduction . . . 27
3.2 Ballistocardiography . . . 28
3.2.1 Piezoelectric Polyvinylidene Fluoride-Based Sensors . . . 31
3.2.2 Electromechanical Film-Based Sensors . . . 35
3.2.3 Pneumatic-Based Sensors . . . 40
3.2.4 Strain Gauges-Based Sensors . . . 42
3.2.5 Hydraulic-Based Sensors . . . 47
3.2.6 Fiber Optic-Based Sensors. . . 50
3.3 Conclusion . . . 53
4 System Design 55 4.1 Introduction . . . 55
4.2 System Design . . . 56
4.2.1 Suitable Sensor Selection . . . 57
4.2.3 System Validation . . . 60 4.2.4 UbiSMART Design . . . 60 4.2.5 System Integration . . . 61 4.3 Conclusion . . . 62 5 Methodology 63 5.1 Introduction. . . 63
5.2 Health and Wellness Application . . . 64
5.2.1 Quality Processing of Fiber Optic Sensor Data . . . 65
5.2.2 Application Specific Signal Data Quality . . . 66
5.2.3 Data Processing . . . 67
5.3 Clinical Application . . . 82
5.3.1 Experimental Setup and Data Collection. . . 86
5.3.2 Data Processing . . . 88
5.4 Real-life Deployment . . . 92
5.4.1 Data Collection . . . 93
5.4.2 Data Processing . . . 94
5.5 Conclusion . . . 95
6 Results and Discussion 97 6.1 Introduction. . . 97
6.2 Results of Health and Wellness Application . . . 97
6.2.1 Wavelet Analysis Versus CEEMDAN Algorithm . . . 102
6.3 Results of Clinical Application . . . 105
6.3.1 Heart and Respiratory Rate Estimation . . . 105
6.3.2 Sleep Apnea Event Detection . . . 107
6.4 Results of Real-life Deployment . . . 111
6.5 Conclusion . . . 117
7 Conclusion and Future Directions 119 7.1 Conclusion . . . 119
7.2 Future Directions . . . 121
List of Figures
1.1 Distribution of the world’s population by age and sex, 2017. Source:United Nations, Department of Economic and Social Affairs, Popula-tion Division (2017). World PopulaPopula-tion Prospects: The 2017 Revision. New York: United Nations. . . 3 1.2 Average annual rate of population changes for the world and by region,
estimates, 1950 − 2015, and medium-variant projection, 2015 − 2100. Source: United Nations, Department of Economic and Social Affairs, Population Division (2017). World Population Prospects: The 2017 Revision. New York: United Nations.. . . 4 1.3 An illustration of a sensor mat as an example of an IoT device in a
medical setting. . . 6 2.1 Anatomy of the human heart. . . 10 2.2 A schematic view of the human respiratory system. Retrieved from
Wikimedia Commons website: https://en.wikipedia.org/wiki/ Respiratory_system . . . 12 2.3 A sample hypnogram (defined by electroencephalogram) showing
sleep cycles designated by increasing REM sleep. . . 13 2.4 An illustration of the location of the various electrodes and sensors
used for monitoring sleep. Image courtesy: British Lung Foundation. 16 2.5 A 30-second epoch from the PSG. Image adapted from [Basner 2012]. 17 2.6 Examples of wearable sleep tracker devices; (a) Zeo, (b) SleepImage,
(c) Fitbit, (d) Lark, (e) WakeMate, (f) Jawbone, (g) BodyMedia SenseWear armband, (h) Hexoskin, and (i) ¯OURA. . . 21 2.7 Examples of bed-sensor devices; (a) Emfit QS, (b) Beddit, (c)
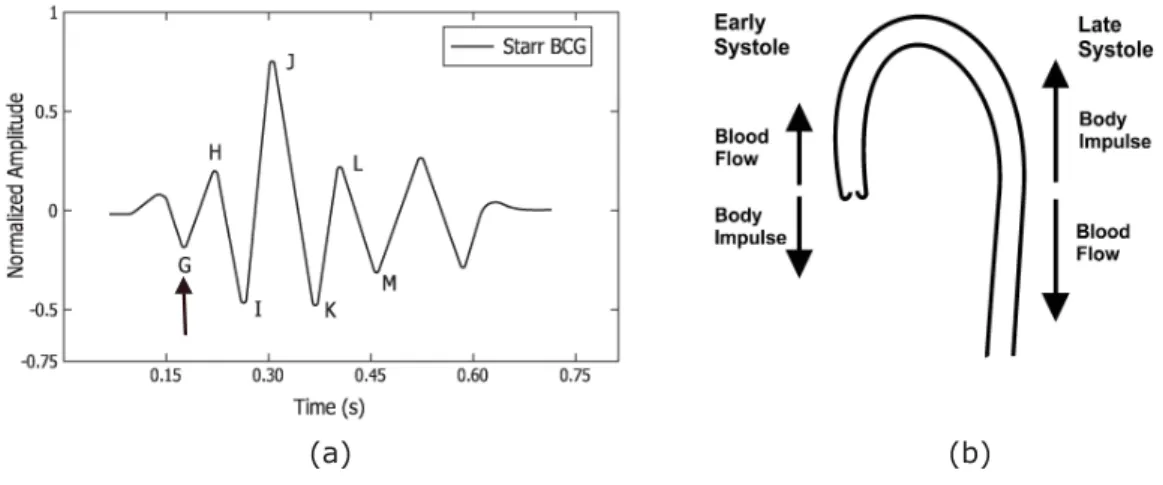
Early-Sense, (d) Sleepace Reston, (e) Withings Aura. . . 23 3.1 (a) Example of a typical BCG signal with letters used to designate
the waves. The arrow indicates the position of the beginning of the electrical ventricular systole (QRS. complex of the electrocardio-gram). Image adapted from [Starr 1939, Starr 1940, Pinheiro 2010b], (b) Aortic arch and force vectors coming from blood ejection by the
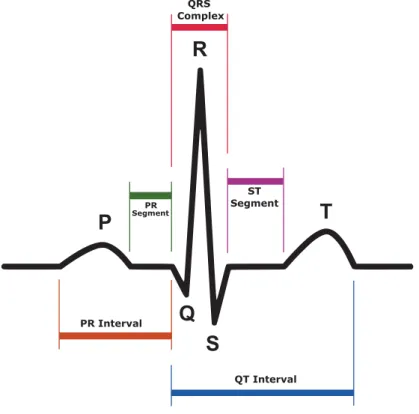
left ventricle. Image adapted from [Eblen-Zajjur 2003]. . . 28 3.2 Example of a typical electrocardiogram signal. . . 29 4.1 The deployable sensor mat and processing unit (Mat dimensions:
20 cm × 50 cm × 0.5 cm). . . . 57 4.2 Longitudinal section of the microbend fiber-optic sensor. . . 58 4.3 Simplified view of UbiSMART AAL platform with sleep mat and its
4.4 UbiSMART user interface is organized in tiles and it provides following information: daily quantity of sleep (selected day) with updated bed occupancy status that changes the color of the icon and status line; aggregated week overview of sleep quantity; and heartbeat information. 62 5.1 Opportunistic remote monitoring of vital signs. . . 65 5.2 Screen capture of the labeling tool. . . 66 5.3 Flowchart of the quality processing system. . . 68 5.4 Two examples for informative and non-informative segments (sampling
frequency: 50Hz). . . 69 5.5 BCG signal with a reference ECG signal. ECG is shown in 1st row.
However, BCG signal and its 6thdecomposition component are shown
in 2nd row (sampling frequency: 50Hz). . . . . 71
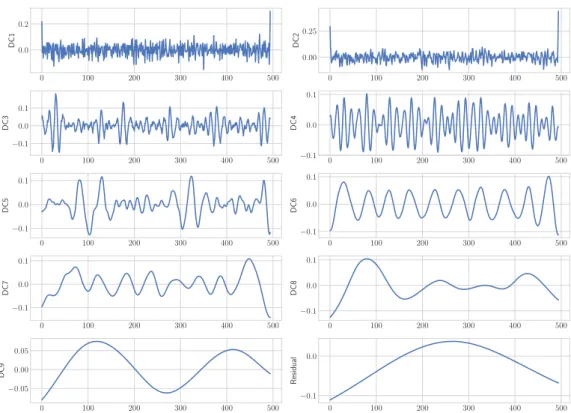
5.6 Intrinsic mode functions (DC1-DC9) of a typical BCG signal (Fig-ure 5.5); the 6th component shows a match with cardiac cycles
(sam-pling frequency: 50Hz). . . 74 5.7 An example of a signal data quality processing (sampling frequency:
50Hz). . . 76 5.8 An example of a 60-second sleep signal (sampling frequency: 50Hz). 77 5.9 An example of a 60-second body movement signal (sampling frequency:
50Hz). . . 78 5.10 An example of a 60-second bed-exit signal (sampling frequency: 50Hz). 79 5.11 Example for three-level MODWT; h{.} is a high-pass filter, g{.} is
a low-pass filter, W{.} is a wavelet coefficient, and V{.} is a scaling
coefficients. . . 80 5.12 The flowchart of the proposed heart rate estimation method; BM:
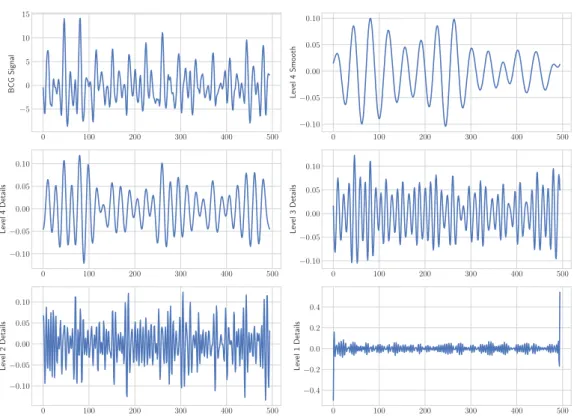
Body Movement, RR: Respiratory Rate, and MRA: Multiresolution Analysis.. . . 80 5.13 Symlet-8 MODWT multiresolution decomposition of a BCG signal
(sampling frequency: 50Hz). . . 81 5.14 The cepstrum of a 30-second ballistocardiogram signal; the heart beat
interval (HBI) is 1.02 seconds. . . 82 5.15 The autocorrelation of a 30-second ballistocardiogram signal; the
heart beat interval (HBI) is 1.64 seconds. . . 83 5.16 Drawing representing event and inter-event duration, as well as
pre-and post-event amplitude (with upward deflection of flow during inspiration). Image adapted from [Jaimchariyatam 2013]. . . 84 5.17 Sleep apnea sensor proposed by Zansors, LLC. Image adapted from
[Jennifer 2017] . . . 85 5.18 The positioning of the optical fiber mat on the operating room table. 86 5.19 Real deployment of the MFOS mat in the operating theatre of Khoo
Teck Puat Hospital. . . 88 5.20 System components and operation of ApneaLink device (ApneaLink,
List of Figures xvii 5.21 Overall system flowchart; BM: Body Movement, HR: Heart Rate, and
RR: Respiratory Rate. . . 90 5.22 An example of a 10-second body movement signal for patient No. 4. 91 5.23 An example of a 10-second sleep signal for patient No. 4. . . 92 5.24 The first, second, and third rows represent a typical 10-second
time-window of the raw signal, the BCG signal along with the 4th wavelet
smooth coefficient, and the respiratory signal respectively; amplitude values were normalized between -1 and 1. . . 93 5.25 Overview of our unobtrusive monitoring in a living space. . . 94 5.26 Sleep mat integration at the three HDB apartments; (a) 1sthome with
mat under sleeping rug, (b) 2nd home with mat under bed mattress,
(c) 3rd home with mat under bed mattress. . . . 95
5.27 Representation of a participant’s night from our real-life deployment. Three typical signal shapes are labeled according to recognized con-ditions: bed empty, bed motion, sleep. Gantt diagram: Row “B” is the result of the signal processing from the bed sensor. Row “M” shows a very inaccurate detection using motion sensors (blank space indicates activity detection in other rooms out of scope). Row “S” indicates the participant’s answer in the survey Table 5.3 about their waking and sleeping habits. . . 96 6.1 Bland-Altman plot between the reference ECG-derived heartbeat
intervals to associated BCG-derived heartbeat intervals for Group1. 100 6.2 Bland-Altman plot between the reference ECG-derived heartbeat
intervals to associated BCG-derived heartbeat intervals for Group2. 101 6.3 Box plots of the average MAE for CEEMDAN algorithm and wavelet
methods regarding the average beats per minute across all 50 subjects.103 6.4 BCG signal with the 4th level smooth coefficient during a massage
session (sampling frequency: 50Hz). . . 104 6.5 Box plots of the average MAE for best wavelet, FFT, cepstrum,
and autocorrelation methods regarding the average beats per minute across all 50 subjects. . . 105 6.6 (a) Bland-Altman plot and (b) Pearson correlation plot of all patients
regarding the HR measurement.. . . 108 6.7 (a) Bland-Altman plot and (b) Pearson correlation plot of all patients
regarding the RR measurement. . . 109 6.8 The first and second rows represent a 10-second time window of the
BCG signal and the respiratory signal for patient No. 4. . . 111 6.9 Bland-Altman plot of waking-up time for resident No. 2; green
bigotimes symbols represent Wednesday. . . . 112 6.10 Bland-Altman plot of sleep time for resident No. 3 over deployment
time. . . 113 6.11 Bland-Altman plot of waking-up time for resident No. 3 over
6.12 Bland-Altman plot of total sleep time for the 2nd resident over
de-ployment time. . . 115 6.13 Bland-Altman plot of heart rate representation of resident No. 3 over
deployment time. . . 116 6.14 Bland-Altman plot of breathing rate representation of resident No. 2
over deployment time. . . 116 6.15 Sleep disturbance distribution for resident No. 2 over deployment
time; the moving average is computed using a time-window of three days. . . 117
List of Tables
3.1 Nomenclature of ballistocardiogram (normal displacement) signal[Scarborough 1956, Pinheiro 2010b]. . . 30 3.2 Summary of unconstrained monitoring of vital signs using
PVDF-based sensors. WT : wavelet transform, N/A: not available, P. Infants: premature infants, M : male, F: female, HR: heart rate, HRV : heart rate variability, RR: respiratory rate, ACF: autocorrelation function, Min: minutes, Hrs: hours, Sec: seconds, CLC : complete-linkage clus-tering, TM : template matching, FREQ: frequency, CEP: cepstrum, PCA: principal component analysis, MAP: maximum amplitude pairs, AMDF : adaptive-window average magnitude difference function, ECG Sync: electrocardiogram synchronization, EMD: empirical mode de-composition, TH : threshold, CWT : continuous wavelet transform, Lab: laboratory. . . . 36 3.3 Summary of unconstrained monitoring of vital signs using
EMFi-based sensors. WT : wavelet transform, N/A: not available, M : male, F : female, HR: heart rate, RR: respiratory rate, ACF : autocorrelation function, Min: minutes, Hrs: hours, Sec: seconds, CEP: cepstrum, MAP: maximum amplitude pairs, AMDF : adaptive-window average magnitude difference function, EMD: empirical mode decomposition, TH : threshold, LT : linear transform, Lab: laboratory. . . . 41 3.4 Summary of unconstrained monitoring of vital signs using
Pneumatic-based sensors. N/A: not available, M : male, F: female, HR: heart rate, RR: respiratory rate, Min: minutes, Hrs: hours, Sec: seconds, STFT : short-time Fourier transform, Lab: laboratory. . . . 43 3.5 Summary of unconstrained monitoring of vital signs using
Pneumatic-based sensors. N/A: not available, M : male, F: female, HR: heart rate, RR: respiratory rate, Min: minutes, Hrs: hours, Sec: seconds, SWM/M : sliding window minimum/maximum, ECG Sync: electrocar-diogram synchronization, PCA: principal component analysis, CCF: cross-correlation function, ED: Euclidean distance, HVS: heart valve signal, ACF: autocorrelation function, SE: Shannon entropy, EMD: empirical mode decomposition, Lab: laboratory. . . . 46 3.6 Summary of unconstrained monitoring of vital signs using
Hydraulic-based sensors. N/A: not available, M : male, F: female, HR: heart rate, RR: respiratory rate, Min: minutes, Hrs: hours, Sec: seconds, WPPD: windowed peak to peak deviation, CA: clustering approach: HT : Hilbert transform, STE: short-time energy, eFUMI : extended function of multiple instances, Lab: laboratory. . . . 49
3.7 Summary of unconstrained monitoring of vital signs using Hydraulic-based sensors. N/A: not available, M : male, F: female, HR: heart rate, RR: respiratory rate, Min: minutes, Hrs: hours, Sec: seconds, BP: blood pressure, PPG Sync: Photoplethysmography synchronization: STFT : short-time Fourier transform, CEPS: cepstrum, Lab: laboratory. 54 5.1 Features’ mathematical equations. . . 70 5.2 Patients’ demographic information. . . 87 5.3 Home situation and sleep habits of each resident. . . 95 6.1 10-fold cross validation mean accuracy for Group1 and Group2, (RF:
ntrees = 50, SVM: RBF kernel, NN: 50 hidden neuron). . . 98 6.2 Accuracy results for testing Group2 Vs. Group1 (Experiment1) and
testing Group1 Vs. Group2 (Experiment2). . . 98 6.3 Confusion Matrix of random forest classifier for testing Group1 Vs.
Group2 (Experiment2). . . 99 6.4 The MAE for Group1 and Group2 before and after classification
regarding the average beats per minute. . . 99 6.5 The mean and standard deviation (SD) of the MAE for MODWT
and CEEMDAN regarding the average beats per minute across all 50 subjects. . . 102 6.6 The mean and standard deviation (SD) of the MAE for best wavelet,
FFT, cepstrum, and autocorrelation methods considering the average beats per minute across all 50 subjects. . . 103 6.7 The mean absolute error of all 10 patients for the average beats per
minute computed during the entire study. . . 106 6.8 The mean absolute error of all 10 patients for the average breaths per
minute computed during the entire study. . . 106 6.9 Sensitivity and specificity of sleep apnea detection . . . 110 6.10 Starting and ending of napping time for resident No. 3. . . 113
Chapter 1
Introduction
Contents
1.1 Research Description . . . . 1
1.2 Current Healthcare Challenges . . . . 2 1.2.1 Growing Numbers of Elderly People . . . 2
1.2.2 Prevalence of Chronic Diseases . . . 4
1.2.3 Shortage of Caregivers . . . 5
1.2.4 Rising Costs of Healthcare. . . 5
1.3 Research Objectives of this Thesis . . . . 7
1.4 Structure of the Thesis . . . . 7
1.1
Research Description
Technological progress allows us to take better care of ourselves and our relatives with less effort. Furthermore, we observe an emergence of Zero-Effort Technologies (ZET) [Mihailidis 2011]. They represent technological solutions that provide a service without requiring any form of active participation of the user. Their main paradigm is to leverage on unobtrusive observations of daily activities and on smart use of available information. Ambient Assisted Living (AAL) platforms, which is a specific type of ZET, target improving the quality of life – of both the monitored person and their caregivers. Such a platform aims at empowering people who may be at risk without assistance, especially the elderly. It contributes to users’ autonomy in their own living space rather than leaving them completely dependent on others (e.g., a nursing home) [Sadek 2017b].
In this research, we focus on sleep monitoring as a substantial vector of quality of life. Sleep is one of the most important elements all human needs similar to oxygen, water, and food. Getting enough quality sleep is necessary to a person’s mental health, physiological well-being, quality of life, and safety. Humans spend a third of their life’s sleeping. As advised, among other things, by the U.S. National Institutes of Health, sleep deficiency can lead to fatal health problems. Currently, sleep assessments and evaluation tools are burdensome, expensive, and time-consuming. For these reasons, inexpensive, non-disruptive, and unobtrusive methods to monitor sleep and sleep quality are greatly needed. Healthcare systems worldwide are struggling with significant challenges, i.e., rapid growth in aging population, increased number
of people with chronic and infectious diseases, rising costs, and inefficiencies in health-care systems. As a response to these challenges, the healthcare community is seeking out novel noninvasive solutions that can improve the quality of healthcare for the patient while maintaining the cost of the service provided. This is where a massive use of Internet of Things devices (wearables, low-energy sensors, beacons, apps) is playing a major shift in the quality of life of the population. To achieve these goals, early diagnosis, prevention, and a more efficient disease management system are highly needed [Koenig 2008]. In the following section, we discuss in more detail the current challenges facing the healthcare systems.
1.2
Current Healthcare Challenges
Across the world, healthcare challenges can exist in different shapes and forms. Thereafter, it introduces tremendous pressure on the current system. Even though every country faces different challenges and encounters diverse effects, it is still feasible to identify overall global risk to current healthcare systems. These challenges are an essential starting point for the work ahead.
Population aging, the prevalence of chronic diseases, shortage of healthcare professionals, and the unexpected rise of healthcare costs, among other reasons, are the major challenges facing today’s healthcare systems. For solving these issues, public and private sector players should collaborate together to find more innovative and cost-effective systems that can be deployed in out-of-hospital environments [Niewolny 2013]. Nowadays, clouds and the Internet of Things can help improve access to care, increase the quality of care and above all reduce the cost of care. The major challenges facing the healthcare communities are discussed in ensuing subsections.
1.2.1 Growing Numbers of Elderly People
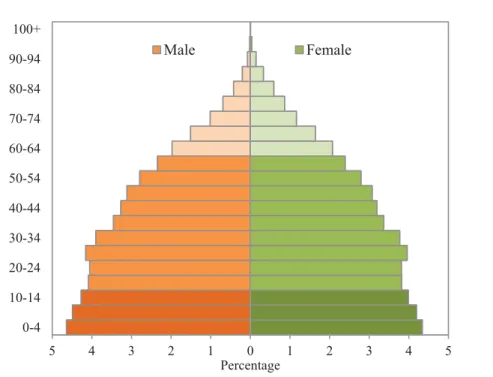
Unlike earlier generations, people are living longer and healthier due to recent advances in medical science. The elderly populations are growing more rapidly than any other age group in just about every country around the world. The reasons for this are declining fertility rates and/or rising life expectancy. In general, the world’s population is projected to increase by slightly more than one billion people over the next 13 years, reaching 8.6 billion in 2030, and to increase further to 9.8 billion in 2050 and 11.2 billion by 2100 (Figure 1.1andFigure 1.2), more specifically the number of older persons in the world is projected to be 1.4 billion in 2030 and 2.1 billion in 2050, and could rise to 3.1 billion in 2100.
Over the next few decades, a further increase in the population of older per-sons is almost inevitable, given the size of the cohorts born in recent decades [United Nations 2017]. Typically, aging causes several limitations to older adults as a result of their cognitive decline, chronic age-related diseases in addition to weaknesses in physical activities, vision, and hearing. Since the number of older people who do require a special care has grown, too few specialists and resources are
1.2. Current Healthcare Challenges 3 5 4 3 2 1 0 1 2 3 4 5 0-4 10-14 20-24 30-34 40-44 50-54 60-64 70-74 80-84 90-94 100+ Percentage Male Female
Figure 1.1: Distribution of the world’s population by age and sex, 2017. Source: United Nations, Department of Economic and Social Affairs, Population Division (2017). World Population Prospects: The 2017
Re-vision. New York: United Nations.
going to be available to address their needs. Many seniors prefer to stay alone in their homes. This phenomenon is referred to as aging in place, independent living at home, is denoted as the increased in the number of elders who remain in their own homes for the following years in their lives [Ricart 2017]. Providing a healthcare to elders living alone in their homes is a very challenging task given that fact that most of the elders might have a physical and/or cognitive decline.
Aging in place (defined as “remaining living in the community, with some level of
independence, rather than in residential care” [Wiles 2012]) becomes possible thanks to advancements in sensor technology, wireless communications, and information technology. Long-term monitoring of physiological data in real-life environments such as users’ homes is essential to help manage health problems such as cardiovascular complications, diabetes, etc. Usually, recent modalities available to monitor physio-logical data can be divided into two main categories: non-wearable and wearable sensors. The non-wearable sensors can be integrated with home furnishings and structures, whereas the wearable sensors can be embedded in a form factor of, for instance, a wristwatch, bracelet, or ring, etc.
The benefit of these sensors is that they can monitor several variables from individuals in their own homes during their normal daily activities. In addition, they can observe trends in physiological data over an extended period of time as well as automatically alert healthcare professionals or caregivers in emergency
To ta l p o p u la ti on ( b il li on s) 0 1 2 3 4 5 1950 1960 1970 1980 199 Africa Europe Northern Am Estimates (1950-2 90 2000 2010 merica 2015) 2020 2030 20 Period 040 2050 2060 Asia Latin Ameri Oceania Projections (201 0 2070 2080 2
ica & the Caribbea 15-2100)
2090 2100
an
Figure 1.2: Average annual rate of population changes for the world and by region, estimates, 1950− 2015, and medium-variant projection, 2015 −2100. Source: United Nations, Department of Economic and Social Affairs, Population Division (2017). World Population Prospects: The
2017 Revision. New York: United Nations.
situations such as falls in case of older people [Korhonen 2003]. Although some older adults might have concerns about the intrusion of privacy and loss of autonomy when using remote healthcare monitoring devices, this method is preferred by older adults since it promotes independence with the added sense of protection in case something went wrong they could get an immediate assistance [Rashidi 2013, Liu 2016,van Hoof 2011].
1.2.2 Prevalence of Chronic Diseases
There will be an increase in age-related diseases, namely Alzheimer disease and Parkinson’s disease in which cure is not yet available. Consequently, the percentage of individuals unable to live independently is going to increase. As the population ages, there is an increasing concern about how we will pay for the quality of care for the elderly and how we will address the quality of care to our aging population [Rashidi 2013]. Hereafter, there is an immediate need to use low-priced measures to improve health in this group with the intention of preventing illness and disability later [Ricart 2017]. Moreover, there is a crucial need for self and remote monitoring of vital physiological parameters.
1.2. Current Healthcare Challenges 5
1.2.3 Shortage of Caregivers
The number of healthcare practitioners and caregivers trained to deal with aging populations will be limited. As a result, family members or relatives should informally replace the caregivers. Observing dependent individuals at home might cause some difficulties to family members such as higher levels of painfulness and physical health problems [Ricart 2017]. Well-designed and -implemented technology can extend the reach of caregivers, ultimately offsetting the rising cost of healthcare and the need for skilled caregivers. To give some examples, remote health monitoring technologies such as wearable devices and video teleconferences are now making it possible for monitoring to come to patients with disabilities rather than vice-versa.
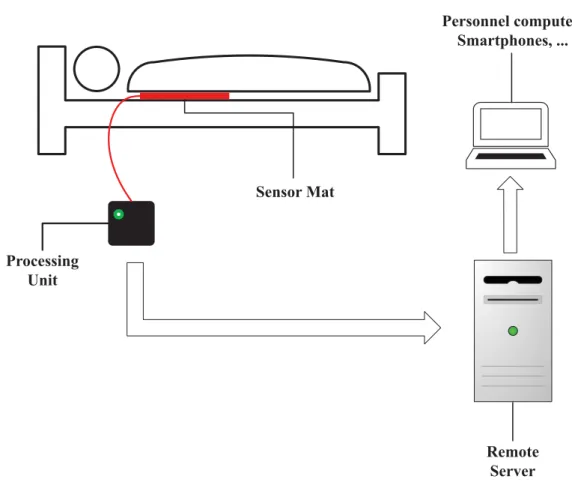
The Internet of Things (IoT) technology enables and facilitates remote monitoring of patients who don’t have ready access to effective health monitoring. Likewise, it also helps thoroughly reduce costs and promote health by increasing the availability and quality of care [Niewolny 2013, Islam 2015]. The IoT is a network of smart devices and other objects, integrated with electronics, software, sensors, and network connectivity that allows these objects to obtain and exchange data. The concept of IoT allows the healthcare professionals and caregivers to access a patient’s medical history, vitals, lab results, medical and prescription histories either on-site or remotely via tablets or smart-phones. Additionally, patients can be monitored and advised from anywhere [Dimitrov 2016]. The IoT based solution can be utilized to record patient health data in a securely manner from several sensors, apply complicated algorithms to analyze the data and then distribute it through wireless connectivity with medical specialists who can make suitable health recommendations. Figure 1.3 shows an illustration of a sensor mat as an example of an IoT device in a medical setting.
1.2.4 Rising Costs of Healthcare
Healthcare costs are projected to continue to increase. Thus, the current paradigm of health care will become unsettled as the aging population is going to grow in the coming decades [Zheng 2014]. As an example, an elderly person might have the condition of sleep-disordered breathing (SDB). The SDB, better known as the obstructive sleep apnea (OSA) syndrome and associated cardiovascular complications are among the most common clinical disorders. The prevalence of OSA was determined to influence approximately 14% of men and 5% of women, in a population-based study employing an apnea-hypopnea index (AHI) cutoff of ≥ 5 events/h associated with clinical symptoms to define OSA [Kimoff 2016,Kapur 2017]. The gold-standard approach to diagnose OSA is known as polysomnography (PSG), the PSG test should be performed in a specialist sleep clinic for a complete overnight. In principle, the sleep test includes many sensors placed on the patient body to record specific body functions such as the heart’s electrical activity, brain’s electrical activity, breathing, thoracoabdominal movement, blood oxygen saturation, body movement, etc. The PSG system provides accurate and real-time data. Nevertheless,
Sensor Mat Processing Unit Remote Server Personnel computer, Smartphones, ...
Figure 1.3: An illustration of a sensor mat as an example of an IoT device in a medical setting.
it introduces many limitations, i.e., complexity, invasiveness, excessive cost, and absence of privacy. Technological advancements in hardware and software enable noninvasive and unobtrusive sensing of vital signs. An alternative approach which may help diagnose OSA and other cardiovascular diseases is the ballistocardiography. The ballistocardiogram (BCG) signal records the mechanical activity originating from the rebound of the body, generated when the blood is pumped out of ventricles into the large blood vessel synchronous with each heartbeat [Park 2018]. During the 1900s, BCG signals were massively studied and numerous publications appeared in major scientific and clinical journals. Nevertheless, BCG signals were largely abandoned by the medical community as the measurement devices (e.g., moving table types) were very bulky and complex [Inan 2015].
Recently, BCG sensors such as the microbend fiber may be embedded in ambient locations such as mattresses, pillows, chairs, beds, or even weighing scales, to measure BCG. Some common BCG sensing technologies in literature are microbend fiber-optic sensors, fiber Bragg grating sensors, piezo-resistive fabric sensors, electromechanical film and polyvinylidene fluoride film-based sensors. One of the main advantages of the microbend fiber-optic sensor is that due to its immunity to electrical and
1.3. Research Objectives of this Thesis 7 electromagnetic interference it is a very suitable tool to be implemented in the magnetic resonance imaging environment. Other advantages include small size, lightweight, and lower price. Additionally, the sensor is an appropriate choice for unconstrained and long-term monitoring of vital signs as it is highly sensitive to pressure changes induced due to the ballistic forces of the heart, while not required to be in close contact with the body [Sadek 2017a].
1.3
Research Objectives of this Thesis
1. Design and developing a robust system for remotely collecting vital physiologi-cal signs namely heart rate, respiration, and body movement unobtrusively from subjects in their beds.
2. Design and developing a robust system for remotely monitoring the quality of sleep unobtrusively from subjects in their beds.
3. Deploying and validating the proposed system in a clinical setting.
4. Deploying the proposed system in real-life environments such as users’ homes. 5. Integrating the proposed system within an existing ambient assisted living
platform known as UbiSMART.
1.4
Structure of the Thesis
This thesis is structured as discussed below:
1. Chapter 1 describes the problem statement as well as general information about current healthcare challenges, namely growing number of older adults, the prevalence of chronic diseases, shortage of caregivers, and rising costs of healthcare. This chapter ends with the research aims and the thesis outline. 2. Chapter 2briefly describes the human physiology, including cardiovascular
and respiratory systems. The sleep cycles are also discussed, which consist of rapid eye movement sleep and non-rapid eye movement sleep. At last, the chapter discusses the gold-standard for assessing sleep and some of the available sleep monitoring technologies. These devices could be wearables such as bracelets; smart-watches or non-wearables like bed-sensors that can be installed underneath the user’s bed mattress.
3. Chapter 3gives a summary about ballistocardiography and how it has been
evolved over time to reach an acceptable level for healthcare providers. This chapter also gives a comprehensive review of available sensors used in literature to analyze and interpret ballistocardiogram signals. These sensors include microbend fiber-optic sensors, piezo-resistive fabric sensors, electromechanical film and polyvinylidene fluoride film-based sensors, load cells, strain gauges, pneumatic, and hydraulic sensors.
4. Chapter 4 covers the operating principle of the proposed sensor, i.e.,
mi-crobend fiber-optic sensor. Likewise, it discusses our system development cycle. Furthermore, it presents how the proposed system is validated in health and clinical environments. Finally, it shows how the system is integrated within an existing Ambient Assisted Living platform.
5. Chapter 5 discusses in detail the proposed methodology to analyze the data acquired by the optical fiber sensor. Various algorithms have been implemented such as empirical mode decomposition, wavelet analysis, frequency analysis, and autocorrelation function to analyze ballistocardiogram signals, and therefore interbeat intervals can be computed unobtrusively. Moreover, the data collection protocol for the two validation phases is also discussed. Wavelet analysis shows superior results compared with other algorithms. At last, the real-life deployment of the proposed system in user’s homes is provided. 6. Chapter 6describes results and discussions about the proposed methodology
to analyze the optical fiber data, in which a comparative study between various algorithms is provided. It also shows the suitability of the proposed sleep monitoring system for unobtrusive vital signs monitoring in a clinical setting. Moreover, it discusses in detail the results of our real-life deployment in three users’ apartments in one month’s time.
7. Chapter 7 summarizes the main results, conclusions, limitation of the
pro-posed system. In addition, it recommends some key factors to enhance the proposed methodology, and therefore it can provide continuous motoring of physiological functions.
Chapter 2
Background
Contents 2.1 Introduction . . . . 9 2.2 Cardiovascular System . . . . 10 2.3 Respiratory System . . . . 11 2.4 Physiology of Sleep . . . . 13 2.5 Sleep Monitoring. . . . 14 2.6 Polysomnography . . . . 15 2.7 Actigraphy . . . . 172.8 Consumer Sleep Tracking Devices . . . . 18 2.8.1 Wearable Sleep Tracking Devices . . . 19
2.8.2 Sleep Tracking Apps on Smart-phones . . . 20
2.8.3 Bed-Based Sleep Tracking Devices . . . 22
2.9 Conclusion . . . . 25
2.1
Introduction
Sleep is a very significant biological function for the human being and is important to have a physical balance and a proper regime for decent quality of life. Inadequate quality and quantity of sleep can lead to a severe influence on an individual health. As a result, sleep analysis is a very important step towards the detection and diagnosis of sleep problems. Understanding cardiovascular and respiratory systems is essential for analyzing sleep and sleep cycles, this is because the active processes in the human body are different in sleep and wakefulness. Typically, analyzing a person’s sleep requires an overnight sleep test or polysomnography that allows monitoring of several physiological functions a long with sleep cycles. Although the polysomnography or as known as the gold standard for sleep monitoring provides real-time and accurate information about sleep it is cumbersome, expensive, and time-consuming. Thus, the healthcare community is seeking out inexpensive and mobile devices that can support a long-term data collection and be accessible to most of the people. Actigraph is a very famous example that can be used for sleep analysis. The device is not as accurate as the polysomnography. However, the provided information which is based on the users’ activity is very important for healthcare professionals to understand and analyze the sleep behavior of the
users. As the hardware and software technology is advancing very fast, several devices and mobile Apps have been developed for general healthcare monitoring, including sleep. These devices could be wearable such as bracelets or smart-watches or non-wearable like bed-sensors that can be installed underneath the user’s bed mattress. We briefly explain the human physiology, including cardiovascular and respiratory systems in Section 2.2andSection 2.3, respectively. The physiological aspects of sleep are discussed inSection 2.4. Sleep monitoring and available sleep monitoring technologies are provided inSection 2.5,Section 2.6,Section 2.7, and Section 2.8, respectively. Finally, the chapter is concluded in Section 2.9.
2.2
Cardiovascular System
The cardiovascular system is an extensive network which achieves two main tasks as follows. First, it transports oxygen and nutrients to body organs. Second, it eliminates waste products formed by the metabolism of nutrients from the tissue cells. It consists of the heart and the blood vessels that circulate blood throughout the entire body [Tortora 2008].
The heart, the primary organ of the cardiovascular system, is positioned somewhat to the left of the center of the chest, i.e., between the two lungs and is shielded by the rib cage. The adult heart is roughly the size of a large fist.
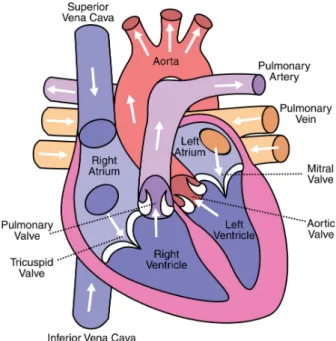
The human heart (Figure 2.1) consists of four chambers, i.e., two atria and two ventricles. The atria are the upper chambers that receive blood while the ventricles are the lower chambers that pump blood. The right atrium receives the blood
2.3. Respiratory System 11 returning to the heart and then pumps it to the right ventricle. Next, the right ventricle pumps the deoxygenated blood to the lungs to be enriched with oxygen. Afterward, the blood is returned to the left atrium throughout the pulmonary veins. The left atrium contracts and sends the blood to the left ventricle. At last, the left ventricle sends the blood through the aorta into the circulatory network. The left ventricle requires a thick muscular wall so that it can pump the blood all the way around the body. The blood in the heart is kept moving in a forward direction thanks to a system of four one-way valves. During the time of contraction, the valves open to allow blood through, and close to prevent the blood flowing in the opposite direction when the chambers relax. Moreover, the valve system acts to sustain different pressure on the right and left sides of the heart.
The cardiac cycle, the electrical activity regulating the rhythmic contraction and relaxation of the heart’s chambers, consists of two main phases, namely diastole, and systole. Diastole is the relaxation of the heart’s muscles, and it takes up approximately two-thirds of the cycle. Systole is the contraction of the heart’s muscles, in particular, the ventricles, which takes the remaining one-third of the cycle. During the time of diastole, the two atria contract following the impulse originated in the sinus node. As a result, the blood is propelled from the atria to the ventricles. During systole, the blood is ejected into the pulmonary artery and the aorta, respectively. The cardiac output (CO) is the amount of blood ejected from the left ventricle of the heart per minute. The cardiac output is the product of the heart rate (HR) multiplied by the stroke volume (SV) and is measured in liters per minute (L/m) as follows [Tortora 2008]:
CO = HR × SV (2.1)
The heart rate is the number of times the heart contracts or beats per minute (bpm). The stroke volume is the amount of blood ejected from the left ventricle with each heartbeat (one contraction and relaxation of the heart muscle) of the heart rate. It is measured in milliliters per beat (ml/beat); a decrease in the stroke volume is one of the early signs of the failing heart.
2.3
Respiratory System
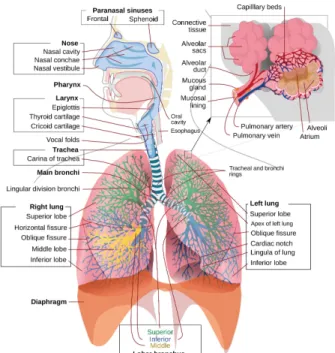
The respiratory system or a.k.a., the ventilator system plays a key role in control-ling homeostasis, i.e., balance between the multiple parts of the body’s internal environment. The respiratory system is responsible for gas exchange in the body, delivering vital oxygen to the body and removing toxic carbon-dioxide. It can achieve such important tasks during different activity levels from unconscious sleep to consciousness levels of maximal endeavor [Story 2017]. A schematic view of the human respiratory system is shown inFigure 2.2. The respiratory system can be divided into two main parts: upper airways and lower airways. The upper airway consists of the nose, the paranasal cavities, i.e., sinuses, the pharynx, and part of the oral cavity. The function of the nose, paranasal cavities, and pharynx is to
Figure 2.2: A schematic view of the human respiratory system. Re-trieved from Wikimedia Commons website: https://en.wikipedia.org/ wiki/Respiratory_system
warm, filter, and humidify the inspired air when it enters the respiratory tract. The filtering process is very important due to several reasons, among them clearing the inhaled air of dust and other debris and protecting the passage through the lungs against any potentially infectious foreign agents. The oral cavity is responsible for respiration as well as enabling sensation and smell. The main components of the lower airways encompass the larynx, trachea, and lungs. The larynx and trachea provide a channel for the pathway of air to the lungs whereas the lungs themselves receive the air and promote the gas exchange process [Rogers 2010]. The respiratory cycle consists of one respiration followed by one expiration. Ventilation (V) is the amount of air breathed in (inspiration) and out (expiration) during one minute. It can be computed by multiplying tidal volume (TV) and respiratory rate (RR) as follows:
V = TV × RR (2.2)
The tidal volume is the volume of air that enters or leaves during a single respiratory cycle. The respiratory rate is the amount of breaths per minute.
2.4. Physiology of Sleep 13
2.4
Physiology of Sleep
Knowing the basic principles of the sleep-wake cycle is very helpful to understand the importance of sleep. In human, the sleep-wake cycle involves approximately eight hours of nocturnal sleep and sixteen hours of daytime wakefulness. Two internal influences control the sleep-wake cycle, i.e., homeostasis and circadian rhythms. The homeostasis is the process of which the body maintains a steady state of internal conditions such as blood pressure, body temperature, and acid-base balance. In addition, the amount of sleep each night is also under the homeostatic control. The circadian rhythms are driven by the brain’s biological clock, and it is referred to as cyclical changes. These cyclical changes are, for example, fluctuations in body temperature, hormone levels, and sleep that happen over a 24-hour period. In human, the biological clock contains a set of neurons in the hypothalamus of the brain known as the suprachiasmatic nucleus. In physiology and behavior, these 24-hour rhythms
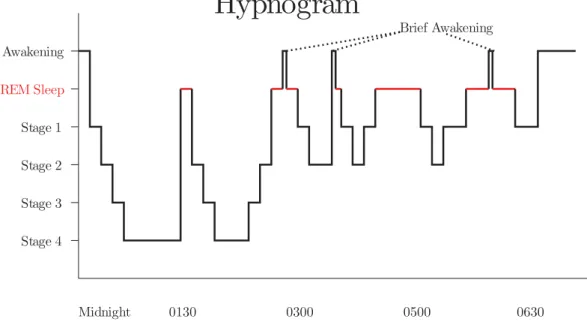
Figure 2.3: A sample hypnogram (defined by electroencephalogram) showing sleep cycles designated by increasing REM sleep.
are synchronized to the external physical environment and work/social schedules. Light and darkness, examples of the external signals, regulate the biological clock and help decide when we feel the need to wake up or go to sleep. Furthermore, the circadian clock helps promote wakefulness. On the one hand, whether it’s night or day, the homeostatic system inclines to make us sleepier as time passes throughout the waking period. However, the circadian system inclines to keep us awake, provided that there is daylight, which encourages us to sleep once it becomes dark [Battle 2009]. Sleep can be divided into two general stages: non-rapid eye movement sleep (NREM) and REM (REM) sleep.
In the first stage, i.e., the NREM sleep, the physiological activities are reduced. When we get deeper into sleep, the brain activities become slower and have a greater amplitude as measured by the electroencephalogram. Moreover, the breathing and heart rate slow down, and blood pressure drops. The NREM sleep is further subdivided into four stages as follows [Battle 2009]:
1. First Stage is the period of time from being awake to falling asleep. The 1st stage is characterized by a reduction in brain waves and muscle activity.
During this stage, people might encounter sudden muscle jerks headed by a falling sensation.
2. Second Stage is considered as a light sleep period, where the eye movements stop. During the 2nd stage, the brain activities become slower with sleep
spindles, i.e., infrequent bursts of rapid waves. The sleep spindles are combined with uncontrollable episodes of muscle tone coupled with periods of muscle relaxation. Additionally, the heart rate decreases and body temperature drops. 3. Third Stage and Fourth Stage or a.k.a., slow-wave sleep / deep sleep is
identified by slow brain waves (i.e., delta waves) scattered with smaller faster waves. During slow-wave sleep, the physiological activities decrease, and the body temperature falls even lower. In addition, the body becomes stationary. As eyes are not moving and the muscle’s activity decreases, the sleep becomes deeper even though the muscles maintain their ability to work. Waking during the slow-wave sleep is very difficult. People will feel dizzy or disoriented for some minutes if they wake during these stages. Some children might undergo bed-wetting, sleepwalk, or night terrors during this stage.
The second stage, i.e., the REM sleep is a unique phase of sleep, where the brain waves become very intense. Similar to those in the waking state, brain activities become faster and desynchronized. In addition, breathing waves becomes more rapid, irregular, and shallow; the eyes move rapidly in different directions, and limb muscles become temporarily paralyzed. Furthermore, heart rate increases, and blood pressure rises. The most memorable and vivid dreams occur during this stage as well. It is also believed that the REM sleep plays a vital role to consolidate the memory, synthesize and organize the cognition, and regulate the mood [Battle 2009]. Figure 2.3 shows the electroencephalogram of a sleep cycle described by increasing REM sleep.
2.5
Sleep Monitoring
Sleep monitoring is described as the process of obtaining a qualitative sleep metrics by monitoring a person’s sleep throughout the night. These metrics serves two functions. One is to formulate an objective view of the quality of a person’s sleep. The other function is to determine the trends in sleep over time. Respiratory rate and body movements are considered the most related measurements for sleep monitoring
2.6. Polysomnography 15 during the sleeping session. The respiratory rate and respiratory rate variability are used for REM sleep identification, while the movement metrics are utilized to discriminate between deep sleep, light sleep, and the waking stages of sleep. Several sleep parameters can also be extracted, for example, duration of a sleep period, the number of awakenings, duration of disturbed sleep periods, and the amount of time required to fall asleep. Monitoring quality of sleep can be performed using various devices that use a combination of sensors and sensor technology to examine the user’s sleep patterns [Seebo 2017]. In the following sections, we discuss some of the common techniques used to monitor and assess the quality of sleep.
2.6
Polysomnography
The term polysomnography (PSG) or a.k.a., the gold standard for sleep quality monitoring, is a complete recording of the biophysiological variations that occur during sleep. In general, the PSG is an all-night test in a specialized sleep clinic. However, it might be performed during the day if this occurs to be the patient major sleep period, such as the patients with specific circadian rhythm disorders, where their regular bedtime is during the day.
Three main information can be inferred from the PSG study as follows. First, monitoring, staging and characterizing sleep. Second, identifying sleep-disordered breathing and its outcomes. Third, quantifying periodic limb movements during sleep. Furthermore, the PSG can also provide information about irregular behaviors during sleep, i.e., parasomnias [Koenig 2008]. During a PSG study, several sensors are mounted on various parts of the body in order to detect multiple physiological parameters in real-time (Figure 2.4). These physiological parameters can be detailed as follows:
• Electroencephalography (EEG) records the electrical activities of a person’s brain using metal electrodes attached to the skin of the scalp to monitor three main regions of the brain such as frontal, central, and occipital, i.e., back. The EEG plays a vital role in determining the sleep stages of the patient.
• Electrooculography (EOG) monitors the eye movements, in which two leads are used and one is placed on the outside of each eye. The EOG also plays a role in determining the stages of sleep based on eye movements.
• Electromyography (EMG) measures muscle activities. Four electrodes might be used for the monitoring process such as two electrodes mounted on the chin and the other two placed on each leg close to the shin. The EMG can be employed to help diagnose sleep-related movement disorders such as restless leg syndrome, periodic limb movement disorder, and REM sleep behavior disorder.
• Electrocardiography (ECG / EKG) records the electrical activities of the heart using two to three electrodes on the person’s chest.
Figure 2.4: An illustration of the location of the various electrodes and sensors used for monitoring sleep. Image courtesy: British Lung Foun-dation.
• Respiratory effort measures the movements of the chest and abdominal wall. Two belts are used such as one belt around the chest and one around the diaphragm.
• A nasal cannula/pressure transducer is inserted into the nostrils to monitor changes in inhalation and exhalation as well as breathing rate. • A pulse oximeter is placed on the patient’s finger in order to measure
2.7. Actigraphy 17 the blood oxygen saturation. The sleep-disordered breathing in particular sleep apnea can be detected based on the pulse oximeter, nasal cannula, and respiratory belts information. The sleep apnea happens when the person stops breathing for 10 seconds or longer during sleep. It can be further classified into three categories such as mild, moderate, and severe, based on the number of times in an hour that the person’s breathing stops (apnea), or it becomes very shallow (hypopnea).
• A sound probe which can be utilized to detect the volume of snoring. It is also very helpful in discriminating between apnea events and hypopnea events. • In addition to the above-mentioned modalities, the patient might be monitored
on a closed-circuit video system and an audio device. This helps the technicians to record the different patient’s behaviors and movements during sleep. Furthermore, it allows a smooth communication between the patient and technicians from different rooms.
Figure 2.5shows a representative 30-second epoch from a sleep study [Basner 2012].
Figure 2.5: A 30-second epoch from the PSG. Image adapted from [Basner 2012].
2.7
Actigraphy
Actigraphy is the recording of human rest/activity cycles in a noninvasive manner. Typically, an actigraph unit is in a wristwatch-like package. The patient needs to
wear the unit for a week or more to measure entire motor activity. The movements that the actigraph unit receives are regularly recorded and some units also include light exposure. The data can be later read by a computer and interpreted offline; in some new sensors, the data are transmitted and analyzed in real-time. The current actigraphs use accelerometers that produce different values according to variations in orientation and the speed wherein the variation exists [Liu 2017b]. The objective is to sample these values multiple times a second and accumulate them over a period of time. At last, they are locally stored on the device and fetched at a later time. The actigraphs are able to record movements for many days, thanks to the accumulation of the data. As a result, they can provide a long-term data about circadian rhythms and the person’s activity patterns. Previously, the data obtained from the analog actigraphs had to be manually scored through a very time-consuming process. However, the scoring process becomes fully automated by computer algorithms installed in digital actigraphs.
Patients can put the actigraphs either on the wrist or on the ankle so that the different limb movements can be tracked. The movement received from the ankle is very important in monitoring limb movements and/or restless syndrome. Actigraphs can provide very useful information about the sleep quality due to its longitudinal nature of data collection and its suitability to be used in the subjects’ homes. Additionally, actigraphs allow researchers to conduct studies at nursing homes and assisted-living communities for both memory care and non-memory care residents. These studies can provide more information about the causes and signs of dementia along with a better understanding of the sleep modes of the residents and how their sleep requirements might deviate from people in other stages of life [Koenig 2008]. Although wearable sensors such as actigraphs can provide a long-term data collection about the user’s sleep status, they might cause inconvenience to the daily lives of older adults. This is not always true, and it might depend on the level of education and the ability to learn and accept recent technologies.
2.8
Consumer Sleep Tracking Devices
In recent years, a lot of sensor technologies have been employed, particularly to monitor sleep-wake patterns together with the gold standard polysomnography and actigraphy; these sensor technologies are usually denoted as consumer sleep tracking devices.
In general, consumer sleep tracking devices are just like actigraphs because they allow the users to be mobile and sleep as normal while being monitored closely. Most of the commercially available sleep monitors pretend to help provide information about sleep duration, quality of sleep, enabling subjects to awaken only from light sleep. Typically, the data obtained from consumer sleep tracking devices are not intended for routine diagnosis of sleep disorders. However, technological advancements in hardware and software, accessibility, ready availability allows the public to adopt them for clinical purposes.