i
Université de Montréal
Cost-effectiveness of NASH screening
par
Eric W. Zhang, MD
Département des Sciences Biomédicales Département de radiologie
Faculté de médecine
Mémoire présenté à la Faculté des études supérieures
en vue de l’obtention du grade de maîtrise en Sciences Biomédicales Option recherche clinique biomédicale
30, Avril 2017
ii
Université de Montréal Faculté de médecine
Cost-effectiveness of NASH screening
par
Eric W. Zhang, MD
a été évalué par :
Dr. Catherine Beauchemin : Président rapporteur Dr. An Tang : Directeur de recherche
Dr. Luigi Lepanto : Co-directeur de recherche Dr. Nandini Dendukuri : Membre du Jury
iii
Résumé
La stéatose hépatique non alcoolique (NAFLD) est la cause d’hépatopathie chronique la plus fréquente dans les pays occidentaux. Aucune étude n’a vérifié le rapport coût-efficacité du dépistage pour la stéatohépatite non-alcoolique (NASH), le stade avancé de la maladie.
Nous avons réalisé une analyse coût-utilité des stratégies annuelles non invasives de dépistage, utilisant une perspective d’un système de soins canadien, dans la population générale et l’avons comparé à une population à haut risque composée de patients obèses et diabétiques. Les algorithmes de dépistage incluent des techniques bien étudiées notamment le «NAFLD fibrosis score», la technique «transient elastography» (TE), et l’imagerie «acoustic radiation force impulse» (ARFI) pour la détection de la fibrose avancée (≥ F3); et le test «plasma cytokeratin-18» (CK-18) pour la détection de la NASH. La biopsie du foie et l’élastographie par résonance magnétique (MRE) ont été comparées comme méthodes de confirmation. Les coûts en dollars canadiens furent corrigés en fonction de l’inflation et actualisés à un taux d'actualisation de 5%. Un rapport coût-efficacité différentiel (ICER) de ≤$C50,000 / année de vie pondérée par la qualité (QALY) a été considéré comme coût-efficace.
Nous avons trouvé que par rapport à la stratégie sans dépistage annuel, le dépistage annuel avec l’algorithme NAFLD fibrosis score/TE/CK-18 et avec MRE comme méthode de confirmation pour la fibrose avancée, a donné un ICER de $C26,143 par année de vie pondérée par la qualité (QALY) gagnée. Le dépistage annuel dans les populations à haut risque obèses et diabétiques était encore plus coût-efficace, avec un ICER de $C9,051 et $C7,991 par QALY gagnée respectivement. La confirmation avec la biopsie du foie n’était pas coût-efficace.
Notre modèle indique que le dépistage annuel pour la NASH peut être coût-efficace, particulièrement dans les populations obèses et diabétiques à haut risque.
Mots clés: Stéatose hépatique non alcoolique (NAFLD), stéatohépatite non-alcoolique
iv
Abstract
Nonalcoholic fatty liver disease (NAFLD) is the most common liver disease in Western countries. No studies have examined the cost-effectiveness of screening for nonalcoholic steatohepatitis (NASH), its advanced form.
We performed a cost-utility analysis of annual non-invasive screening strategies using third-party payer perspective in a general population and compared it to screening in a high-risk obese or diabetic population. Screening algorithms involved well-studied techniques including NAFLD fibrosis score, transient elastography (TE), and acoustic radiation force impulse (ARFI) imaging for detecting advanced fibrosis (≥ F3); and plasma cytokeratin-18 for NASH detection. Liver biopsy and magnetic resonance elastography (MRE) were compared as confirmation methods. Canadian dollar costs were adjusted for inflation and discounted at a 5% rate. Incremental cost-effectiveness ratio (ICER) of ≤$C50,000 / quality adjusted life year (QALY) was considered cost-effective.
Compared with no screening, screening with NAFLD fibrosis score/TE/CK-18 algorithm with MRE as confirmation for advanced fibrosis had an ICER of $C26,143 per quality-adjusted life year (QALY) gained. Screening in high-risk obese or diabetic populations was more cost-effective, with an ICER of $C9,051 and $C7,991 per QALY gained respectively. Liver biopsy confirmation was not found to be cost-effective. Our model suggests that annual NASH screening can be cost-effective, particularly in high-risk obese or diabetic populations.
Keywords: Nonalcoholic fatty liver disease (NAFLD), nonalcoholic steatohepatitis
v
Table of Contents
Identification of Jury ... ii Résumé ... iii Abstract ... iv Table of Contents ... v-viii List of Figures ... ix List of Tables... x List of Abbreviations... xi-xii Acknowledgements ... xiii
Chapter 1: Nonalcoholic fatty liver and the need for health economic assessment
1.1 Introduction ... 15-16 1.2 Most prevalent chronic liver disease ... 17-18 1.3 Global trends in nonalcoholic fatty liver disease ... 18-19 1.4 Economic health assessment and decision analysis ... 19-21
Chapter 2: Nonalcoholic fatty liver disease: an overview
2.1 Definition ... 23 2.2 Epidemiology ... 24-27 2.2.1 NAFLD in the general population... 24-25 2.2.2 Risk factors for NAFLD ... 25-26 2.2.3 NAFLD in the pediatric population ... 26-27 2.2.4 NASH cirrhosis and liver transplantation ... 27 2.3 Natural history ... 27-32 2.3.1 Prognostic differences between NAFLD histological subtypes... 30-31 2.3.2 Liver-related complications ... 31-32 2.3.3 Extra-hepatic complications ... 32 2.4 Screening, surveillance, and diagnostic modalities... 32-39 2.4.1 Biomarker panels ... 33-35
vi 2.4.2 Imaging-based methods ... 35-38
2.4.2.1 Conventional ultrasound ... 35 2.4.2.2 Transient elastography ... 36 2.4.2.3 Acoustic radiation force impulse imaging ... 37 2.4.2.4 Magnetic resonance elastography ... 37-38 2.4.3 Liver biopsy ... 39-41 2.5 Management of NAFLD ... 41-44 2.5.1 Lifestyle changes ... 41-42 2.5.2 Pharmacologic therapy ... 42-44 2.5.2.1 Insulin-sensitizing agents ... 42-43 2.5.2.2 Antioxidant agents ... 44 2.5.2.3 Miscellaneous agents ... 44 2.6 Areas of uncertainty ... 44-45 2.7 Current recommendations for screening ... 45-47
Chapter 3: Appropriateness criteria for screening
3.1 Introduction to screening ... 49 3.2 Basic definitions ... 49-50 3.3 Criteria for appraising screening ... 50-56 3.3.1 Importance of the screened condition ... 51-52 3.3.2 Recognizable latent symptomatic stage ... 52-53 3.3.3 Well-understood natural history ... 53 3.3.4 Suitable screening test ... 54 3.3.5 Acceptable treatment for disease ... 54-55 3.3.6 Cost-effectiveness of screening... 55-56 3.4 Biases in screening ... 56-58
Chapter 4: Economic analysis in healthcare
4.1 Rationale of health economic analyses ... 60 4.2 Definitions ... 61-62 4.3 Type of studies ... 62-64
vii 4.3.1 Cost-consequence analysis ... 62 4.3.2 Cost-minimization analysis ... 62 4.3.3 Cost-effectiveness analysis ... 63 4.3.4 Cost-utility analysis ... 63 4.3.5 Cost-benefit analysis ... 63-64 4.4 Designing a health economic study ... 64-70 4.4.1 Clinical impasse and comparators ... 64
4.4.2 Perspective ... 65 4.4.3 Costs ... 66 4.4.4 Time horizon ... 67 4.4.5 Discounting ... 67 4.4.6 Utilities (QALYs) ... 67-68 4.4.7 Cost-effectiveness criteria ... 68-69 4.4.8 Incremental cost-effectiveness ratio ... 69-70 4.4.9 Willingness-to-pay threshold ... 70
4.5 Modelling in health economics ... 70-77 4.5.1 Decision analysis ... 70-71 4.5.2 Building a decision tree ... 71-74 4.5.3 Sensitivity analysis ... 74-75 4.5.4 Markov models ... 75-78 4.5.4.1 Introduction to Markov models ... 75
4.5.4.2 Markov states ... 75-76 4.5.4.3 Markov cycles and transitions ... 76-77 4.5.4.4 Calculating outcomes/utilities ... 77-78 4.5.4.5 The Markov property ... 78
Chapter 5: Research project 5.1 Overview of problem ... 80
5.2 Hypothesis and objectives ... 80-81 5.3 Significance of project ... 81
viii
Chapter 6: Scientific contribution
Article: Cost-utility of NASH screening ... Refer to Appendix
Chapter 7: Conclusion
7.1 Summary ... 82 7.2 Creation of TreeAge model ... 82-86 7.3 Discussion ... 86-87 7.4 Future direction ... 87-88
Bibliography ... 89-102 Appendix ...
ix
List of Figures
Chapter 1
Figure 1.1: Prevalence of Obesity, Ages 18 Years and Older, Canada, 1978-2009 ... 17
Figure 1.2: Projected relative frequencies of NASH and HCV as indications for liver transplantation ... 18
Figure 1.3: Example of a standard decision tree ... 20
Chapter 2 Figure 2.1: NAFLD disease continuum ... 23
Figure 2.2: The average prevalence of NAFLD and NASH in general and high-risk groups ... 26
Figure 2.3: Kaplan-Meier survival curve for the difference in progression to advanced fibrosis between patients with inflammation and those without ... 29
Chapter 3 Figure 3.1: Natural history of disease and detection ... 52
Figure 3.2: Lead time bias ... 56
Figure 3.3: Length time bias ... 57
Chapter 4 Figure 4.1: Trend in total health expenditure in Canada ... 60
Figure 4.2: Illustration of opportunity cost ... 61
Figure 4.3: Illustrative representation of perspectives in economic evaluations ... 65
Figure 4.4: Cost-effectiveness graph... 69
Figure 4.5: Stepwise approach to decision analysis ... 71
Figure 4.6: Beginning of a decision tree ... 72
Figure 4.7: Example of an expanded decision tree with step probabilities ... 73
Figure 4.8: Example of outcome calculation in a decision tree ... 74
Figure 4.9: Markov states in NAFLD ... 76
Figure 4.10: Markov states of NAFLD in transition ... 76-77 Chapter 7 Figure 7.1: Schematic tree diagram of natural history of NAFLD ... 84
Figure 7.2: Integration of screening strategies into natural history ... 85
x
List of Tables
Chapter 1
Table 1.1: Prevalence of NAFLD globally ... 19
Chapter 2
Table 2.1: Diagnostic performances of serum biomarkers for liver fibrosis ... 34-35 Table 2.2: Summary of noninvasive imaging modalities for NAFLD ... 38-39 Table 2.3: Indications for liver biopsy ... 40
Chapter 3
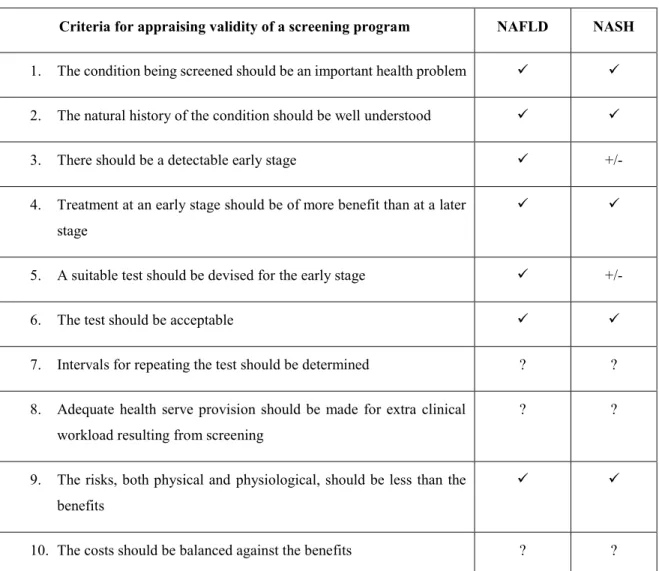
Table 3.1: Applying Wilson and Jungner’s criteria to NAFLD ... 51
Chapter 4
Table 4.1: Summary of different types of economic analyses ... 64 Table 4.2: Different types of costs and their associated perspectives ... 66
xi
Abbreviations
AASLD American Association for the Study of Liver Diseases ACG American College of Gastroenterology
AFLD Alcoholic fatty liver disease
AGA American Gastroenterological Association ALT Alanine aminotransferase
ARFI Acoustic radiation force impulse AST Aspartate aminotransferase
AUROC Area under a receiver operating characteristic curve
BMI Body Mass Index
CK-18 Cytokeratin-18
CVD Cardiovascular disease DPCP Detectable preclinical phase
EASL European Society for the Study of the Liver ELF panel Enhanced liver fibrosis panel
HCC Hepatocellular carcinoma
HCV Hepatitis C
ICER Incremental cost-effectiveness ratio MRE Magnetic resonance elastography NAFL Nonalcoholic fatty liver
xii NASH Nonalcoholic steatohepatitis
QALY Quality-adjusted life year
xiii
Acknowledgements
I express my sincere gratitude to my principal supervisor, Dr. An Tang, who first introduced to clinical research and helped inspire the basis behind this thesis. He is the model for scientific rigor, methodology, and an expert scientist, whose research in hepatic imaging has contributed to the adoption of imaging biomarkers in chronic liver disease. I consider myself very fortunate to have Dr. Tang as a supervisor and mentor over the years. His boundless enthusiasm, exemplary professionalism, and admirable creativity have inspired me and will continue to illuminate the path in my future life and career.
Dr. Luigi Lepanto, I thank for his continued and unwavering commitment and support. His expertise in Health Economics and clinical wisdom was invaluable throughout my Master’s degree and for the completion of my thesis. He is an excellent scholar, physician, and researcher. I am grateful for your continued support.
My gratitude as well to my professors and colleagues at the LBUM and University of Montreal, including Dr. Siavash Kazemirad, Dr. Jean Lachaine, and Dr. Guy Cloutier, whom I have had the opportunity and the pleasure to work with. Your support was invaluable as well to the completion of my studies.
Last, but certainly not least, I would like to also thank my family, who have been unwavering in their support during the completion of my Master’s degree. Their encouragements have allowed me to realize my projects and my goals.
14
Chapter 1
Nonalcoholic fatty liver and the need for health economic
assessment
15
1.1 Introduction
Non-alcoholic fatty liver disease (NAFLD) is the most common chronic liver disease in the Western hemisphere. It encompasses a spectrum of disease arising from the accumulation of fat in the liver. Over time, the fat depositions cause inflammatory changes within the liver, leading to non-alcoholic steatohepatitis (NASH), a subgroup of NAFLD. In turn, chronic inflammation of the liver results in collagen deposition and liver fibrosis. This process continues until the hepatic parenchyma is irreversibly changed and end-stage cirrhosis is reached. Cirrhosis is associated with numerous important clinical implications, including end-stage liver failure and increased risk of hepatocellular carcinoma. (1)
Morphologically, NAFLD is indistinguishable from alcoholic fatty liver disease. However, as the name would imply, in NAFLD, the deposition of liver fat occurs in the setting where there has been no significant alcohol consumption. (2) Instead, its pathophysiology and genesis relates to the amalgam of risk factors known collectively as metabolic syndrome. (3) It is by no coincidence that the rise in prevalence of NAFLD over the last two decades has paralleled the equally significant increases in the prevalence of obesity and type two diabetes. (4)
Currently, there is controversy regarding whether or not to screen for NAFLD/NASH. The European Society for the Study of the Liver (EASL) recommends screening for the disease in high-risk patients with metabolic syndrome and/or patients with characterized insulin resistance. (1) On the other hand, the American Gastroenterological Association (AGA), American Association for the Study of Liver Diseases (AASLD), and American College of Gastroenterology (ACG) do not recommend screening, even in high-risk groups with obesity or type two diabetes. (5)
These differing opinions stem from uncertainty in current literature regarding diagnostic tests, treatments, and overall healthcare cost-effectiveness of screening for NAFLD/NASH. In accordance with the classic screening criteria established by Wilson and Jungner, there should be an agreed-upon policy for diagnosis and treatment. In particular, the cost of such a screening policy should be balanced economically with medical expenditure as a whole.
16 (6) In addressing this important point, this thesis aims to address the current knowledge gap regarding the cost-effectiveness of screening for NAFLD/NASH.
At present, the gold standard for the diagnosis of NAFLD and NASH is liver biopsy. However, biopsy is not a benign test and entails significant risks of morbidity and mortality. These risks include bleeding, infection, and on rare occasions, even death. Combined with other limitations such as cost and sampling error, liver biopsy would be an unacceptable test for screening purposes. (7, 8) Thus, to address this issue, noninvasive detection methods have emerged over the last few decades. Among these, the most numerous and widely used noninvasive tests include: serum markers and elastography techniques. Individually, these tests have many strengths including the obvious noninvasive nature of the exam, the relative low cost, and relative ease of use. Some screening serum markers may be limited by characteristic weaknesses such as lower receiver operating characteristic (AUROC) performance ratings for detecting disease. Nonetheless, when combined together in an algorithm with both screening serum markers and diagnostic elastography techniques show promise in the screening of NAFLD. (9)
Ultimately, the goal of any screening program should be to recognize latent or early symptomatic stage of disease in hopes of diagnosing and treating the illness before the disease fully declares itself in terms of morbidity and mortality. In the case of NAFLD and NASH, the goal would be to detect and treat early stages of disease before patients reach irreversible liver cirrhosis and its associated costly sequela. While the exact cost of NAFLD/NASH to the healthcare system is difficult to quantify, it is estimated to be substantial. (10) More than a decade ago, chronic liver disease and liver cancer accounted for approximately 3 billion dollars in American healthcare cost. Furthermore, it was the 10th most common cause of disease-related death in the United States. (11) This number is now estimated to be much higher, given the increasing trend in metabolic disorder, obesity and type two diabetes. NAFLD/NASH is set to become the leading cause of liver transplantation by 2020. (12)
17
1.2 Most prevalent chronic liver disease
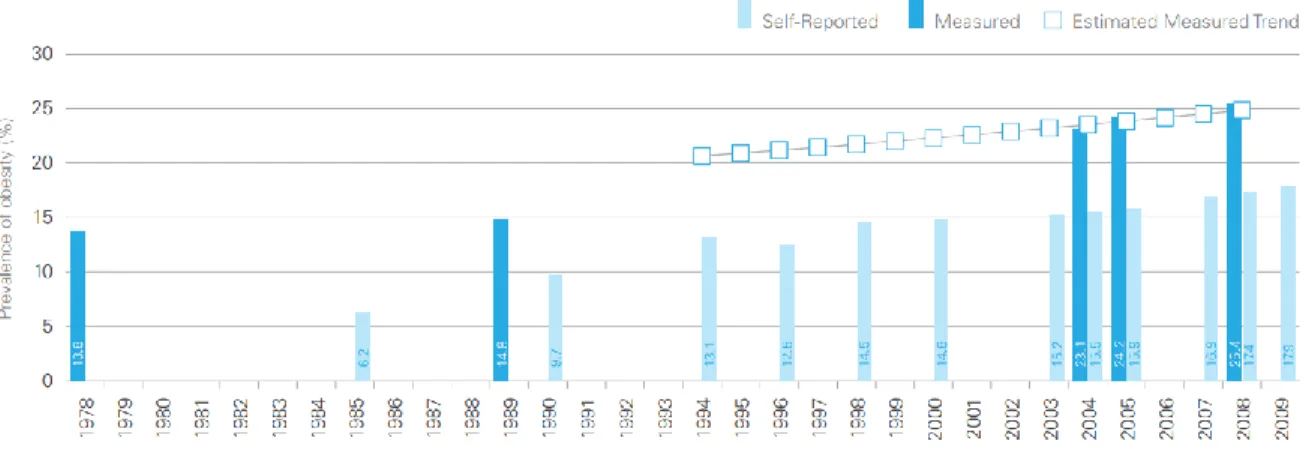
Liver disease is an important cause of morbidity and mortality in Western society and around the world. (13) In the late 1990s in the United States, it was estimated to account for 2% of all deaths and 1% of all health care expenditures. (11) Recently, the Centers for Disease Control and Prevention found that liver disease is the 12th leading cause of all death in the United States. (13) A population-based study from the United States demonstrated that the prevalence of chronic liver disease has climbed significantly from 11.78% in the years 1988-1994 to 14.78% in the years 2005-2008. (14) The increasing healthcare burden of liver disease is likely related to and exacerbated by the increasing prevalence of obesity and type 2 diabetes mellitus, which are known risk factors for NAFLD/NASH. Presently, NAFLD represents the most common cause of liver dysfunction. (4) Currently, more than two-thirds of the American population are either overweight or obese. (15) These alarming trends are similar in other Western countries, including Canada. (16) Figure 1.1 demonstrates the rise in prevalence of obesity in Canada over the last 30 years.
Figure 1.1: Prevalence of Obesity, Ages 18 Years and Older, Canada, 1978-2009. Obesity in Canada
[Internet]. Public Health Agency of Canada [cited 2014 Feb 14]. Available from: http://www.phac-aspc.gc.ca/hp-ps/hl-mvs/oic-oac/assets/pdf/oic-oac-eng.pdf.
While liver disease as a whole has been on the rise, it is now recognized that NAFLD is becoming an important cause of chronic liver disease. Current literature estimates that some 280 million obese individuals are affected by NAFLD. (17) Over the last three decades, the prevalence rates for other traditional leading causes of chronic liver disease, such as hepatitis C (HCV) and alcoholic fatty liver disease (AFLD), have not changed significantly over this
18 time. On the other hand, NAFLD has steadily risen in prevalence every year. The prevalence of NAFLD in the United States rose from 5.51% between the years 1988-1994, to 9.84% between the years 1999-2004, to 11.01% between the years 2005-2008. (14) Looking at the indications for liver transplantation in end-stage liver disease, Charlton et al. found that NASH is the third most common reason for transplantation. The trend showed that NASH as a reason for transplantation increased every year from 2001 to 2009 from 1.2% to 9.7%. On the other hand, the current number one and two reasons for liver transplantation, HCV and AFLD, have been trending downwards each year. Based on statistical projections, NASH would become the leading cause of liver transplantation between 2020 and 2030. (12, 18)
Figure 1.2 demonstrates the projected trend for liver transplantation indication.
Figure 1.2: Projected relative frequencies of NASH and HCV as indications for liver transplantation.
Charlton M. Nonalcoholic fatty liver disease: a review of current understanding and future impact. Clinical gastroenterology and hepatology : the official clinical practice journal of the American Gastroenterological Association. 2004;2(12):1048-58.
1.3 Global trends in nonalcoholic fatty liver disease
The predominance of NAFLD in Western countries has been well established. However, it is rapidly becoming apparent that NAFLD is not solely a Western phenomenon, but rather that it is becoming a global epidemic. (19) With increased globalization, job market
19 modernization, and urbanization of the populace, emerging economies have given way to the adoption of a more sedentary lifestyle, leading to a rise in the prevalence of NAFLD.
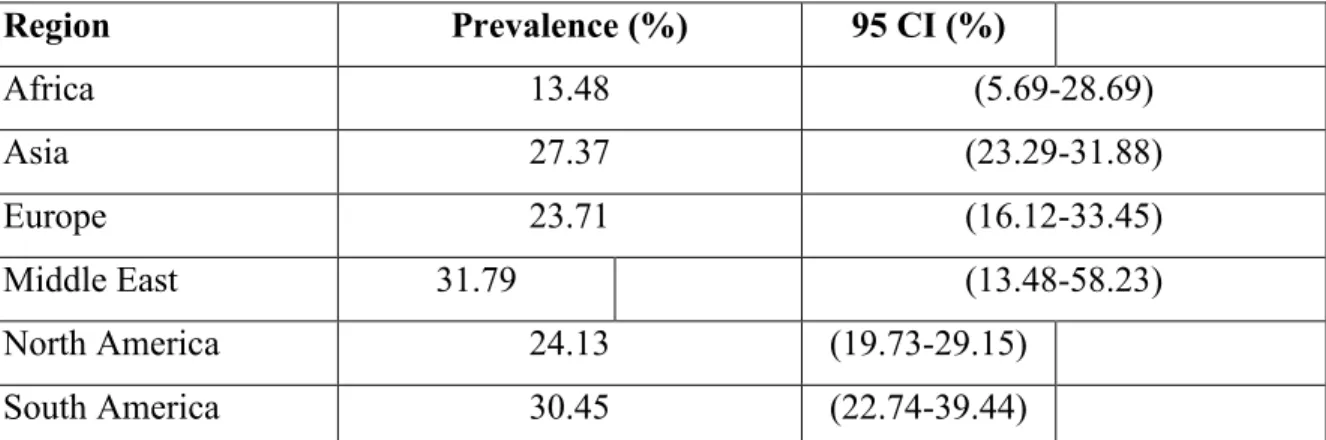
For example, several studies have already found that prevalence rates in China are now comparable to those in Europe, at 15-30% of the general population. (20, 21) Similarly in Indian urban populations, the prevalence of NAFLD ranges from 16 to 32%. Interestingly, in rural areas of the Indian subcontinent, the prevalence is only ~9%, which gives weight to the association between the modern, sedentary lifestyle and increased NAFLD prevalence. (22-24) There is a paucity of epidemiological studies on NAFLD in Africa. However, prevalence rates in Latin America and Australia have been found to be similar to those in North America and Europe. (25, 26) Based on these studies, it is estimated that some one billion people around the world are currently affected by NAFLD. (19) In the coming years, as more and more people are lifted from rural poverty, the prevalence of NAFLD is expected to continue its significant rise around the globe. Table 1.1 summarizes the high prevalence values of NAFLD stratified by region globally.
Table 1.1: Prevalence of NAFLD globally
Region Prevalence (%) 95 CI (%) Africa 13.48 (5.69-28.69) Asia 27.37 (23.29-31.88) Europe 23.71 (16.12-33.45) Middle East 31.79 (13.48-58.23) North America 24.13 (19.73-29.15) South America 30.45 (22.74-39.44)
Adapted from: Younossi ZM, Koenig AB, Abdelatif D, Fazel Y, Henry L, Wymer M. Global epidemiology of nonalcoholic fatty liver disease-Meta-analytic assessment of prevalence, incidence, and outcomes. Hepatology. 2016;64(1):73-84
1.4 Economic health assessment and decision analysis
A large part of implementing new healthcare strategies revolves around the concept of economic analysis. It is often not enough to establish the efficacy of a drug or a screening
20 strategy, but also address the question of effectiveness and cost-effectiveness. Put more plainly, it should not only work on an individual level, but also be worth it when implemented into society. In the current climate of growing healthcare cost, the notion of responsible healthcare expenditure is especially important for health policy makers and healthcare professionals alike. (27) It is therefore necessary to address the cost-effectiveness of any new healthcare screening program. (28)
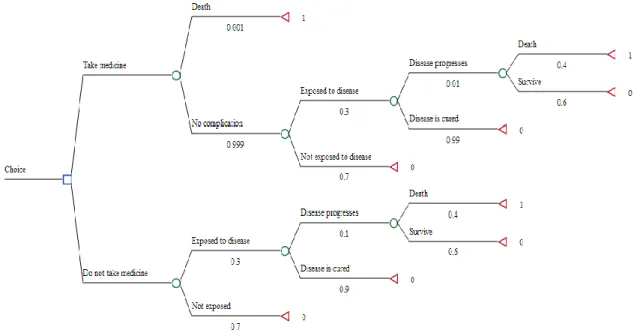
Decision analysis trees are used to quantify and compare various healthcare strategies, and have been largely established in the field of pharmacoeconomics. It is an elegant way of simplifying complex strategies into different decision nodes, and quantifies the differences and consequences associated with each decision. (29) Figure 1.3 is an example of a standard decision tree for deciding between taking a drug and not taking a drug for a generic disease.
Figure 1.3: Example of a standard decision tree. The blue square denotes a choice node between competing
options. The green circle denotes a probability node, indicating the probability of an event occuring. The red triangle denotes a termination node, indicating the end of a decision branch. The probability values are indicated under each event branch. Each termination node is assigned an outcome variable. In this case, the outcome of interest is death, which is assigned a “1”. Thus, in this case, we are calculating the difference in deaths between taking and not taking the medicine.
21 A Markov model is a stochastic model with three key features which make them particularly useful in addressing chronic diseases and clinical scenarios. Firstly, the simulated population begin in a finite set of mutually exclusive health states. Secondly, there is an established time period, called a “cycle”. Each cycle, individuals either move onto another health state or stay in their current health state. Thirdly, movements between health states each cycle is governed by a transitional probability. The main advantage of Markov modeling in decision analysis is that it allows simulations that are more complex, and therefore, more in line with real life. More possible events can be simulated and over a longer time period. (30)
22
Chapter 2
23
2.1 Definition
NAFLD is a broad spectrum of disease characterized by excessive fat accumulation (>5% macrovesicular steatosis) arising in a setting where there is no significant alcohol consumption and where other causes of liver disease (viral, genetic, autoimmune etc.) have been excluded. The American societies define significant alcohol consumption as > 21 drinks on average per week in men and > 14 drinks on average per week in women. (5)
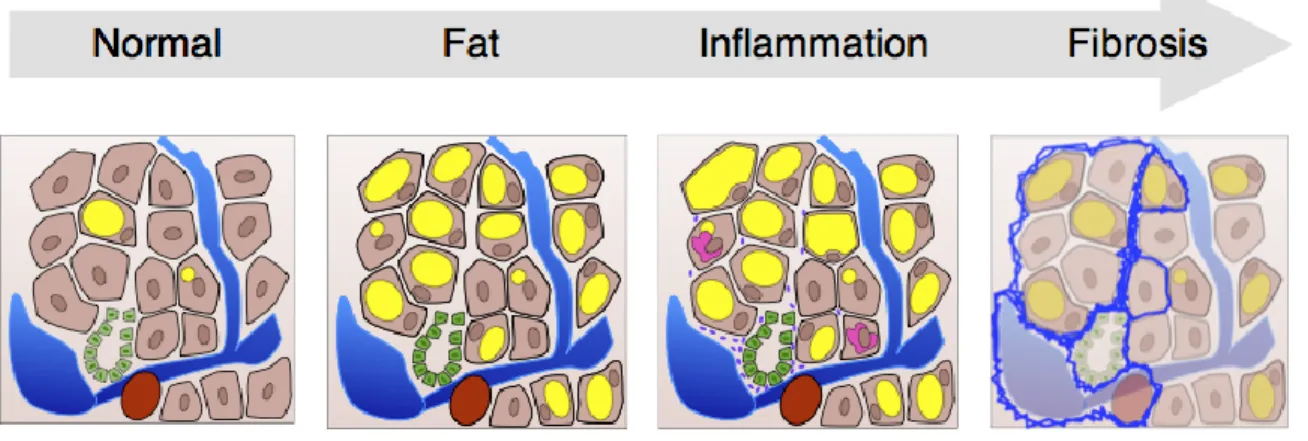
NAFLD has two major subdivisions: nonalcoholic fatty liver (NAFL or simple steatosis) and NASH (nonalcoholic steatohepatitis). Simple steatosis is the non-progressive form of NAFLD that rarely develops into NASH and more serious sequelae of chronic liver disease. NASH is defined as the subgroup of NAFLD characterized by the presence of steatosis, ballooning degeneration and lobular inflammation, with or without peri-sinusoidal fibrosis. (31, 32) NASH is the progressive form of NAFLD that can advance to fibrosis, cirrhosis, hepatocellular carcinoma (HCC) and liver-related mortality. (33) Figure 2.1 illustrates the NAFLD disease continuum.
Figure 2.1 (courtesy of Dr. An Tang): NAFLD disease continuum. In nonalcoholic fatty liver or simple
steatosis, there is >5% fat infiltration with or without mild inflammation (denoted intracellularly in yellow). As the disease progresses, so does the necro-inflammatory changes including ballooning degeneration, Mallory bodies (denoted intracellularly in pink), and inflammatory cell infiltration of the liver (denoted by the tiny purple cells). Chronic inflammation leads to increasing liver fibrosis (denoted in blue).
24
2.2 Epidemiology
2.2.1 NAFLD in the general population
Population-based studies on NAFLD prevalence have been done using a variety of diagnostic methods. While it is probably most accurate to use liver biopsy, the reference standard for diagnosis, the invasive nature of the exam makes it unsuitable for epidemiological studies. Somewhat circumventing this issue, an American study looking at liver biopsies of potential liver donors found that 20% of potential donors were ineligible for organ donation due to significant degrees of steatosis (>30%). (34) Elsewhere in South Korea, among more than 500 consecutive potential liver donors, the prevalence of NAFLD was even higher at 51%. (35)
Given the risks behind using liver biopsy in epidemiological studies, most studies looking at the prevalence of NAFLD have used non-invasive methods such as imaging-based studies and serum markers. Evidently, these non-invasive methods are less accurate than histology-established diagnosis. Nonetheless, significant conclusions can be drawn from these large population-based studies.
Non-invasive imaging-based studies have assessed the prevalence for NAFLD using magnetic resonance imaging (MRI) and ultrasonography. A large multicenter, cross-sectional population study in Spain demonstrated that the prevalence of NAFLD was 33.4% in men and 20.3% in women. (36) In the Dionysos nutrition and liver study in Italy, subjects with and without suspected liver disease underwent ultrasonographic testing for NAFLD. The study found that among 3,345 subjects, the prevalence of NAFLD in those with and without suspected liver disease was 25% and 20% respectively.(37) American studies have found that the prevalence of NAFLD is equally high if not higher. A large ultrasound-based study performed at the Brooke Army Medical Center found the prevalence of NAFLD to be 46%. (38) The Dallas Heart Study, which used a MRI-based (MR spectroscopy) method for detecting NAFLD, demonstrated that the general prevalence of NAFLD in the general population was 31%. (39)
In terms of serum markers, alanine aminotransferase (ALT) and aspartate aminotransferase (AST) have been used as non-invasive indicators of NAFLD in population-based studies. A study by the Johns Hopkins Hospital Execute Health Program demonstrated
25 that 14% of NAFLD patients had at least one elevated liver enzyme while 21% had both.(40) Another study estimated the prevalence of NAFLD using only aminotransferases to be around 8% to 9%.(41) However, it is worth noting that while aminotransferases is relatively cheap and readily available, it is not a great test for diagnosing NAFLD. It is now known that a significant number of patients with NAFLD have normal ALT and AST levels.(33) In the Dallas Heart study, 80% of cases of patients with increased hepatic triglyceride content were reported to have normal aminotransferases. (37) Due to its low specificity, aminotransferases alone is unlikely to provide an accurate assessment of population-wide prevalence.
In summary, most American studies have reported the prevalence of NAFLD to be 10-35%. Rates reported from the rest of the world is surprisingly similar, ranging from 6% to 35%, with a median of 20%. (33) The discrepancy between the rates likely varies with the modality used as well as the study population. In general, the prevalence of NAFLD in the North American is thought to be closer to 30%, given that approximately one-third of the population is obese. (33)
2.2.2 Risk factors for NAFLD
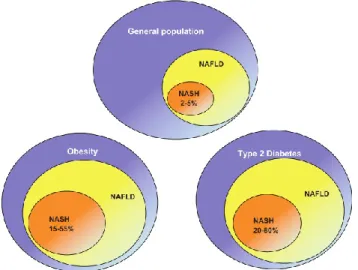
Epidemiological studies looking into NAFLD risk factors reveal that excessive BMI and visceral obesity are among the most important risk factors. Bariatric surgery patients with severe obesity have been found to have a prevalence of NAFLD exceeding 90%. Up to 5% of these patients have undetected NASH cirrhosis as well. (33, 42, 43) The other major risk factor for NAFLD is type two diabetes mellitus. Studies have shown that between 69 to 87% of type two diabetic patients assessed by either ultrasound or biopsy demonstrated some form of NAFLD. (44, 45) Other risk factors include individuals with dyslipidemia, of which the prevalence of NAFLD is estimated to be 27-92%. (4) Taken as a whole, these major risk factors for NAFLD are essentially those described in metabolic syndrome (MS), with the two entities being intimately associated. Figure 2.2 illustrates the average prevalence of NAFLD and NASH in obese and diabetic patients.
Besides metabolic syndrome, other factors associated with NAFLD include age, male gender, and Hispanic heritage. The prevalence of NAFLD increases with age. Advanced age is also linked to increased likelihood of developing NASH cirrhosis and mortality risk
26 associated with NAFLD. (4) In terms of gender, males are considered more at risk of developing NAFL. (46) Finally, the Hispanic population have been found to have significant higher prevalences of NAFLD than non-Hispanics. (47)
Figure 2.2: The average prevalence of NAFLD and NASH in general and high-risk groups. Bhala N,
Jouness RI, Bugianesi E. Epidemiology and natural history of patients with NAFLD. Curr Pharm Des. 2013;19(29):5169-76.
2.2.3 NAFLD in the pediatric population
NAFLD in children is a significant known entity that should be recognized early to offset the rapid development of severe complications. Children as young as 2 years old have been found to have NAFLD, with documented cases of NASH-related cirrhosis as young as 8 years old.(48, 49) In such extreme cases, genetic or environmental susceptibility may be called into question.
Given that the definition for NAFLD is the same for children as adults, precise estimation of prevalence in this subset population presents with the same difficulties as in adults. The different estimates vary depending on the type of imaging or serum test, the cut-offs for detection, as well as geographic differences in age, sex and ethnicity. An autopsy study using the gold standard liver biopsy estimates NAFLD prevalence to be 9.6% in 742 children aged 2 to 19 years old who died from unnatural causes.(48) Another study using abnormal aminotransferases as serum detection cites the prevalence of NAFLD in 17-18 year olds to
27 be 23%.(49) Multivariate analyses have demonstrated that obesity, male gender and older age are independent predictors of fatty liver prevalence in children. (49)
2.2.4 NASH cirrhosis and liver transplantation
With the rise of NAFLD, NASH cirrhosis is expectedly becoming an increasingly common reason for orthotopic liver transplantation. According to the United Network for Organ Sharing, NASH cirrhosis accounted for 3.5% of transplants in 2005, versus just 0.1% of transplants in 1996. Furthermore, the number of transplantations attributed to NASH cirrhosis is thought to be significantly higher, due to its under-recognition as well as association with exclusive comorbidities such as obesity or diabetes mellitus. (50) The number of patients who will undergo transplantation due to NASH cirrhosis is expected to rise in the coming decade as recognition of NAFLD improves, the obesity epidemic worsens and the prevalence of hepatitis continues to decrease.(12)
Interestingly, about 25% of patients with transplanted liver for NASH cirrhosis redevelop steatosis in the first year. By the fourth year, almost 50% of patients will develop steatosis, with 30-50% of these patients also demonstrating histologic evidence of NASH. (51) Post-transplantation studies have found that risk factors for recurrent or de novo NAFLD include obesity, diabetes mellitus/insulin resistance and elevated total cholesterol, the very same risk factors for the development of NAFLD in the first place. (50)
In summary, NASH is becoming an increasingly important reason for end-stage liver disease. It has surpassed alcoholic liver disease, falling behind only hepatitis C as the second-leading indication for liver transplantation. (52)
2.3 Natural history
The actual trigger for the evolution of simple fatty liver disease to end-stage fibrosis/cirrhosis is not well understood. Current literature on this subject is lacking in terms of well-controlled, longitudinal studies, and is limited by use of nonstandard definitions as well as referral and publication bias. Null studies concerning disease progression are less likely to be submitted and published. Furthermore, well designed longitudinal studies are more time-consuming and costly. (51) Of all potential predictors of
28 disease progression, initial patient histology on presentation has demonstrated the best predictive value for progression of disease. While those with “benign” fatty liver appears to have a small likelihood to progress to cirrhosis over a single lifetime, it is those patients with inflammation or histopathologically-proven steatohepatitis that have the increased likelihood of advancing to fibrosis. (53) Importantly, it is patients with NASH and advanced fibrosis that have the greatest risk of developing cirrhosis, liver failure, and hepatocellular carcinoma. (54, 55) Patients with isolated steatosis demonstrate very low progression to fibrosis and liver-related mortality. (56) Patients with biopsy-proven NASH NAFLD are six times more likely to die from liver-related mortality than non-NASH NAFLD. (57)
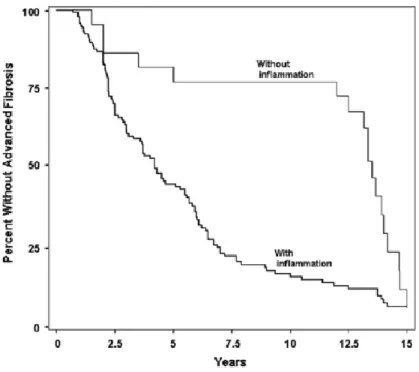
On the other hand, patients with NASH are at increased risk of developing early and advanced fibrosis. Current literature places fibrosis progression in NASH at 25 to 30% of cases over 4 years and in 50% of cases over 6 years.(31, 56, 58-61) Other estimates place the rate of progression at one fibrosis stage every 7 years, which is significantly higher than rates seen in non-NASH NAFLD. (62) Once progressive fibrosis begins, the patients are at risk of developing end-stage liver cirrhosis. According to one of the longest cohort studies on this subject, over a mean period of 13.7 years, 13% of patients with mild-to-moderate fibrosis developed cirrhosis. Furthermore, 25% of patients with moderate-advanced fibrosis developed cirrhosis and end-stage liver disease. (56) Figure 2.3 illustrates the Kaplan-Meier survival curve demonstrating the difference in progression to advanced fibrosis (stage 3 or 4 fibrosis) between patients with biopsy-proven inflammation and those without.
29
Figure 2.3: Kaplan-Meier survival curve for the difference in progression to advanced fibrosis between patients with inflammation and those without. Advanced fibrosis is defined as stage 3 or stage 4 fibrosis.
The two cohorts are stratified by the presence of any inflammation on initial index biopsy in patients included in paired biopsy, natural history studies of NASH. Argo CK, Northup PG, Al-Osaimi AM, Caldwell SH. Systematic review of risk factors for fibrosis progression in non-alcoholic steatohepatitis. Journal of hepatology. 2009;51(2):371-9.
Metabolic syndrome plays a central role in the development of NAFLD. Metabolic syndrome consists of central obesity, hypertension, hypertriglyceridemia, impared glucose tolerance and low high-density lipoprotein cholesterol. Over 90% of NAFLD patients have at least one of these aforementioned traits.(63) The acceleration of NAFLD over the last two decades has paralleled the rise of overweightness and obesity in the general population. In the Dionysos study, 94% of obese patients (body mass index greater than or equal to 30kg/m2) and 67% of overweight patients (body mass index greater than or equal to 25/m2) had NAFLD. These staggering figures were compared with only 25% of normal weight patients who had NAFLD. (37, 64) Abdominal obesity appears to be an independent predictor for NAFLD, with an association noted between degree of abdominal obesity and the likelihood of NAFLD. (65)
30 The other important factor in the pathophysiology of NAFLD is insulin resistance. The overall prevalence of NAFLD in those patients with type 2 diabetes is between 40% and 70%. (66) Many cross-sectional studies have postulated that hepatocyte ballooning, inflammation and fibrosis, phenotype changes in steatohepatitis are associated with type 2 diabetes. (63) There is also evidence of higher degrees of steatosis in type 2 diabetes with up to 200% more liver fat than those without in age-, gender-, and BMI-matched controls. (67) Interestingly, according to one of the largest multicenter prospective study from four countries, end-stage cirrhosis from NAFLD appears to lead to lower rates of liver-related complications as well as lower rates of HCC as compared with end-stage cirrhosis by HCV infection. However, the overall mortality of both conditions is very similar, due in part to similarities in vascular/non-liver related complications. This important fact harkens back to the fact that hypercholesterolemia and diabetes are associated with both NAFLD as well as major vascular complications. Thus, the authors argue for more holistic treatments for NAFLD in order to tackle the very real risk of mortality from cardiovascular complications. (68)
In summary, the presence of inflammation or NASH on initial liver biopsy comprises one of the strongest predictors for NAFLD progression. The degree of fibrosis is the most important prognostic factor. (51, 55) Liver steatosis by itself is not associated with increased liver-related mortality or significant NAFLD progression. Given this knowledge on the natural history, the effort should be oriented towards identifying and treating the patients with steatohepatitis and advanced fibrosis.
2.3.1 Prognostic differences between NAFLD histological subtypes
A meta-analysis of five community-based studies assessing the prognosis of different NAFLD histological subtypes demonstrated interesting results.(9) The survival of those patients with simple steatosis was found to be very similar to that of the general population. In comparison, the patients with NASH had a significantly higher overall mortality than those with simple steatosis with an OR of 1.81 (CI 95%). Of all possible causes of death, liver
31 disease was the main etiology for death excess in NASH, with a liver-related mortality rate of 11 to 17.5% as compared with 1.7 to 2.7% in patients with simple steatosis. (9)
While the presence of NASH is a significant factor in liver-related and overall mortality, fibrosis stage is an even stronger predictor of overall mortality.(55) Besides overall mortality, fibrosis stage is also a strong predictor for hepatocellular carcinoma and cirrhosis, two long-term liver-related complications of NAFLD. Interestingly, fibrosis stage has also been found to be predict increased rate of cardiovascular and infectious diseases. (55)
2.3.2 Liver-related complications
Liver-related complications in NAFLD can be divided into those related to cirrhosis and terminal liver failure, and long-term complications related to hepatocellular carcinoma (HCC). Cirrhosis imparts increased mortality and complication risk, related to synthetic liver dysfunction, which is a well-studied process. (4) In theory, patients with advanced NAFLD who reach the cirrhotic stage would suffer from the same rate of complications as cirrhotic patients from any other etiology such as hepatitis C (HCV). However, there is evidence to suggest that NAFLD cirrhosis has lower rates of liver-related complications when compared with HCV patients. A large multicenter prospective trial of 511 patients comparing the mortality and morbidity between NAFLD and HCV cirrhotic patients found that the cumulative incidence of liver-related complications was lower in the NAFLD cohort than the HCV cohort. (68) Importantly, the same study did not demonstrate any significant difference in overall mortality between the two cohorts. (68) These results were confirmed in previous smaller trials as well.(69, 70)
HCC represents another significant complication associated with advanced NAFLD and cirrhosis. While population-based studies looking at the long-term history of NAFLD have been limited by small size, the bulk of the evidence have confirmed the association between NAFLD and HCC.(31, 68, 70) One of the largest prospective community-based study thus far demonstrated a 10% rate of HCC in patients with NAFLD cirrhosis after a mean follow up of 7.6 years.(71) Interestingly, it has been demonstrated that there is a relative decrease in risk of HCC in patients with NASH cirrhosis versus HCV cirrhosis. A large cohort study
32 concluded that the risk of HCC in HCV was significantly more than in NAFLD (6.8% versus 2.4% respectively).(68) Nonetheless, HCC remains an important complication of NAFLD. NAFLD cirrhosis is associated with an incidence of up to 10% over 7 years.(4) Furthermore, there has been evidence to suggest that HCC can develop in NAFLD patients even in the absence of cirrhosis, where metabolic syndrome is the only identifiable risk factor.(72) Lastly, most cases of HCC associated with NAFLD are detected on first referral, a fact that outlines the importance of clinical vigilance and surveillance of disease.(4)
2.3.3 Extra-hepatic complications
Besides liver-related complications, NAFLD also increases the risk for developing type 2 diabetes, cardiovascular disease (CVD), and peripheral vascular disease. The relationship between NAFLD and risk of future diabetes was established in a meta-analysis of 21 prospective, population-based studies.(73) Furthermore, patients with both NAFLD and type 2 diabetes have a further increased risk of diabetes-related complications such as coronary heart disease, ischemic stroke, and cardiovascular death.(74)
Growing literature seems to suggest an independent and active involvement of NAFLD in the pathogenesis of CVD.(75) It has been demonstrated that the presence of hepatic steatosis is associated with increased intima-media thickness of the carotid arteries as well as increased presence of carotid plaques.(76) Furthermore, patients with NAFLD have been associated with significantly higher estimated cumulative risk of major cardiovascular events (19% in NAFLD patients vs. 10% control).(77) However, while the association exist, the underlying causal mechanism linking the two pathologies is currently uncertain.
2.4 Screening, surveillance, and diagnostic modalities
Given the previously mentioned uncertainties, the specifics of screening and surveillance policies in NAFLD remain an open question.(78) Nonetheless, much work is currently underway in finding the most accurate noninvasive modalities in the diagnosis of NAFLD
33 across its disease spectrum. These noninvasive modalities are divided into two broad categories, biomarker panels and imaging-based methods.
2.4.1 Biomarker panels
Biomarker panels represent a significant proportion of the current tools available for the non-invasive assessment of NAFLD. They include an array of biochemical parameters ranging from routine liver function tests to markers of hepatocyte apoptosis and markers of adipose tissue-releasing cytokines. Despite universal reliance on liver transaminases for the detection of liver pathology, in reality liver transaminases by themselves are not accurate enough for NAFLD screening. This is because the majority of patients with NAFLD present with normal transaminase levels and histologically advanced disease can readily be missed.(78) While individually, blood tests may lack in diagnostic accuracy, when combined together in an algorithm, their diagnostic accuracy increases substantially. Through multiple regression analysis, predictive equations have been designed and studied in order to best predict the probability of disease in the clinically important NAFLD (i.e. NASH or advanced fibrosis).(9)
For example, the BARD score represents one of the most basic algorithms, comprising of biochemical and clinical parameters readily available to the clinician (BMI, AST/ALT ratio, presence of diabetes).(79) While the BARD score is relatively easy to use, it has been proven to be inferior to several other non-invasive biomarker panels.
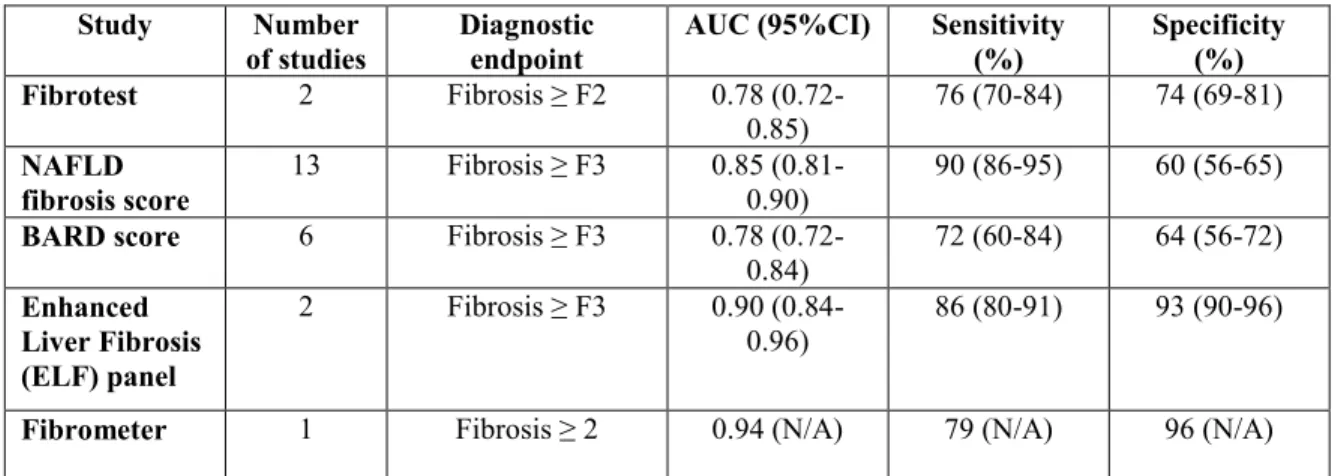
A comprehensive meta-analysis by Musso et al. looked at a total of 21 non-invasive biomarker panels to identify their characteristics and diagnostic performances. Five panels were found to detect the presence of advanced fibrosis in patients with NAFLD, including BARD score, Fibrotest, enhanced liver fibrosis (ELF) panel, combined panel, and NAFLD fibrosis score. Of these five biomarker panels, Fibrotest, ELF panel, combined panel, and NAFLD fibrosis score all demonstrated increased diagnostic accuracy when compared with BARD score with test accuracy (AUROC) ranging from 0.80 to 0.90.(9) When comparing the remaining four biomarker panels for the detection of advanced fibrosis, only the NAFLD fibrosis score has been most extensively validated. Fibrotest, ELF, and combined panel are limited by lack of external validation besides the original study so their reproducibility in different population remains unknown.(9)
34 The NAFLD fibrosis score consists of seven routinely measured clinical and biochemical parameters including age of the patient, BMI, presence of diabetes, AST, ALT< platelets, and albumin. With these parameters on hand, the clinician can then predict either high or low probability that the patient has advanced fibrosis. A meta-analysis of 13 studies and 3604 participants demonstrated that the NAFLD fibrosis score has an AUROC of 0.85 (0.81-0.90).(9) The major limitation of the NAFLD fibrosis score, however, is that a large percentage of patients fall between the cutoffs for low or high probability of advanced fibrosis, and therefore are indeterminate for fibrosis. The same meta-analysis demonstrated that 20% to 58% of patients have indeterminate results using the NAFLD fibrosis score.(9) These patients would therefore require alternative methods of fibrosis detection.
Unlike for the detection of advanced fibrosis, biomarker panels for the detection of NASH is comparatively lacking at present. For the detection of NASH, six major biomarker panels have been studied. They include NASH Test, NASH Predictive Index, Obesity-related NASH Diagnostics, NASH Clinical Score, NAFIC score, and Plasma ELISA-detected cytokeratin-18 (CK-18).(9) Of these six biomarker panels, only the cytokeratin-18 has been externally validated from their original studies. In fact, cytokeratin-18 was validated in nine independent studies comprising of 856 NAFLD patients. Furthermore, the largest study on cytokeratin-18 fragments by the NASH Clinical Research Network (CRN) demonstrated that other routinely available parameters did not significantly improve its diagnostic accuracy.(80) Thus, the Plasma ELISA-detected cytokeratin-18 test comprises of detecting only one marker, the cytokeratin-18 fragment, which is released in the setting of hepatocyte apoptosis. A meta-analysis of cytokeratin-18 has found that the AUROC for this exam to be 0.82 for the detection of NASH in patients with NAFLD.(9)
While invasive biomarker panels comprise an exciting component of upcoming non-invasive assessment for NAFLD, they are limited by one important limitation. Thus far, all biomarker panels have been validated in cross-sectional studies. As a result, little is known of their diagnostic performance in monitoring disease progression and treatment response.(9)
Table 2.1 summarizes the diagnostic performances for the most well-studied serum
35
Table 2.1: Diagnostic performances of serum biomarkers for liver fibrosis Study Number
of studies Diagnostic endpoint AUC (95%CI) Sensitivity (%) Specificity (%) Fibrotest 2 Fibrosis ≥ F2 0.78
(0.72-0.85) 76 (70-84) 74 (69-81)
NAFLD
fibrosis score 13 Fibrosis ≥ F3 0.85 (0.81-0.90) 90 (86-95) 60 (56-65)
BARD score 6 Fibrosis ≥ F3 0.78
(0.72-0.84) 72 (60-84) 64 (56-72) Enhanced Liver Fibrosis (ELF) panel 2 Fibrosis ≥ F3 0.90 (0.84-0.96) 86 (80-91) 93 (90-96)
Fibrometer 1 Fibrosis ≥ 2 0.94 (N/A) 79 (N/A) 96 (N/A) Adapted from: Musso G, Gambino R, Cassader M, Pagano G. Meta-analysis: natural history of non-alcoholic fatty liver disease (NAFLD) and diagnostic accuracy of non-invasive tests for liver disease severity. Annals of medicine. 2011;43(8):617-49.
2.4.2 Imaging-based methods
Imaging-based methods make up the other large part of current non-invasive examinations for NAFLD. The preeminent and most studied imaging modalities will be highlighted in this section. Table 2.2 summarizes the main advantages and disadvantages of the imaging-based methods discussed below.
2.4.2.1 Conventional ultrasound
Conventional ultrasound represents the most common and readily available modality in current institutions. It has been largely recognized in the qualitative assessment of hepatic steatosis. A fatty liver appears hyperechoic or brighter than surrounding structures due to the increased scatter and attenuation of fat-filled vesicles.(81) In one of the largest meta-analyses looking at the diagnostic performance of detecting simple steatosis using conventional ultrasound when compared to liver biopsy, the mean sensitivity ranged from 73 to 91%.(82) Differences in sensitivity depended largely on the presence of mild or severe steatosis, accounting for the fact that severe steatosis is significantly easier to detect than mild steatosis.
While conventional ultrasound offers the advantage of being common, readily available, and cheap, it also presents significant limitations. Detection of steatosis becomes increasingly difficult in the presence of co-existing fibrosis or inflammation. It is unable to differentiate
36 between simple steatosis, NASH or fibrosis.(83) Furthermore, conventional ultrasound also suffers from significant inter- and intra-observer reliability differences.(84)
2.4.2.2 Transient elastography
Transient elastography (TE) is an ultrasound-based vibration controlled technique that is currently the most validated and commonly used elastography technique globally.(85, 86) This technique involves the generation and velocity measurement of a low-amplitude shear wave within a region of interest in the liver. The measured wave velocity is then converted into measurements of liver stiffness.(87) TE has proven to be excellent for diagnosing advanced fibrosis (stages 3 and 4). A previous meta-analysis demonstrated a pooled AUROC of 0.94 with a sensitivity of 94% and specificity of 95% for detecting advanced (stage 3 and over) fibrosis.(9) Another more recent meta-analysis found that TE was good at diagnosing stage 3 fibrosis (sensitivity of 85%, specificity of 82%) and excellent at diagnosing stage 4 fibrosis (sensitivity of 92%, specificity of 92%).(88) However, concerns regarding the diagnostic accuracy of TE are raised when detecting lower stage fibrosis. In the same meta-analysis, it was found that TE only has moderate accuracy for diagnosing stage 2 fibrosis (sensitivity of 79%, specificity of 75%).(88)
Major obstacles to the successful implementation of transient elastography clinically are its rate of failure and associated unreliable results. These are most commonly as a result of obesity and operator inexperience.(89) Other cited reasons for unreliable results include recent food ingestion, ascites and heart failure. A recent study by Cassinotto demonstrated failure rate of 14.4%. Furthermore, it was found that 8.9% of cases had unreliable results.(90) To address these limitations, newer XL probes have been developed to be used in obese patients. These probes are able to assess deeper regions of interest by emitting lower central US frequencies, thus better overcoming the challenges posed by excess subcutaneous fat. Initial study of the XL probe proves optimistic, although somewhat muted results when compared to a non-obese cohort. Wong et al. demonstrated sensitivity and specificity of 78% for the detection of stage 3 or higher fibrosis in obese patients using the XL probe. The underlying caveat is that cutoff rates are different for the XL probe versus the regular probe.(91)
37
2.4.2.3 Acoustic radiation force impulse imaging
Acoustic radiation force impulse imaging (ARFI) comprises an alternative method of assessing liver fibrosis. In ARFI imaging, small short-duration acoustic impulses are generated in regions of interest, which cause mechanical excitation and shear wave propagation. Based on shear wave propagation velocity as picked up by the US machine, information of liver stiffness can be inferred. Similar to transient elastography, ARFI imaging can be readily available in a clinical setting with immediately available test results to facilitate workflow.(92) Furthermore, an advantage of the ARFI technology is that it can be implemented in a conventional US machine without the need for a separate Fibroscan. Therefore, to avoid multiple different studies, patients who need simultaneous conventional ultrasound evaluation for ascites or hepatocellular carcinoma screening would be more easily assessed with ARFI than transient elastography.(92)
In terms of diagnostic accuracy, the most recent study by Cassinotto et al. found that ARFI imaging performed on-par with transient elastography for the detection of stage 3 and stage 4 fibrosis.(90) Similar results were demonstrated in previous studies.(88, 93) Furthermore, failure rates were found to be lower for ARFI imaging than transient elastography. Cassinotto et al. demonstrated failures rates of only 0.7%.(90) That being said, ARFI imaging is similarly limited by unreliable results in obese patients as in transient elastography. Compared to studies using transient elastography and XL probes, studies using ARFI imaging have similar or higher unreliable rates.(94, 95) In summary, ARFI imaging proves an alternative to transient elastography. That being said, the literature on ARFI imaging is more scant than on transient elastography and more investigation in NAFLD patients is needed.
38 Magnetic resonance elastography (MRE) is a comprehensive method of assessing for liver fibrosis in patients with NAFLD. It uses a modified phase-contrast technique for imaging the propagation of shear waves in the liver. In general, MRE comprises an excellent ability in detecting significant (stage 3 and higher) fibrosis.(92) A recent systematic review of nine studies calculated a mean AUROC for detecting ≥ stage 3 of 0.90 and for detecting stage 4 of 0.91.(96) In another prospective evaluation, MRE was found to have an AUROC of 0.924 for discriminating advanced fibrosis (stage 3 and 4) from milder fibrosis (stage 0 to 2).(97) Finally in a separate meta-analysis, MRE was found to have a sensitivity of 92% and a specificity of 96% of distinguishing advanced fibrosis (stage 3 and 4) from milder fibrosis (stage 1-2).(98) These studies chose this specific discrimination (advanced vs. mild fibrosis) due to clinical relevancy. Patients with advanced fibrosis are specifically the ones that have the greatest risk of disease progression.
There is appeal of MRE over such imaging methods as transient elastography and ARFI imaging. At face value, it is less operator-dependent and more elegant of a modality. Furthermore, recent comparison of MRE and transient elastography for the staging of liver fibrosis demonstrated that MRE was significantly more accurate for detecting liver fibrosis stage ≥ 2 and stage 4.(99) Despite these optimistic results, further large-scale prospective trials are recommended to compare MRE from US-based elastography in NAFLD.(92) Current studies are limited by small populations. When it comes to MRE, there are also limitations in terms of costs, increased time-consumption and lack of broad availability.(9) These limitations makes MRE less appealing for routine screening purposes for NAFLD patients in clinical practice. On the other hand, its high sensitivity and specificity opens the doors to the potential of using MRE as a confirmation tool for when ultrasound-based elastography fails or when more detailed imaging is necessary.(92)
Table 2.2: Summary of noninvasive imaging modalities for NAFLD
Imaging Advantages Disadvantages
US Ready availability Low cost
Only qualitative assessment of steatosis
39 Provides evaluation of liver architecture Limited by inter- and
intraobserver variability TE Short processing time (<10 minutes)
Ambulatory clinical setting Immediate results
Limited reliability in obese individuals
False positives (ascites, congestion)
ARFI Readily available Immediate results Failure rates less than TE
Allows for simultaneous sonographic imaging of the liver
Failed or unreliable measurements
Does not allow for quantification or assessment of steatosis
MRE Can be accomplished in ~20 minutes No additional hardware needed No contrast
Not affected by obesity
Simulatenous MRI for liver architecture and carcinoma screening
Requires MRI facility
Results not specific to NAFLD patients
Cannot distinguish between inflammation and fibrosis Cannot be used in some patients
with implantable devices Adapted from: Hannah WN, Jr., Harrison SA. Noninvasive imaging methods to determine severity of nonalcoholic fatty liver disease and nonalcoholic steatohepatitis. Hepatology. 2016;64(6):2234-43.
2.4.3 Liver biopsy
Liver biopsy represents the gold standard in the diagnosis of NAFLD. The unmatched sensitivity and specificity of histological assessment makes it a cornerstone for the evaluation of chronic liver disease. However, by definition, liver biopsy is an invasive procedure, which carries with it real consequences. As a result, both physicians and patients may find it difficult to carry out a biopsy, especially in light of advancing alternative noninvasive methods as outlined in the previous section. (100)
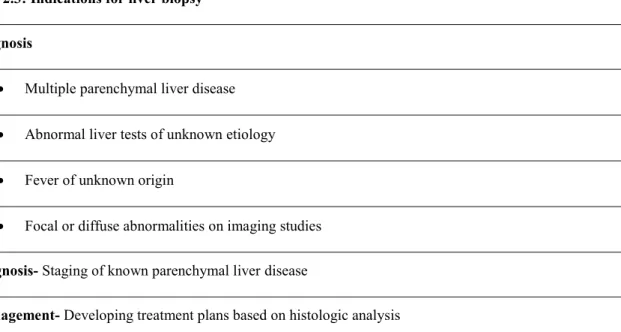
40 From a historical point of view, liver biopsy was used almost entirely as a diagnostic tool. However, with better understanding of natural history of liver diseases as well as new therapies for patients, nowadays, it has become important in clinical management as well. The three recognized roles for liver biopsy include 1) diagnosis, 2) disease staging for prognosis, and 3) in assisting therapeutic decision making. (100) Table 2.3 summarizes the current-day indications for liver biopsy.
Table 2.3: Indications for liver biopsy Diagnosis
Multiple parenchymal liver disease Abnormal liver tests of unknown etiology Fever of unknown origin
Focal or diffuse abnormalities on imaging studies
Prognosis- Staging of known parenchymal liver disease
Management- Developing treatment plans based on histologic analysis
Adapted from: Rockey DC, Caldwell SH, Goodman ZD, Nelson RC, Smith AD, American Association for the Study of Liver D. Liver biopsy. Hepatology. 2009;49(3):1017-44.
Despite its universal acceptance and role in current clinical management of chronic liver disease, liver biopsy is not without its faults. Liver biopsy is associated with estimated major complication risks in 1-3% of cases, including the possibility of death in 0.01%. (101) In a separate Canadian study looking at 4275 biopsies over 10 years, liver biopsy was found to have an overall mortality rate of 0.14%. Other complications included pain requiring admission in 0.51% and bleeding in 0.35%. These complications were associated with a median cost of $ 4,579 (CAD). (102) For these reasons, liver biopsy is known to cause significant patient anxiety. (100)
41 Depending on the technique for procuring the biopsy specimen, there are errors related to sample location and sample size. The average liver biopsy specimen will typically only yield 0.05 cm3 of an organ that ranges from 800 to 1000 cm3. This corresponds to less than 1:50,000 ratio of the total volume. (101) As a result, liver biopsy has been shown to incorrectly exclude NASH in up to ¼ of cases and misclassify fibrosis stage in 1/3 of cases. (103)
In summary, liver biopsy remains the reference standard for the diagnosis of liver disease. Given the underlying risks, discussions of benefit and risk should be undertaken between physician and patient before this invasive procedure. With the advance of multiple noninvasive modalities, liver biopsy may not be the most effective diagnostic measure, for example, in the context of screening for NAFLD.
2.5 Management of NAFLD
Currently, there is widespread agreement that all patients with NAFLD should undergo lifestyle intervention in order to control metabolic risk factors such as central obesity and high fasting blood sugar. These changes include the promotion of weight loss, dietary plans, and increased physical exercise. All guidelines promote lifestyle changes as the first-line treatment for all NAFLD patients. (78)
2.5.1 Lifestyle changes
Given the significant association between central obesity and NAFLD, weight loss comprises a major part of the lifestyle intervention for patients. The exact amount of weight loss differs according to guidelines, due to a paucity of specific data related to weight loss in NAFLD. The European Association for the Study of the Liver recommends a weight loss of 7% in overweight and mildly obese patients. The American societies recommend at least 3-5% weight loss to improve steatosis and up to 10% to improve inflammation. (78)
The American recommendations were primarily based on a randomized controlled trial of 31 obese patients with NASH that looked at liver histology improvements from intensive
42 lifestyle changes versus basic education alone. (104) Intensive lifestyle changes were defined as a plan consisting of diet, behavior modification and 200 minutes/week of moderate physical activity for 48 weeks. The authors found that intensive lifestyle changes led to a weight loss of 9.3% versus 0.2% in the basic education arm. Furthermore, there was significant improvement in steatosis, necrosis and inflammation on post-treatment biopsies. Importantly, no improvement in liver fibrosis was found in the either treatment arm. (104)
In terms of alimentation, all guidelines currently recommend avoidance of heavy alcohol consumption in NAFLD patients. (78) Similarly, all societies recommend a hypocaloric diet for the promotion of weight loss. The diet should be low in carbohydrate and saturated fats with specific avoidance of fructose-enriched drinks. Diets rich in fiber, anti-oxidant rich fruits and vegetables are recommended. (78)
Finally all guidelines strongly recommend implementation of a physical exercise regime. (78) Such exercise regimes should comprise of at least 150 min per week of moderate-intensity physical activity. These regimes are based on MR spectroscopy studies looking at the effect of exercise alone without diet modification. In these studies, exercise regimens typically involved 2-3 sessions per week of 30-60 minutes physical activity over 6 to 12 weeks. These studies demonstrated significantly decreased liver fat content without change to overall weight. (105-107)
2.5.2 Pharmacologic therapy
Currently, pharmacologic therapy is recommended to be used only in cases of biopsy-proven NASH. (78) There are two large classes of medications that have been tested in the treatment of NAFLD. They include insulin sensitizing agents such as metformin and thiazolidinediones, and antioxidants such as vitamin E. Other miscellaneous agents such as ursodeoxycholic acid (UDCA) and Omega-3 fatty acids have also been studied.
43 Metformin was one of the first agents studied in the treatment of patients with NASH. The earliest studies looking at the effect of metformin on liver enzymes and liver histology in NASH patients demonstrated decrease in insulin resistance and liver aminotransferases. However, they did not demonstrate any significant improvement in liver histology, namely inflammation. (108, 109) Later studies also supported this finding with no significant improvement of metformin on liver histology. (110) Furthermore, other studies failed to demonstrate major improvements on insulin resistance or aminotransferase levels. (111) A definitive randomized control trial of metformin versus placebo by Haukeland et al. concluded no significant difference between the two branches. (112) Given these findings, metformin is not recommended as a treatment for patients with NASH. (5)
In contrast to metformin, thiazolidinediones have demonstrated more positive results in the treatment of NASH. Thiazolidinediones, which consist of pioglitazone and rosiglitazone, are a specific class of drugs that promotes adipogenesis and fatty acid uptake peripherally. While randomized controlled trials involving rosiglitazone have been met with mixed results, pioglitazone has proven to be effective in the treatment of steatohepatitis. (5) In a randomized controlled trial of patients with NASH given 45 mg/day of pioglitazone versus placebo, it was demonstrated that there was significantly improved aminotransferases, histologic steatosis, ballooning and inflammation. There was improvement of inflammation in 73% of patients treated with pioglitazone versus 24% in the placebo-treated arm. (113) Another randomized controlled trial demonstrated significant improvement of hepatocellular injury and fibrosis. (114) The large PIVENS study also found that significantly higher number of patients treated with pioglitazone demonstrated resolution of NASH versus those treated with placebo. (115) These findings were repeated in a recent meta-analysis of five randomized controlled trials, which concluded significant improvement on steatosis and inflammation with pioglitazone. (33) Given the literature, pioglitazone is currently recommended in the treatment of biopsy-proven NASH by both American and European guidelines. (78)
There are a few potential drawbacks associated with the use of pioglitazone. Firstly, it has no proven effect on histologic liver fibrosis. (33) Secondly, there is currently controversy surrounding possible long-term safety effects associated with thiazolidinedione use. These safety hazards include increased risk of cardiovascular disease, congestive heart failure,