The French Pensions Projections for EPC-AWG
Pensions scheme, model and results
The Ageing Working Group (AWG) of the Economic Policy Committee (EPC) carries out a long-term
budgetary projection exercise that includes projections of pensions. It will be used for the long-term
sustainability assessment in the context of Stability and Convergence Programmes. The French Treasury
(DG Trésor) was in charge of providing the results of the projections for France.
In the following document, we describe the key characteristics of the French pension system, summarize
the main assumptions and present the major results of the projections. Details on the projection
methodology are also provided.
The assumptions underlying the projections were agreed by the EPC and the AWG. A baseline scenario
and eight sensitivity tests were defined, regarding demographic and macroeconomic assumptions.
The French Treasury has worked together with the Secretariat of the Conseil d’Orientation des Retraites
(COR, institution that coordinates pension projections in France) and the CNAVTS, the basic scheme of
the private sector. The projections under the specific AWG assumptions have been carried out with an
aggregate model of the French pension system usually used by the COR for the national projection
exercises in order to ensure consistency between European and national projections.
As commonly agreed, the projections are built on legislation and rules as of September 2011. Thus, the
projections include the effects of the last reforms of the French pension system, especially the 2010
pension reform.
Between 2010 and 2060, public pensions would grow by about ½ point of GDP (from 14.6% in 2010 to
15.1% in 2060). This stems mainly from demographic assumptions, whose effects are partly offset by a
decline in the benefit ratio and in the coverage ratio.
Overall, the long-run increase in the pensions/GDP ratio is 0.1 point lower than what was projected in
the 2009 exercise over 2010-2060 ; moreover, the average annual increase in pensions to GDP stands at
0.075%, compared to 0.081% in the previous projections. The 2010 reform would therefore offset the
negative effect of the economic crisis.
DIRECTION GENERALE DU TRESOR
SERVICE DES POLITIQUES PUBLIQUES
SOUS-DIRECTION DES POLITIQUES SOCIALES ET DE L’EMPLOI BUREAU RETRAITES ET REDISTRIBUTION
AFFAIRE SUIVIE PAR :ANAÏS LE GOUGUEC,MARIE MAGNIEN
I.
Key characteristics of the French pension system
I.1. – Description and key features
The French pension system is essentially a pay-as-you-go system financed by contributions from both workers and employers.
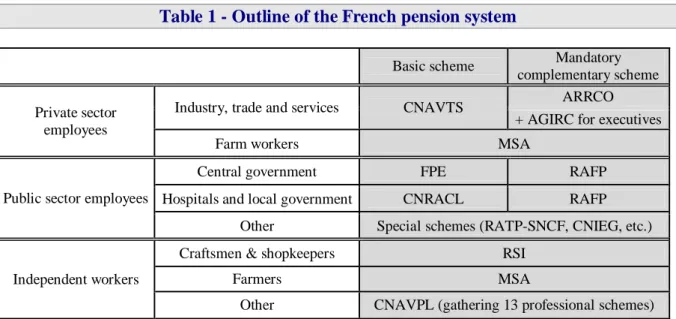
A system made of different schemes
The French pension system is based on several schemes depending on the professional sector or occupational status. These schemes can follow different rules. All workers are affiliated, according to their profession, at the same time to a basic and a mandatory complementary scheme. They may belong to several base schemes during their career: they then become poly-pensioners at retirement.
Table 1 - Outline of the French pension system
Basic scheme Mandatory
complementary scheme Private sector
employees
Industry, trade and services CNAVTS ARRCO
+ AGIRC for executives
Farm workers MSA
Public sector employees
Central government FPE RAFP
Hospitals and local government CNRACL RAFP
Other Special schemes (RATP-SNCF, CNIEG, etc.)
Independent workers
Craftsmen & shopkeepers RSI
Farmers MSA
Other CNAVPL (gathering 13 professional schemes)
In regard to the basic schemes:
The régime général (CNAVTS) is the largest one. It provides basic pensions for all non-farm private sector employees. A scheme with similar rules covers farm workers (MSA).
As regards independent workers, craftsmen and shopkeepers are affiliated to the RSI and farmers to the MSA. Other independents are covered by particular professional schemes (for instance the CNBF for lawyers).
In the public sector, employees are covered by various schemes. Central government (FPE) is directly in charge of civil and military servants. Hospitals and local government employees are affiliated to the CNRACL. We should also add the régimes spéciaux (electricity and gas employees, rail men, minors …).
Complementary schemes come on top of basic schemes. They all are mandatory point systems, most
of the time ruled by social partners. The main schemes are the ARRCO (for all private sector workers) and the AGIRC (for private sector executives). There is also the RAFP for civil servants since 2005, the RSI complementary for craftsmen and shopkeepers, the CNAVPL complementary, etc.
Table 2 - Number of contributors and pensioners of different pension schemes in 2009
(in 1000)
Contributors Pensioners CNAVTS 17 800 11 707 MSA employees 670 1 929 ARRCO 17 900 9 828 AGIRC 3 900 1 993 FPE 2 200 1 698 CNRACL 2 000 788 RAFP 4 700 130 Special schemes 400 328 RSI 1 800 1 474 MSA farmers 520 1 649Note: It is not possible to sum these numbers due to the fact that contributors and pensioners can belong to more than one scheme. On average, one pensioner receives pension from 2 to 3 different schemes.
Source: Annual Survey of the pension schemes 2009, Ancetre model, Drees and Social security accounts2011.
Contribution
Before the 2010 reform, contribution rates to the pension scheme stand at 9.9% of the wage for the employers and 6.75% for the workers in the general scheme, while civil servants’ contribution rate is 7.85% of their gross wage. Non-executive workers contribute to ARRCO on the basis of the part of their wage below three times the Social Security ceiling (34,620 € per year in 2010). Executive employees contribute to both ARRCO (with respect to wage up to the ceiling) and to AGIRC (for wage between 1 and 8 times the ceiling). In 2010, the minimum contractual contribution rate is 6% in ARRCO and 16.24% in AGIRC.
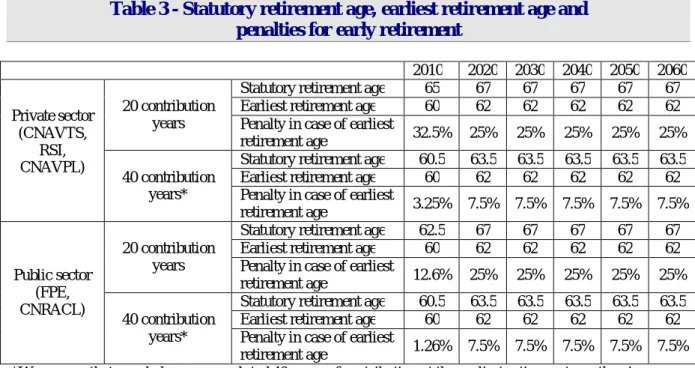
Retirement age
The retirement age depends on the behaviour of new pensioners. It exists a legal / minimum age, but also incentives to retire later. Except some particular cases, people can retire from the legal age (60 years old before the 2010 reform, 62 after), eventually with a penalty if they do not meet the required time (41.5 years for the 1955 generation). They can also delay their retirement in order to obtain the required time to get a full rate pension or to reach the age of 65 (67 after the 2010 reform) (full pension age or statutory age). People can also keep on working after in order to benefit from a bonus on their pension.
Table 3 - Statutory retirement age, earliest retirement age and
penalties for early retirement
2010 2020 2030 2040 2050 2060 Private sector (CNAVTS, RSI, CNAVPL) 20 contribution years
Statutory retirement age 65 67 67 67 67 67
Earliest retirement age 60 62 62 62 62 62
Penalty in case of earliest
retirement age 32.5% 25% 25% 25% 25% 25%
40 contribution years*
Statutory retirement age 60.5 63.5 63.5 63.5 63.5 63.5
Earliest retirement age 60 62 62 62 62 62
Penalty in case of earliest
retirement age 3.25% 7.5% 7.5% 7.5% 7.5% 7.5% Public sector (FPE, CNRACL) 20 contribution years
Statutory retirement age 62.5 67 67 67 67 67
Earliest retirement age 60 62 62 62 62 62
Penalty in case of earliest
retirement age 12.6% 25% 25% 25% 25% 25%
40 contribution years*
Statutory retirement age 60.5 63.5 63.5 63.5 63.5 63.5
Earliest retirement age 60 62 62 62 62 62
Penalty in case of earliest
retirement age 1.26% 7.5% 7.5% 7.5% 7.5% 7.5%
*We assume that people have accumulated 40 years of contribution at the earliest retirement age the given year. NB: we do not distinguish between women and men since they face the same legislation.
There are some exceptions to the legal retirement age. The most important one is dedicated to people who started working young and have validated more than the required time (see detail infra). In the public sector for some special branches, labelled as “active service” (policemen, nurse etc.), the minimum retirement age is 55 years old.
In general, there is no gender difference in the eligibility requirements.
Level of pension
- Rules for calculating pension
The rules to calculate pensions differ from a scheme to another. We detail here only the formula used to calculate the two components of the pension in the private sector (basic pension from the CNAVTS and complementary pension from the AGIRC-ARRCO) and in the public sector.
Basic private sector pensions (CNAVTS and aligned schemes)
In the basic private sector (CNAVTS) and the aligned schemes (RSI and MSA workers), the pension P is calculated according to the following formula:
P = t × Min (1, DT ) × ref. wage Three factors compose that formula:
The reference wage is the SAM (standing for “Salaire Annuel Moyen”), i.e. the average wage over the 25 “best years” (up to a ceiling).
The coefficient of proratisation Min (1,D/T) with D being the contributory period, that is the number of years validated by the insured and T, the reference length. In other words, the pension is reduced in due proportion whenever D < T. For people born in 1950 (who are 60 in 2010), T equals 40.5 years, but this value will increase in line with life expectancy.
The pension rate t. The standard rate is 50%. However, in order to favour senior participation, either a deduction or a premium may be applied under certain conditions:
- A deduction is applied when the pension is withdrawn before the age of 65 (67 after the 2010 reform) and when the contribution length is lower than the reference (D < T). The deduction is then calculated as Min [65 - Age, (T-D)] multiplied by the rate of deduction (5% per year from the 1952 cohort onward).
- Conversely, a premium applies for contributory periods obtained beyond the reference length
and after the age of 60 (62 after the 2010 reform). Hence the premium is calculated as Min [Age-60,
(D-T)] multiplied by the premium rate (5% per year).
The implicit annuity value amounts to 1.23% per year in 2010 (corresponding to a 50% pension rate for 40.5 years of contribution).
There is a minimum earning-related pension for pensioners meeting the requirements for a full-rate pension (named minimum contributif) amounting to 7,147.75 € per year in 2010. It is price-indexed.
Mandatory complementary pension (AGIRC (private sector executives) and
ARRCO (all private sector workers))
Complementary schemes are pay-as-you-go point systems that serve defined contribution pensions. Contributors acquire each year a certain number of points through their own contributions and those of their employer, calculated on the basis of a rate t applied to a bracket of their gross wage. The contribution basis and the contribution rates vary from one scheme to another and according to the wage brackets involved. The purchase price of each point, called “reference wage”, depends on the year considered. In 2010, it is worth 14.4 € in ARRCO and 5.0 € in AGIRC.
Number of points acquired in year t = t × (Gross waget /Purchase price of a pointt)
At retirement, the transformation of accumulated points into pension is a function of contributor's age, contribution length and selling price of a point at that date. Complementary pension is then calculated as follows:
Pension = Total number of points acquired × Value of a point × Shortfall coefficient
“Full rate” in complementary pension schemes is granted to those who qualify for full rate in pension in general scheme. In case one retires before reaching full rate in CNAVTS, the value of a point is adjusted downwards by means of a “shortfall coefficient” (cf. table 4).
Table 4 - Shortfall coefficient applicable to the complementary schemes
Shortfall (quarters) Coefficient 20 0.78 16 0.83 12 0.88 8 0.92 4 0.96
In 2010, the value of a point was 1.2€ in ARRCO and 0.4€ in AGIRC.
Pension in the public service scheme (FPE)
The calculation of the basic pension for public-service workers is very similar to the one in the CNAVTS:
Nevertheless the parameters differ from those of the general scheme in two essential aspects:
The reference wage taken into account is the wage (excluding bonuses) received the last 6 months, as opposed to the average of the best 25 years' wages (including bonuses) in the private sector.
The pension rate t is higher (75%). The 2003 reform introduced also a deduction and a premium rate, similar to that of the private sector.
As in the general scheme, the duration T taken into account in the proratisation coefficient is 40.5 years for people born in 1950 (aged 60 in 2010) and is planned to increase with life expectancy.
The annuity value amounts to 1.85% in 2010, given a pension rate of 75% for a career span of 40.5 years. It is somewhat higher than in the CNAVTS, since public sector pension is essentially made of basic pension. Complementary pension was introduced in 2003 and is only based on bonuses that usually represent around 20% of total wage.
After a minimum period of 15 years of contribution in the public sector, an earning related minimum pension can be guaranteed (named minimum garanti). In 2010, its value was 12,383€ per year for a 40 years career.
- Non-earning related minimum pension
People aged 65 (or 60 in case of incapacity or invalidity) whose revenue (including pension or not) is under a certain ceiling (8,507.5€ a year for a single person and 13,890€ for a couple in 2010) are eligible to a minimum pension, named “minimum vieillesse” that tops their revenue up to this ceiling. Usually, this ceiling is price-indexed. However, an occasional 25% increase occurred between 2007 and 2012. The “minimum vieillesse” amounts to 2.2 billion € in 2009, which represents almost 1% of the total amount of pension expenditures.
- Disability pension
Disability pensions are a replacement income for people under the legal retirement age that are completely or partially, temporarily or permanently, unable to work. These pensions are paid by the public health insurance schemes. When disabled reach the legal retirement age, they become eligible to a full rate pension: they then cease to be included in the disability expenditures and join the old-age expenditures. Therefore, in the present document, “disability pensioners” refer only to people that have not retired yet. The disability pensions are a fraction of a reference wage (the average of the past ten best wages), depending on the disability level as exhibited in the following table. It cannot exceed a maximum nor be inferior to a minimum.
Table 5 - Parameters to work out a disability pension
Disability class
Percentage applied to the reference
wage Minimum level per month Maximum level per month
1st class 30 % 270,69 € 883,80 €
2nd class 50 % 270,69 € 1.473 €
3rd class 50 % + bonus for a third party 270,69 €+ 1.060,16 €= 1.330,85 €
1.473 €+ 1.060,16 €= 2.533,16 €
- Indexation
All pensions, whatever the scheme, are price-indexed1.
- Pension taxation
Pensions are liable to general social contributions (CSG and CRDS) at a 7.1% rate, except for pensioners with low revenues who could benefit from a reduction or an exemption of CSG-CRDS, and to a health contribution rate of 1%. In addition, pensions are subject to income taxation.
I.2. – Recent reforms included in the projections
Up to this year the French pension schemes have known four main reforms: the 1993 reform in the private sector, the 2003, 2008 and 2010 reforms that affect both private and public sectors.
The 1993 reform introduced mainly four changes that reduced the pension level:
- The reference wage is now calculated on the basis of the 25 best years instead of the 10 best; - Past wages included in the reference wage are price-indexed (rather than wage-indexed); - Pensions are price-indexed;
- The reference length has been raised from 37.5 to 40 years in the private sector.
The 2003 reform consisted in several changes:
- It planned to increase semi-automatically the contributory period necessary to draw a full pension in line with life expectancy gains. The aim was to keep constant the ratio between contributory period and average length in retirement at its value of 2003 (1.79)2. In application of that principle, the reference length has increased from 40 years for generation 1948 to 41.5 years for generation 1955 and will continue to increase according to this principle.
- Nevertheless, in order to take into account more fragile workers, it created the possibility for people with long careers to retire early and scheduled an increase of the minimum earning-related pension. The retirement for long carriers concerns people who started to work before 15, 16 and 17 and who have contributed more than the reference contributory period. They are entitled to withdraw their pension at the most 4 years before the legal age. With the legal obligation to study until the age of 16, fewer and fewer people will be eligible to this plan. - Moreover, in order to suppress disincentives to work for older workers, a yearly 3% bonus has
been introduced in all schemes for postponed retirement and penalty for early-retirement gradually decreases from 10% to 5% of pension benefits for private sector workers and introduced for the FPE scheme. The reform also liberalized the conditions to cumulate a pension and a wage and fostered the development of the second and third pillar (occupational and voluntary private savings) through fiscal incentives.
- Another part of the reform consisted in the gradual convergence of the public sector schemes to the private sector. It went through three channels: firstly, an increase of the number of contribution years required for entitlement to a full pension (from 37.5 to 40 years); secondly, the creation of a penalty for early retirement and a premium for postponed retirement converging gradually to the value of these parameters in the CNAVTS; finally, the creation of a complementary scheme (RAFP).
The 2008 “rendez-vous” consisted in three key measures inserted in the 2009 social security budget law:
1
So are the past wages included in the reference wage.
2
Average length in retirement is defined as the life expectancy at age 60 published five years before by the national statistical agency (Insee). Since 2011 (a special commission before), the COR pronounces every year (every 4 years before) a recommendation concerning the reference contributory period that will apply to the concerned generation: everyone is therefore informed at age 55 of the actual reference contributory length that will apply to them.
- The premium for extra years worked after reaching full rate of pension was raised to 5%; - The possibilities of drawing concurrently a pension and a wage were fully liberalized for
people entitled to a full-rate pension;
- Employers were encouraged to reach quantitative targets for senior workers employment and discouraged to use retirement as a substitute for layoff.
The 2010 pension reform included, besides targeted new resources, several measures:
- It introduced a progressive rise of age boundaries. The earliest retirement age will be gradually increased, for all pension schemes, from 60 to 62. Simultaneously, the full rate pension age will rise from 65 to 67. Every generation from generation 1951 to generation 1956 will see these age limits rise by 4 months3. For example, people born in 1956 will be able to claim their pension at age 62 in 2018 and a full rate pension at 67 in 2023. The early retirement age for long careers will also be increased by 2 years. The 2010 reform, so as the 2008 “rendez-vous”, confirmed the planned increase in contributory periods.
- Positive measures dedicated to more fragile workers, partly limit the favourable effect on labour force participation of the pension reform. Indeed, some categories of workers will still be granted a full rate pension at 65 (disabled, mother of 3 children), and people suffering from a professional disease or an accident that resulted in a permanent incapacity of at least 20%4 will still be able to retire at 60 with a full rate pension. The retirement for long carriers is extended to people who started to work before 18 years old; they will able to retire at age 60. - The convergence of pension rules between public and private sectors was strengthened by
closing down two devices previously offered in the public sector: possibility of early retirement for parents with 3 children and a 15 years career and the "Cessation Progressive d'Activité" programme. Rules to compute minimum earning-related pensions and the rate of contribution of civil servant5 will also converge. Finally,
the civil servants’ contribution
rate converges on the private sector’s one.
1.3. – Description of the actual “constant policy” assumption used in the projection
The projections are built on a “constant policy” principle and based on the legislation and rules as of September 2011. The four reforms described above have a gradual impact on participation rates of older workers, the number of pensioners and the average pension. This impact is taken into account in the projections. Notwithstanding, our projections do not include the acceleration of the rise in age boundaries that should be included in the 2012 social security budget law6 and no additional increase of the reference contributory period has been included: it is kept to 41.5 years in the middle/long run. The rates of return of the AGIRC-ARRCO schemes are supposed constant through time.
Regarding minimum pensions, we kept an indexation on prices, accordingly to the law. This is consistent with the treatment of other pensions’ indexation. The recent occasional increase (+25% between 2007 and 2012) has not been assumed to occur again in the future. In the long-run however, this might not be compliant with the policy objective of minimum pensions to preserve from poverty. A policy change could occur in the future, but it is impossible to foresee when and how it will happen. In absence of a general agreement among the group on how to tackle this question, we decided to stick to the law.
3
We do not consider here the acceleration which may be included in the 2012 social security budget law.
4
10% under specific disability conditions.
5
The contribution rate for civil servants will increase from 7.5% to 10.55% in 10 years.
6
The 62 and 67 age boundaries will be reached for generation 1955 instead of generation 1956, in 2017 and 2022, rather than 2018 and 2023. It would entail a further, even though limited, reduction in pension expenditures between 2012 and 2017.
II.
Results of the projection
II.1. – Extent of the coverage of the pensions schemes in the projections
II.1.1. – Types of old-age pensions
The French pension schemes projections cover all pensions from social security system, i.e. all public pensions. Both basic and mandatory complementary schemes have been taken into account. Occupational pensions (with contractual agreements between employers and employees), which have a very low weight in the French pension system, are not covered in the projection. As to private mandatory pensions, they do not exist in France.
The projections cover old-age and early pensions as well as survivors’ pensions, the minimum old-age allowance, called “minimum vieillesse”, and disability pensions paid before the minimum retirement age, even though they are part of health expenditures in the French accounting system. However, the model used cannot set apart the different types of social security pensions; the parting is estimated using data from external sources.
II.1.2 – Pensions schemes
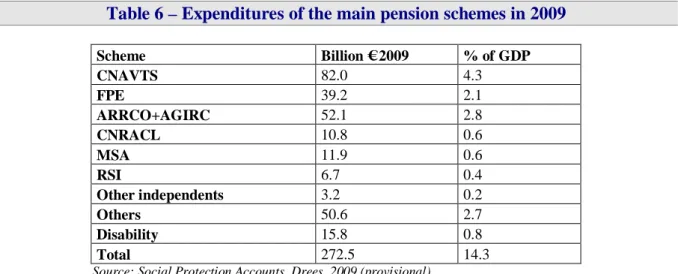
The following table lists the main pension schemes along with the amount of pensions distributed in 2009. There are numerous pensions schemes, which explains the weight of the ‘Others’ item. We provide here only a global projection of pension expenditures, aggregating all mandatory pension schemes for public, private and self-employed workers. No particular assumption is made about the evolution of the respective shares of the different schemes.
Table 6 – Expenditures of the main pension schemes in 2009
Scheme Billion € 2009 % of GDP CNAVTS 82.0 4.3 FPE 39.2 2.1 ARRCO+AGIRC 52.1 2.8 CNRACL 10.8 0.6 MSA 11.9 0.6 RSI 6.7 0.4 Other independents 3.2 0.2 Others 50.6 2.7 Disability 15.8 0.8 Total 272.5 14.3
Source: Social Protection Accounts, Drees, 2009 (provisional).
II.1.3. – Definition of pension expenditure
Compared to Eurostat definition of pension expenditures, we did not include early retirement benefits due to labour market reasons that are recorded in unemployment benefits in French accounting and represent a very limited amount of expenditures.
Table 7 - Eurostat (ESSPROS) vs. Ageing Working Group definition of pension
expenditure (Percentage of GDP)
2000 2001 2002 2003 2004 2005 2006 2007 2008 2009 2010 1 Eurostat total pension expenditures 12.9 12.9 13.0 13.1 13.1 13.2 13.2 13.3 13.6 2 Eurostat public pension expenditures 12.9 12.9 13.0 13.1 13.1 13.2 13.2 13.3 13.6 3 Public pension expenditures (AWG) 12.7 12.7 12.8 12.9 12.9 13.0 13.1 13.2 13.5 14.3 14.6* 4 Difference (2)-(3) 0.3 0.3 0.2 0.2 0.2 0.2 0.1 0.1 0.1
5 Expenditure categories not in the AWG definition: 0,3 0,3 0,2 0,2 0,2 0,1 0,1 0,1 0,1
5.1 Early retirement benefit (labour market reasons) 0,3 0,3 0,2 0,2 0,2 0,1 0,1 0,1 0,1
* Estimated value on the basis of the last observed value (2009). Source: Eurostat and Social Protection Accounts, 2011.
In this exercise, we strictly limited expenditures to pensions. In the previous exercise, the scope was a bit larger since it included the entire oldness-survival budget item, which contained for example APA, a care allowance dedicated to dependant people which is actually already taken into account in the long-term care projections. Conversely, we now take into account disability pensions paid before the legal retirement age, which was not done in the previous exercise. We get a more precise scope but with a close-to-neutral effect on the level of expenditures.
II.1.3. – Definition of pension contributions
As regards the financing of old age pensions, we have only projected here the contributions strictly speaking (i.e. collected on labour income), in order to fit the definition given by the AWG. However, it has to be noted that it is only a part of the global resources available. For old age pensions, it represents around 85% of the global resources available in 2010; the remaining 15% is collected through earmarked taxes, the FSV financial fund and taxes based on all the other types of revenue (capital, replacement revenue…). For disability pensions, contributions represent around half of the resources.
In the previous 2009 exercise, the largest definition of resources was taken into account. The effective financing gap faced by the pension system cannot be deduced by the mere discrepancy between contributions and pensions projections.
II. 2. – Overview of projection results
The projections are based on three inputs. The first one is the AWG demographic and macroeconomic scenario. The second one is an aggregated model of the French pension system run by the Secretariat Général of the Conseil d’Orientation des Retraites (COR), adjusted to fit the specific AWG framework. Finally the third one is a projection of disability pensions, obtained with an ad hoc model. More details on the projections process and methods are given in part III.
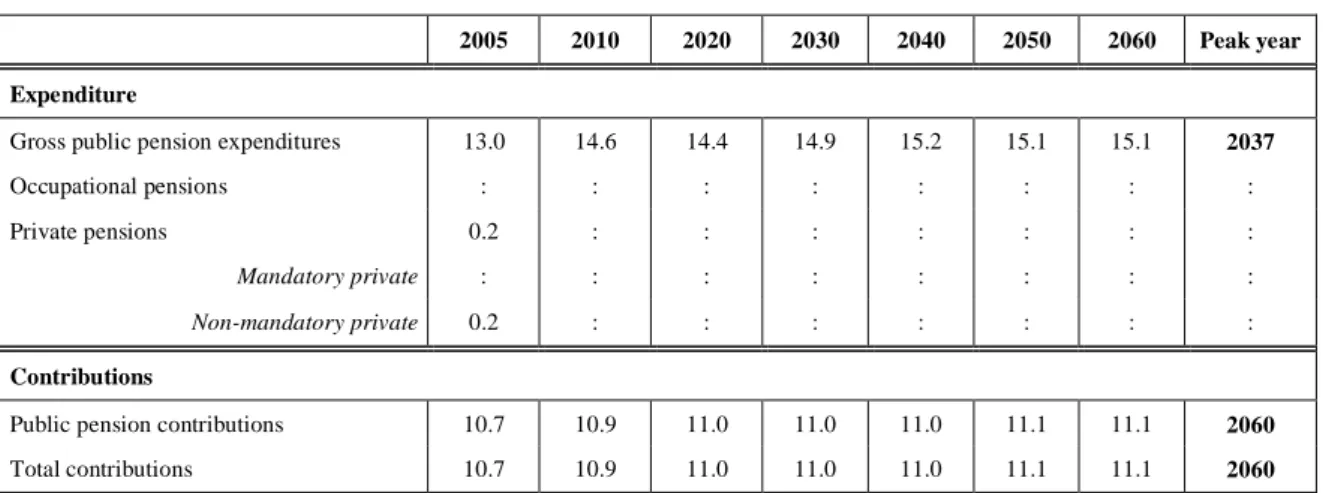
Gross public pension spending is predicted to increase from 14.6% of GDP in 2010 to 15.1 in 2060, and peak in 2037 at 15.2% GDP, which represents an overall rise of ½ GDP point over the whole 2010-2060 period. Focusing on old-age and survivors’ pension spending, it would grow from 13.7% of GDP in 2010 to 14.4% of GDP in 2037 and then decrease to 14.2% of GDP in 2060.
Table 8 - Projected gross and net pension spending and contributions (% of GDP)
2005 2010 2020 2030 2040 2050 2060 Peak year
Expenditure
Gross public pension expenditures 13.0 14.6 14.4 14.9 15.2 15.1 15.1 2037
Occupational pensions : : : : : : : :
Private pensions 0.2 : : : : : : :
Mandatory private : : : : : : : :
Non-mandatory private 0.2 : : : : : : :
Contributions
Public pension contributions 10.7 10.9 11.0 11.0 11.0 11.1 11.1 2060
Total contributions 10.7 10.9 11.0 11.0 11.0 11.1 11.1 2060
It is possible to give an insight of the weight of the different type of pension in the total public pension spending, assuming the repartition between old-age and early on the one hand and survivors’ pensions on the other hand remains constant over time (Table 9). Old-age and early pensions (including disability pensions paid to people aged more than the legal retirement) cannot be separated.
Table 9 - Projected gross public pension spending by type (% of GDP)
2005 2010 2020 2030 2040 2050 2060 Peak year Total public pensions 13.0 14.6 14.4 14.9 15.2 15.1 15.1 2037
of which
Old age and early pensions 10.4 11.8 11.6 12.1 12.4 12.3 12.3 2037 Disability pensions* 0.8 0.8 0.9 0.9 0.8 0.8 0.9 2018 Others (survivors) 1.8 1.9 1.9 1.9 2.0 2.0 2.0 2037
* Paid to people aged less than retirement age
Concerning the evolution of the ratio between projected pension expenditures and GDP, four periods may be identified (see graph 1):
Phase 1: Up to 2011, pension expenditures are expected to grow since the economic crisis effect on GDP contributes to undermine heavily the ratio.
Phase 2: The 2010 Pension Reform effect starts to be perceivable starting from 2012, and keeps on intensifying until the 2020’s when the new legislation stabilizes: people are progressively compelled to retire later. It entails a reduction in the number of pensioners which decreases pension expenditures.
Phase 3: From 2020 to mid 2030’s, pension expenditures increase on average by 0.3 point of GDP per year. The peak is reached in 2037 at 15.2% of GDP. Indeed, retirement decision is not much impacted by the reform during this phase: the new age boundaries apply and people would have retire later than 62 year old even without the reform because we project that people will enter the labour market later and later and will face more fragmented careers. Nevertheless, the ageing process still weighs down pension expenditure.
Phase 4: Pension expenditures are expected to decline over 2038-2060 (by 0.03 point of GDP per year on average), to reach 15.1% of GDP in 2060 thanks to the dynamic of the active population.
Graph 1 - Projected pension expenditures (% of GDP)
II.3.
–
Description of main driving forces behind the projection results
In order to identify more clearly the driving forces behind the projection results, the pensions to GDP ratio is split into 6 factors:
sidual tensity labour Ratio Benefit Rate Employment Ratio Coverage Ratio Dependency
d
HoursWorke
d
HoursWorke
d
HoursWorke
ple
WorkingPeo
d
HoursWorke
GDP
Pension
Average
People
Working
Population
Population
Pensioners
of
Number
Population
Population
GDP
Exp
Pension
Re in / 1 / 174
15
54
15
54
15
64
20
74
15
64
20
64
20
65
64
20
65
.
Graph 2 – Evolution of the main driving forces behind the projection results
The demographic dependency ratio (population 65+/population 20-64) notably increases up to around 2040, being widely responsible for the deterioration of the pension to GDP ratio, particularly during phase 3.
The coverage ratio (pensioners/population 65+) regularly decreases until 2040 and then stabilizes to end up at 77% of its original value. This is linked to the increase in age boundaries to retire planned by the 2010 Pension Reform, but also to the increase in the number of required quarters to reach full rate pension which, associated with an increase in the age of labour market entry and more discontinuous careers, leads to a postponement of the retirement age. The premium on continued work participates also in this movement.
The benefit ratio (average pension/GDP per hour worked by the 15-74 population) declines all along the period, to reach in 2060 a level which is almost 20% lower than the current level. The reduction of the benefit ratio expresses the difference between the evolution of the average pension and that of the average wage per worker. The average pension evolves mostly in line with the inflation rate because pensions are price-indexed and the calculation of the first pension is based on an average of past wages updated with inflation. In the meantime, average wage per worker roughly evolves with labour productivity or GDP per worker. Thus, the decrease of the benefit ratio, in the French case, comes mainly from the wage growing rate being more dynamic than the pension’s one.
Because of the rise in participation rates, partly due to the 2010 pension reform, the employment ratio (working people 20-64/population 20-64) slightly increases from 2010 to 2035, and then remains more or less constant.
The labour intensity (hours worked by the 15-54 population/working people 20-64) and the residual (hours worked by the 15-54/ hours worked by the 15-74) remain quite stable along the whole period.
0 20 40 60 80 100 120 140 160 180 200 2010 2020 2030 2040 2050 2060
Dependency ratio Coverage ratio
Employment ratio Benefit ratio
Labour intensity Residual
Basis 100
Table 10 presents, ceteris paribus, the impact of each of the factors considered on the evolution of pension expenditures. The effect of the dependency ratio is the most powerful one, though it is stronger in the first part of the studied period and declines over time. The two principal forces bringing down the pension expenditures to GDP ratio appear to be the coverage ratio and the benefit ratios.
Table 10 - Factors behind the change in public pension expenditures
between 2010 and 2060 (in percentage points of GDP)
2010-20 2020-30 2030-40 2040-50 2050-60 2010-60 Average annual change Public pensions to GDP -0.19 0.50 0.33 -0.07 -0.04 0.54 0.02
Dependency ratio effect 3.86 2.73 1.84 0.37 0.36 9.15 0.17
Coverage ratio effect -2.01 -0.80 -0.66 0.04 -0.10 -3.53 -0.07
Employment ratio effect -0.77 -0.36 -0.11 0.04 -0.03 -1.23 -0.03
Benefit ratio effect -0.90 -0.77 -0.64 -0.51 -0.26 -3.08 -0.05
Labour intensity effect 0.01 0.00 -0.01 -0.01 -0.01 -0.01 0.00
Residual -0.39 -0.29 -0.09 0.00 0.00 -0.76 -0.01
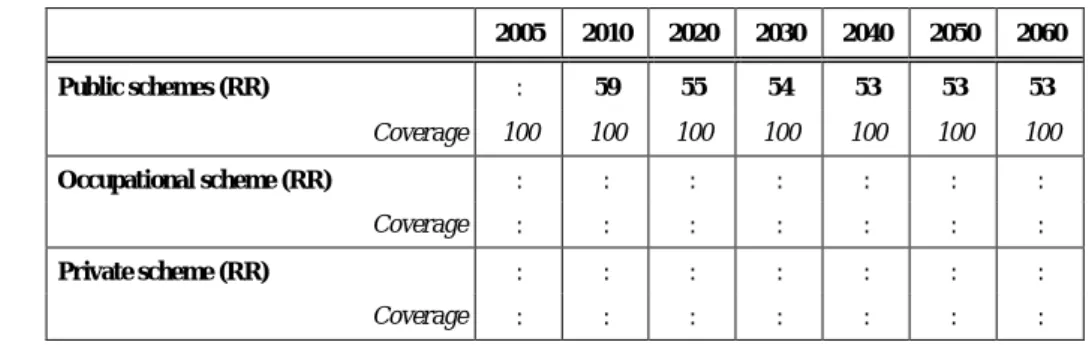
Gross replacement rate at retirement (calculated on people still employed when they retire and excluding disability pensions) is estimated in Table 11. It is averaged over all careers and all schemes; it is therefore smaller than the replacement rate exhibited in the ISG report on theoretical replacement rates that are calculated for an entire career of a private sector employee paid at the average wage. The gross replacement rate at retirement is expected to decrease continuously between 2010 and 2040 and stabilize afterwards. This steams from several factors: the rise in the reference length necessary to draw a full pension (only taken into account until the 20’s), the rule used to discount past wages entering into the pension formula in interaction with an increase in the age of labour market entry and more discontinuous careers, the development of polypension that can imply smaller pensions because of the specific rules applied in this situation, etc.
Table 11 - Replacement rate at retirement (RR) and coverage by pension scheme (in %)
2005 2010 2020 2030 2040 2050 2060 Public schemes (RR) : 59 55 54 53 53 53 Coverage 100 100 100 100 100 100 100 Occupational scheme (RR) : : : : : : : Coverage : : : : : : : Private scheme (RR) : : : : : : : Coverage : : : : : : :
Concerning the respective evolution of pensioners and contributors, the main results are presented in Table 12. Several comments should be made about those results.
First of all, there are two reasons why the number of pensioners is higher than the number of people aged of 65 and older: a part of pensioners are younger than 65 (if only all the disability pensioners), and, moreover, everyone receiving a pension is counted as a pensioner, which means that pensioners living abroad are included, while the demographic projections are limited to the French territory.
The ratio of pensioners to population over 65 decreases quite steadily in the 2010-2020 period. This is linked to the current and previous reforms, but also to a structural effect. Indeed, the numerator corresponds to retirees and disabled persons (20% of which being people under 65) while the denominator corresponds only to people above 65. Currently, the baby boomers (aged now between 50 and 65) are only counted in the numerator, pushing up this ratio. With time, they are going to be all counted both in the numerator and denominator, pushing the ratio down.
The number of contributors is precisely defined as the number of working people; therefore the ratio is always equal to 1.
The support ratio declines over time, despite the coverage ratio decrease and the employment dynamic. However, after the 2030’s its evolution tends to be quite flat, the baby-boom effect on demography ceasing to prevail and the dynamic birth rate starting to impact labour supply.
Table 12 - Number of pensioners and contributors in the public schemes (in 1000),
population over 65 and total employment (in 1000) and related ratios (%)
2005 2010 2020 2030 2040 2050 2060
Number of pensioners (I) 14 355 16 152 17 819 20 060 21 558 22 312 22 769
Number of people aged 65+ (II) 9 970 10 842 13 815 16 458 18 486 19 081 19 605
Ratio of (I) and (II) 1.44 1.49 1.29 1.22 1.17 1.17 1.16
Number of contributors (III) 26 184 26 972 28 351 29 232 29 403 29 533 29 697
Employment (IV) 26 184 26 972 28 351 29 232 29 403 29 533 29 697
Ratio of (III) and (IV) 1 1 1 1 1 1 1
Support ratio (Ratio of (III) and (I)) 1.8 1.7 1.6 1.5 1.4 1.3 1.3
As regards age decomposition, estimation can be provided in Table 13 using data from external sources. A focus on female pensioners (with a quite comparable profile) can also be found in Table 14.
Firstly, before 60 years old the ratio to inactive population is largely below 100% because they are few possibilities to retire before 60. Conversely, this ratio is generally above 100% after 60 years old for two reasons: first, inactive population is estimated on the French territory while pensioners living abroad are still included in the projection; second, pensioners can also work, and therefore some of them are not counted as inactive.
Secondly, the share of pensioners (including disabled people) among inactive people will have different dynamics:
- among the 55-59 age group it is expected to increase during the 2010-2020 period and then stabilize around 40%. Two forces are at stake in the short-run: on the one hand, the increase in requirements to draw an early pension (from generation 1960 onward, minimum legal age for early retirement will be 58 or 60 years old, depending on the contribution length) pushes the number of pensioners down; on the other hand, the number of disabled, depending on the dynamic of the whole population, and not only the inactive people, increases under the pressure of the last cohorts of baby-boomers, which pushes up the number of pensioners. Moreover, the 2010 pension reform is expected to have an important impact on the participation rate in this age group, which decreases the denominator and emphasises this last effect. As a whole the ratio increases. After 2020, the reform effects vanish and the ratio stabilizes.
-
The share of pensioners among the inactive in the age group 60-64 would sharply decrease between 2010 and 2020 as a result of the 2010 pension reform. Indeed in 2020, the legal agewill be 62 instead of 60 in 2010. People aged 60 and 61 (which represent 40% of the considered cohorts) will almost all be prevented from retiring (except for early retirees but under strict conditions on the career length). This effect would be partly offset because the disabled persons would still perceive a disability pension until they are eligible to an old-age pension.
Table 13 - Pensioners (all schemes) to inactive population ratio by age group (%)
2005 2010 2020 2030 2040 2050 2060 Age group -54 : 4 4 4 4 4 4 Age group 55-59 : 29 36 40 40 39 39 Age group 60-64 : 104 76 78 69 69 69 Age group 65-69 : 109 106 105 100 99 98 Age group 70-74 : 110 109 110 108 107 107 Age group 75+ : 104 104 106 106 107 106
Table 14 - Female pensioners to inactive population ratio by age group (%)
2005 2010 2020 2030 2040 2050 2060 Age group -54 : 4 4 4 4 4 4 Age group 55-59 : 28 35 39 39 38 39 Age group 60-64 : 104 81 85 81 82 82 Age group 65-69 : 105 107 108 105 105 104 Age group 70-74 : 105 106 110 108 107 107 Age group 75+ : 97 100 104 106 107 106
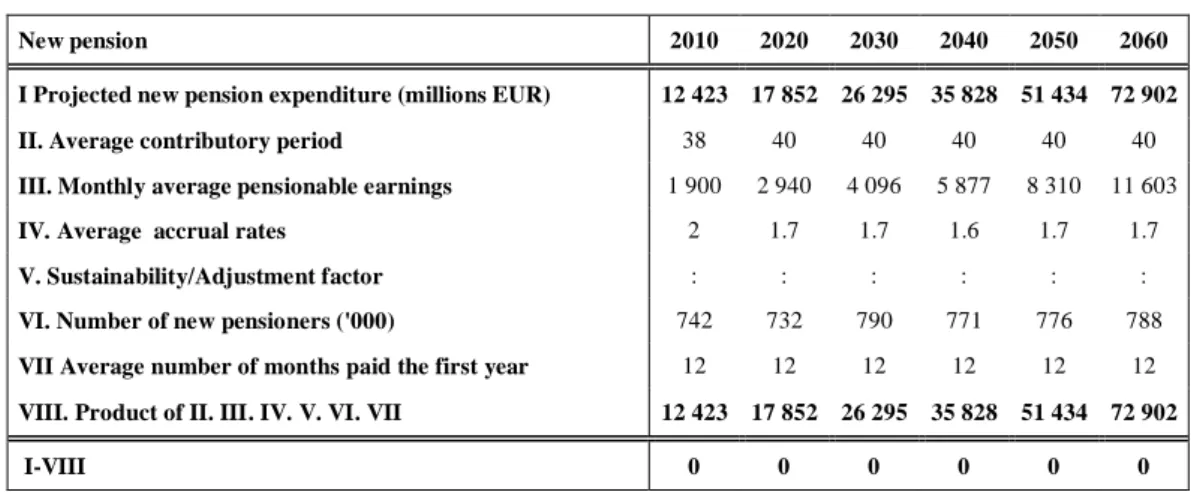
As regards the decomposition of new public old-age earning-related pension expenditures, estimation is provided in Table 15. For this computation to be feasible, all schemes are assumed to work as defined benefit schemes, which is a very crude approximation.
The average new pension is decomposed as the product of three terms:
– the average contributory period among new pensioners; – the average pensionable earnings among new pensioners; – the average accrual rate among new pensioners.
Multiplying this approximated average new pension by the number of new pensioners, we obtain an estimation of the flow of new pension expenditures.
The contributory period, linked to AWG labour supply projections, is expected to increase until 2020.This is related to the lengthening of women careers and the delayed exit out of the job market due to the recent pension reforms.
The average pensionable earnings trace back the progression of wages along the career. Its increase is due to productivity gains (though retaining several annual wages discounted with inflation reduces the impact on reference wages), and to better careers for women that participate more in the job market and hold better jobs.
The average accrual rate gives an insight of the ratio between the mean replacement rate of pension at retirement, and the average contributory period for the entire career. Its value would slightly decrease:
people are supposed to react positively to the incentives of the pension reforms and work longer, which partially compensates the effect of the increase in the reference period necessary to draw a full rate pension.
Finally, the number of new pensioners would first decrease under the effect of the 2010 pension reform, and then increase anew when the reform’s effect dwindles.
Table 15 - Projected and disaggregated new public pension expenditure (current €)
New pension 2010 2020 2030 2040 2050 2060
I Projected new pension expenditure (millions EUR) 12 423 17 852 26 295 35 828 51 434 72 902 II. Average contributory period 38 40 40 40 40 40
III. Monthly average pensionable earnings 1 900 2 940 4 096 5 877 8 310 11 603
IV. Average accrual rates 2 1.7 1.7 1.6 1.7 1.7
V. Sustainability/Adjustment factor : : : : : :
VI. Number of new pensioners ('000) 742 732 790 771 776 788
VII Average number of months paid the first year 12 12 12 12 12 12
VIII. Product of II. III. IV. V. VI. VII 12 423 17 852 26 295 35 828 51 434 72 902
I-VIII 0 0 0 0 0 0
Scope: new public old-age earning-related pensions.
II.4. – Sensitivity analysis
Definitions of the sensitivity tests are given in appendix E and detailed results in appendix F.
Given the functioning of the French pension system, the two scenarios revising the interest rate are not relevant, and therefore have not been computed: all things considered, six sensitivity tests have been run. We separately estimate the sensitivity tests on pension (with the aggregated COR model) and on disability.
Two of those sensitivity tests affect demographic variables: life expectancy and migration.
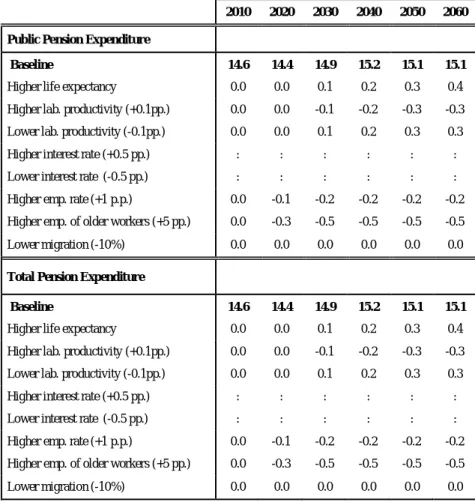
In the higher life expectancy scenario, pensions expenditures to GDP are expected to grow from 14.6% in 2010 to 15.5% in 2060; while a peak was reached in 2037 in the baseline scenario, here the pension expenditures keep on growing until the end of the period. However, it has to be noted that according to the “constant policy” hypothesis, we assumed that the reference length was constant, while since the 2003 reform it is supposed to be indexed on life expectancy. Therefore, the impact on the number of pensioners, and then on pension expenditure, should be less than what we get here.
In the lower migration scenario, pension expenditures are predicted to reach 15.1% of GDP in 2060, the peak year being 2037 with a ratio of 15.3%, owing to a negative impact on GDP and a slight decrease in the number of pensioners.
Two others tests pertain to employment assumptions.
GDP is boosted in the higher employment scenario, while pensions don’t react to that type of shock in our model. Absence of impact on pension leads to un upward bias, since a higher employment rate should slightly increase pension’s level. However the bias should be limited since it would affect mostly the reference wage (averaged on the 25 best years) only for people with uncomplete career and have only a marginal effect on the other factors such as the length of affiliation because unemployment, sickness or parental leave often give pension rights. Pension to GDP ratio in 2060 is expected to be improved compared to the baseline scenario, reaching only 14.9 points of GDP.
Another sensitivity test assumes the same augmentation of employment, but entirely concentrated on old-age workers (through an increase of their employment and participation
rates). The positive impact on GDP is then reinforced by a strong decrease in the number of pensioners: in 2060, the pension to GDP ratio is predicted to reach only 14.6%. The positive impact on average pension’s level is still not modelled, though a longer career at the end is likely to increase more pensions’ level than in the previous scenario.
The last two tests concern the labour productivity hypothesis.
In the higher productivity scenario, annual productivity growth is supposed to attain 1.64% in 2060 instead of the 1.54% reached in the baseline scenario. If pensions are driven up consequently, GDP is even more strongly boosted, for most of the pensions are calculated on the basis of the 25 best annual labour incomes: impact on wages is only progressively reflected on the final pension’s level. Overall, the effect on pension to GDP is positive, since in 2060 the ratio is expected to reach only 14.8% (vs. the 15.1% of the baseline scenario). Symmetrically, the situation is worsened in the lower productivity scenario: pensions are expected to represent 15.4% of the GDP in 2060.
Table 16 - Public pension expenditures under different scenarios
(deviation from the baseline in % GDP)
2010 2020 2030 2040 2050 2060
Public Pension Expenditure
Baseline 14.6 14.4 14.9 15.2 15.1 15.1
Higher life expectancy 0.0 0.0 0.1 0.2 0.3 0.4
Higher lab. productivity (+0.1pp.) 0.0 0.0 -0.1 -0.2 -0.3 -0.3
Lower lab. productivity (-0.1pp.) 0.0 0.0 0.1 0.2 0.3 0.3
Higher interest rate (+0.5 pp.) : : : : : :
Lower interest rate (-0.5 pp.) : : : : : :
Higher emp. rate (+1 p.p.) 0.0 -0.1 -0.2 -0.2 -0.2 -0.2
Higher emp. of older workers (+5 pp.) 0.0 -0.3 -0.5 -0.5 -0.5 -0.5
Lower migration (-10%) 0.0 0.0 0.0 0.0 0.0 0.0
Total Pension Expenditure
Baseline 14.6 14.4 14.9 15.2 15.1 15.1
Higher life expectancy 0.0 0.0 0.1 0.2 0.3 0.4
Higher lab. productivity (+0.1pp.) 0.0 0.0 -0.1 -0.2 -0.3 -0.3
Lower lab. productivity (-0.1pp.) 0.0 0.0 0.1 0.2 0.3 0.3
Higher interest rate (+0.5 pp.) : : : : : :
Lower interest rate (-0.5 pp.) : : : : : :
Higher emp. rate (+1 p.p.) 0.0 -0.1 -0.2 -0.2 -0.2 -0.2
Higher emp. of older workers (+5 pp.) 0.0 -0.3 -0.5 -0.5 -0.5 -0.5
II.5. – Changes in comparison with past projections
Table 17 - Decomposition of the change (in %) in public pension expenditure to GDP
and comparison with previous projection exercises
Public pensions to GDP % change Dependency ratio Coverage ratio Employment
effect Benefit ratio
Labour intensity Residual (incl. Interaction effect) 2001 * 3.87 7.70 0.68 -0.91 -3.60 : -0.09 2006 ** 1.98 8.69 -1.79 -0.93 -3.52 : -0.48 2009 *** 1.01 8.40 -2.20 -0.51 -4.03 : -0.66 2012 **** 0,54 9,15 -3,53 -1,23 -3,08 -0,01 -0,76 * 2001-2050; ** 2004-2050; *** 2007-2060; **** 2010-2060
The long-term change in pension expenditure to GDP ratio improve slightly: in the 2009 projections the ratio was expected to increase by 1.0 point of GDP between 2007 and 2060, among which 0.6 point of GDP between 2010 and 2060; in the present projections, it increases by 0.5 point. The financial crisis strongly affected the 2010 GDP level, undermining the ratio, but the 2010 Pension Reform absorbed this effect. This reform’s horizon is mid-term, most of its effect being concentrated before 2020; therefore the long run is not deeply changed.
Table 18 - Decomposition of the difference between 2009 and the new public pension
projection
2000 2005 2010 2015 2020 2030 2040 2050 2060 Ageing report 2009 (current billions €) 176 224 282 346 424 640 947 1357 1956 Change in assumption 0.0% 0.0% 0.0% 1.2% 2.2% 1.9% 1.8% 1.1% 0.0% Improvement in the coverage 3.7% 0.5% 0.6% 1.1% 1.0% 0.5% 0.3% -5.1% -5.0% Policy related changes +change in modelling 0.0% 0.0% -0.1% -3.3% -5.3% -4.9% -6.1% 0.2% 0.3% Change in interpretation
of constant policy 0.0% 0.0% 0.0% 0.0% 0.0% 0.0% 0.0% 0.0% 0.0% Total change 3.7% 0.5% 0.5% -1.0% -2.1% -2.5% -4.0% -5.2% -6.5%
New projections (current
III.
The pension models used for the EPC projection
III.1. – Coordination with the Secrétariat Général du “Conseil d’Orientation des
retraites” (COR)
Because of the large number of pension schemes in France, basic and complementary, and the difference in their rules and dynamics, the projection of pension expenditures is a complex exercise. It is necessary to carry out projections for each scheme and then to aggregate the different projections in a “all schemes” projections. One of the missions of the Conseil d’Orientation des Retraites (COR) (the French Pensions Advisory Council) is to carry out projections on a regular basis. The last national “all schemes” projections were published last year, just before the 2010 reform and did not include its effects.
In order to ensure consistency between projections at national and European level, the AWG projections for 2012 were carried out by the French Treasury in cooperation with the Secretariat of the COR, as it was done for the last AWG exercise.
III.2. – Assumptions and methodologies applied
III.2.1 – Pension schemes expenditure projections:
The AWG projections derive from the latest projections published by the COR in 2010. However, since these projections did not include the 2010 pension reform, the Treasury added the impact of the reform. Then, a simple macroeconomic model, based on the same hypothesis than for the previous exercise, has been used to take into account the AWG assumptions and to carry out the sensitivity tests. The overall method used may be split into three stages:
1 – In a first step, each of the major pension schemes (CNAVTS, FPE, CNRACL, ARRCO and AGIRC) used its own model to project its resources and expenditures, based on the baseline assumptions defined by the COR. Then, the COR combined all these projections thanks to an aggregate model in order to produce projections for the overall pension system. This exercise, quite heavy, is done every 3 or 5 years. The last time was in 2010 (what we call the 2010 COR projections).
2 – In a second step, the Treasury added the impact of the 2010 pension reform7 on the 2010 COR projections.
3 – In a third step, a simple macroeconomic model was used by the Treasury in cooperation with the Secretariat of the COR to adapt the projections to the demographic and macroeconomic assumptions defined by the AWG. We used the same methodology as in the 2009 exercise
4 – In a fourth and last step, decompositions by age and pension type and stock-flow analysis are estimated using data from external sources consistent with AWG macroeconomic and demographic assumptions.
Appendix B shows a global diagram of this projection procedure.
III.2.1.1 – Fist stage: the COR’s national projections
COR’s national projections rely on the one carried out by each of the pension scheme with their own model. In the 2010 round, only the major schemes participated in the projections exercise (CNAVTS, FPE, AGIRC-ARRCO, CNRACL). Thus, both the distinctive features of contributors (different wage path for executives and non-executive workers, zero unemployment risk for civil servants, etc.) and pensioners (higher life expectancy for civil servants) and the specific rights of each scheme are taken into account.
7
The impact of the reform on growth and activity has been taken into account by the Commission in the participation rates and GDP assumptions.
A detailed description of the model of two major pension schemes can be found in Appendix C: the one of CNAVTS (private sector employees) and the one of the two schemes for civil servants (Central government employee’s scheme and CNRACL for local government and hospitals employees).
The projections by scheme are aggregated in order to compute the total pension expenditures. To forecast the average pension, the number of pensioners is estimated, after correcting for the presence of poly-pensioners.
The last national projections carried out by the COR date back to 2010, thus we apply the evolution of expenditures, pensioners and contributions to the latest data in level available (respectively 2009 and 2007).
III.2.1.2 – Second stage: Taking into account the 2010 pension reform
In a second step, we add the estimated impact of the 2010 pension reform to these global projections. The main voted measures are encompassed, apart from the right for some workers categories (disabled, mothers of 3 children) to draw a full rate pension at age 658. The impact of the age measures on pensioners and expenditures, which is the major lever of the reform, is extrapolated from the impact estimated by the CNAVTS on private sectors employees only9,10.We nevertheless take into account the fact that the responsiveness of workers to the age measure depends on their scheme of affiliation. The impact of the other measures, relatively smaller, comes from governmental estimations.
III.2.1.3. – Third stage: Taking into account the AWG hypotheses
The AWG projections rely on specific hypotheses discussed by the AWG and the EPC. These assumptions are taken into account ex post by the Treasury thanks to an aggregate model of the French pension system implemented with the cooperation of Secretariat of the COR. This model simulates a single theoretical pay-as-you-go pension scheme and covers the overall pension system (basic and complementary pensions). It was also built in order to carry out analysis tests to various demographic and economic assumptions.
Inputs of the model are reminded in table 19. It enables to compare the COR 2010 and AWG 2012 projections, mostly similar.
Table 19 - Comparison of the assumptions of the COR and the AWG
Assumptions of the COR
scenario B* Assumptions of the AWG
Birth rate 1.9 child per woman 1.95 child per woman
Net migration flow 100 000 per year From 75 000 to 55 000 a year in 2060
Life expectancy at birth
Males: 83.8 years in 2050 Females: 89 years in 2050 Males: 83.9 years in 2050 (85.1 in 2060) Females: 89.1 years in 2050 (90.0 in 2060)
Unemployment rate Converges towards 4.5% in 2024 Converges towards 6.2% in 2020
Labour productivity 1.5% 1.5%
* COR projections were based on 3 macroeconomic scenarios, depending on the unemployment and productivity target. We refer to the central scenario.
8
Due to the lack of costing estimation of this measure.
9
We indeed lacked a long run estimate of the measures for all schemes.
10
GDP, labour supply, labour productivity and unemployment assumptions come directly from the AWG hypotheses.
The level of contributions is derived from the total wage bill (which is supposed to evolve as labour productivity) and the apparent observed rate of contribution of 2007, adjusted for the impact of the 2010 pension reform (convergence of the civil servants’ rate of contribution).
The average pension is derived from the one resulting from the national baseline projection after reform. It is adjusted to take into account the AWG productivity assumption.
The differences in demography between the national baseline scenario post reform and the AWG hypotheses are not taken into account because both projections rely on very close demographic assumptions.
The number of pensioners is the number of pensioners in the national baseline scenario after reform. Population aged 55 years-old and more grows at very similar rates according to the AWG and to the COR assumptions, despite the differences in mortality. Additionally, there is a very small difference in older labour supply. So we assume that the level of pensioners is the same in the two scenarios.
Pension expenditures are then computed as the result of the average pension times the number of pensioners.
III.2.1.4. – Fourth stage: decompositions by age and pension type, stock-flow analysis
For the CNAVTS, these decompositions are directly derived from the CNAVTS projection model.
For the “all schemes”, they are produced using data from external sources consistent with AWG macroeconomic and demographic assumptions.
III.2.2 – Disability expenditure projections:
On the one hand, disability pensions paid to people aged more than the legal retirement age are included in old-age pension expenditures, and are therefore projected thanks to the methodology described above. On the other hand, disability pensions intended for people aged less than the legal retirement age are projected separately, at an aggregated level.
First, the number of pensions/pensioners is obtained applying the disability risk by age observed in 2004 (last data available11) to the AWG demographic assumptions. Probability to become disabled at a given age is thus assumed constant through time. We take into account the temporary impact of the 2010 pension reform that will maintain 60-62 year old beneficiaries into disability plans. However we do not include any behavioural response to the reform from people applying for a disability pension when they are not eligible anymore to a normal pension. The average disability pension, estimated in 2009, evolves afterwards in line with labour productivity since previous wages are used to calculate its nominal level; however the price-indexation of those pensions, that should lower the expenditures, is not taken into account. Finally, total expenditures result from the product of the number of pensions by this estimated average pension amount.
11
Appendix A: Milestones of the 2010 reform
Generation Minimum ages for
early pension* Legal age**
Full rate pension age**
Before July 1st 1951 56-59 60 65
July 1st- Dec 31th 1951 56-60 60 + 4 months 65 + 4 months
1952 56-60 60+8 months 65 + 8 months
1953 56-60 61 66
1954 56-60 61 + 4 months 66 + 4 months
1955 56+4 months-60 61 + 8 months 66 + 8 months
1956 56+8 months-60 62 67
1957 57-60 62 67
1958 57+4 months-60 62 67
1959 57+8 months-60 62 67
1960 onward 58-60 62 67
*depending on the contribution time of the insured person (going from the reference time + 8 quarters for the youngest retirement age, to the reference time only for the oldest retirement age) and on the age at which people started working. ** this does not include the acceleration forecasted in the 2012 social security budget law.
For instance, someone born in 1960 can retire at age 58 only if he started working at 16 and has validated 174 quarters; or at age 60 if he started working at 18 and has validated 166 quarters; etc.
Appendix B: Global diagram of the 2012 AWG projections
COR projections
Projections of the 5 major pensions schemes made by the schemes on the same demographic
and macroeconomic hypothesis
C N A V T S F P E C N R A C L A R R C O A G IR C AWG assumptions: - Labour productivity growth rate - Unemployment rates
- Participation rates - Population
Aggregation of the 5 projections, taking into account polypensioners and the 16
remaining schemes, non-explicitly modelled
AWG baseline scenario / sensitivity tests Labour productivity;
Labour supply; Unemployment rate; Elderly participation rate; Elderly population.
Macroeconomic pension model:
One theoretical aggregate pension scheme: Pensions expenditure (gross); Contributions;
Number of pensioners; Number of contributors.
AWG projections
COR baseline scenario Average pension; Number of pensioners; Elderly population.
Inclusion of the effect of the 2010 pension reform National base line scenario
Appendix C: The model of the basic private sector employees scheme (CNAVTS)
and the model of the basic public sector employees scheme (FPE/CNRACL).
C.1 – Model used for CNAVTS (private sector employees)
The pension model for the private sector scheme (CNAVTS) is a dynamic microsimulation model, in which the individual data are estimated on a quarterly step and updated every year12. The model is based on a sample of 3.5 million people, which accounts for 5% of CNAVTS insured population.
The results given in the country fiche are based on the national demographic and economic scenario of the COR.
Before the simulations can be run, 4 stages are needed in order to prepare the data:
1 – Death completion;
2 – Children completion;
3 – Completion of the ages when leaving school;
4 – Working life completion;
After that, transition equations are computed and used to simulate the evolution of the sample during working life and retirement (stage 5 to 9):
5 – Working life transitions;
6 – Wage estimation;
7 – Pensions for housewives and “househusbands”;
8 – Simulation of retirements;
9 – Survivor pensions.
Stages 1 to 4
Stages 1 to 4 are just data completions with econometric methods.
Stage 5: Working life transitions
Stage 5 is the main part of the simulation. For each of the quarters before they retire, all individuals in the sample can be in one of seven states:
1 – Labour market participation, working and contributing to the CNAVTS scheme;
2 – Labour market participation, working and contributing to another scheme with the same rules as the CNAVTS scheme;
3 – Labour market participation, working and contributing to a scheme with different rules than the CNAVTS scheme;
4 – Labour market participation but unemployed;
5 – Sick leave;
6 – Disability or pension for occupational injury;
12
7 – Other, without validating any pension right.
The transition equations between these seven states are computed thanks to econometric estimations, and then used to simulate the sample in the future.
Stage 6: Wage estimation
Four wage equations are computed (before and after the school leaving age, one for males and one for females). The wage in logarithm is explained by several variables. One of them is a temporal trend which grows in line with the labour productivity growth assumption.
Stage 7: Pensions for housewives and “househusbands”
A mother or a father may be temporarily out of the labour force in order to educate their children. Then they are eligible to free pension rights. This module simulates the corresponding contributions.
Stage 8: Simulation of retirements
Transition equations for retirement are computed in order to simulate retirement in the future. The impact of the 2003 and 2010 pension reform are included.
Stage 9: Survivor pensions
In order to compute survivor pensions, marriages are simulated between men and women in the CNAVTS population. Departing from the initial stock of survivor pensions, the projection is made from 2004 and afterwards by implementing the death projections.
C.2. – Model used for FPE & CNRACL (civil servants)
The pension schemes for the territorial public servants (CNRACL) and for the State public servants (FPE) follow the same rules. Therefore, both projections are made with the same model, named ARIANE and realised by the Budget Directorate of the Ministry of Finance. ARIANE is a model of weighted set cases. The evolution of the population covered takes into account two important features of public employment: devolution (which increase the number of individuals covered by the CNRACL) and a planned reduction in the recruitment of civil servants (which decrease in the short term the number of individuals covered by the FPE). The life expectancy of civil servants is supposed higher than in the rest of the population. Their wage is supposed to grow in the medium and long run at the same rate than the mean average wage in the private sector, with a constant mean bonus rate.
Appendix D: Diagram of the macroeconomic model used in projections
National Baseline scenario AWG hypotheses:
Labour productivity growth
Unemployment rate by age and gender Population by age and gender
Labour force by age and gender Employment by age Average pension Adjusted for productivity assumptions macroeconomic model Aggregated computation: of gross pension expenditures; of contributions.
Population out of labour force 55 years-old (AWG)
AWG results
ratio “Number of pensioners” / “Population out of labour force 55 years-old” constant whatever
the scenario Number of pensioners
Appendix E: Overview of the sensitivity tests
Sensitivity test Definition
1 Higher life expectancy Increase of life expectancy at birth of one year by 2060 compared with the baseline projection.
2 Lower migration A scenario with 10% less migration compared with the baseline projection.
3 Higher employment
The employment rate is 1 p.p. higher compared with the baseline projection for the age-group 20-64. The increase is introduced linearly over the period 2016-2025 and remains 1 p.p. higher thereafter. The higher employment rate is assumed to be achieved by lowering the rate of structural unemployment (the NAIRU).
4 Higher elderly employment
The employment rate of older workers (55-64) is 5 p.p. higher compared with the baseline projection. The increase is introduced linearly over the period 2016-2025 and remains 5 p.p. higher thereafter. The higher
employment rate of this group of workers is assumed to be achieved through a reduction of the inactive population.
5 Higher/lower labour productivity
Labour productivity growth is assumed to converge to a productivity growth rate which is 0.1 percentage points higher/lower than in the baseline scenario. The increase is introduced linearly during the period 2016-2025, and remains 0.1 p.p. above/below the baseline thereafter.