Université de Montréal
CARACTÉRISATION SPATIO- TEMPORELLE DE PLASMAS
INDUITS PAR LASER POUR DES APPLICATIONS
À LA CHIMIE ANALYTIQUE ET AU
DÉPÔT DE COUCHES MINCES
par
Mahmoud Dawood
Département de physique Faculté des arts et des sciences
Thèse présentée à la Faculté des études supérieures
en vue de l’obtention du grade de
Philosophiæ Doctor (Ph.D.) en physique
Décembre 2014
Université de Montréal
SPACE AND TIME CHARACTERIZATION OF
LASER-INDUCED PLASMAS FOR APPLICATIONS
IN CHEMICAL ANALYSIS AND
THIN FILM DEPOSITION
by
Mahmoud Dawood
Department of physics Faculty of Arts and Science
A dissertation presented to the Faculty of Graduate Studies in partial fulfillment of the requirements for the degree of
Doctor of philosophy (ph.D.) in Physics
December 2014
Université de Montréal Faculté des Études Supérieures
Cette thèse intitulée:
CARACTÉRISATION SPATIO- TEMPORELLE DE PLASMAS
INDUITS PAR LASER POUR DES APPLICATIONS
À LA CHIMIE ANALYTIQUE ET AU
DÉPÔT DE COUCHES MINCES
Présentée par : Mahmoud Dawood
a été évaluée par le jury composé des personnes suivantes :
Prof. Luc Stafford President du jury Prof. Joëlle Margot Directrice de recherche
Prof. Michael Wertheimer Member du jury Prof. Steven Rehse Examinateur externe Prof. Yvan Saint-Aubin Représentant du doyen
iv
RÉSUMÉ
Après des décennies de développement, l'ablation laser est devenue une technique importante pour un grand nombre d'applications telles que le dépôt de couches minces, la synthèse de nanoparticules, le micro-usinage, l’analyse chimique, etc. Des études expérimentales ainsi que théoriques ont été menées pour comprendre les mécanismes physiques fondamentaux mis en jeu pendant l'ablation et pour déterminer l’effet de la longueur d'onde, de la durée d'impulsion, de la nature de gaz ambiant et du matériau de la cible.
La présente thèse décrit et examine l'importance relative des mécanismes physiques qui influencent les caractéristiques des plasmas d’aluminium induits par laser. Le cadre général de cette recherche forme une étude approfondie de l'interaction entre la dynamique de la plume-plasma et l’atmosphère gazeuse dans laquelle elle se développe. Ceci a été réalisé par imagerie résolue temporellement et spatialement de la plume du plasma en termes d'intensité spectrale, de densité électronique et de température d'excitation dans différentes atmosphères de gaz inertes tel que l’Ar et l’He et réactifs tel que le N2 et ceà des pressions s’étendant de 10‾7 Torr (vide) jusqu’à 760 Torr (pression atmosphérique).
Nos résultats montrent que l'intensité d'émission de plasma dépend généralement de la nature de gaz et qu’elle est fortement affectée par sa pression. En outre, pour un délai temporel donné par rapport à l'impulsion laser, la densité électronique ainsi que la température augmentent avec la pression de gaz, ce qui peut être attribué au confinement inertiel du plasma. De plus, on observe que la densité électronique est maximale à proximité de la surface de la cible où le laser est focalisé et qu’elle diminue en s’éloignant (axialement et radialement) de cette position. Malgré la variation axiale importante de la température le long du plasma, on trouve que sa variation radiale est négligeable. La densité électronique et la température ont été trouvées maximales lorsque le gaz est de l’argon et minimales pour l’hélium, tandis que les valeurs sont intermédiaires dans le cas de l’azote. Ceci tient surtout aux propriétés physiques et chimiques du gaz telles que la masse des espèces, leur énergie d'excitation et d'ionisation, la conductivité thermique et la réactivité chimique.
v L'expansion de la plume du plasma a été étudiée par imagerie résolue spatio-temporellement. Les résultats montrent que la nature de gaz n’affecte pas la dynamique de la plume pour des pressions inférieures à 20 Torr et pour un délai temporel inférieur à 200 ns. Cependant, pour des pressions supérieures à 20 Torr, l'effet de la nature du gaz devient important et la plume la plus courte est obtenue lorsque la masse des espèces du gaz est élevée et lorsque sa conductivité thermique est relativement faible. Ces résultats sont confirmés par la mesure de temps de vol de l’ion Al+ émettant à 281,6 nm. D’autre part, on trouve que la vitesse de propagation des ions d’aluminium est bien définie juste après l’ablation et près de la surface de la cible. Toutefois, pour un délai temporel important, les ions, en traversant la plume, se thermalisent grâce aux collisions avec les espèces du plasma et du gaz.
Mots-clés: plasmas induits par laser, ablation de l'aluminium, dynamique de la plume du plasma, ablation dans différentes atmosphères gazeuses, spectroscopie d'émission optique, temps de vol, densité électronique, température d'excitation, diagramme de Boltzmann.
vi
ABSTRACT
After decades of development, laser ablation has become an important technique for a large number of applications such as thin film deposition, nanoparticle synthesis, micromachining, chemical analysis, etc. Experimental and theoretical studies have been conducted to understand the physical mechanisms of the laser ablation processes and their dependence on the laser wavelength, pulse duration, ambient gas and target material.
The present dissertation describes and investigates the relative importance of the physical mechanisms influencing the characteristics of aluminum laser-induced plasmas. The general scope of this research encompasses a thorough study of the interplay between the plasma plume dynamics and the ambient gas in which they expand. This is achieved by imaging and analyzing the temporal and spatial evolution the plume in terms of spectral intensity, electron density and excitation temperature within various environments extending from vacuum (10‾7 Torr) to atmospheric pressure (760 Torr), in an inert gas like Ar and He, as well as in a chemically active gas like N2.
Our results show that the plasma emission intensity generally differs with the nature of the ambient gas and it is strongly affected by its pressure. In addition, for a given time delay after the laser pulse, both electron density and plasma temperature increase with the ambient gas pressure, which is attributed to plasma confinement. Moreover, the highest electron density is observed close to the target surface, where the laser is focused and it decreases by moving away (radially and axially) from this position. In contrast with the significant axial variation of plasma temperature, there is no large variation in the radial direction. Furthermore, argon was found to produce the highest plasma density and temperature, and helium the lowest, while nitrogen yields intermediate values. This is mainly due to their physical and chemical properties such as the mass, the excitation and ionization levels, the thermal conductivity and the chemical reactivity.
vii The expansion of the plasma plume is studied by time- and space-resolved imaging. The results show that the ambient gas does not appreciably affect plume dynamics as long as the gas pressure remains below 20 Torr and the time delay below 200 ns. However, for pressures higher than 20 Torr, the effect of the ambient gas becomes important and the shorter plasma plume length corresponds to the highest gas mass species and the lowest thermal conductivity. These results are confirmed by Time-Of-Flight (TOF) measurements of Al+ line emitted at 281.6 nm. Moreover, the velocity of aluminum ions is well defined at the earliest time and close to the target surface. However, at later times, the ions travel through the plume and become thermalized through collisions with plasma species and with surrounding ambient gas.
Key words: laser-induced plasmas, ablation of aluminum, plasma plume dynamics, ablation in different ambient gas, optical emission spectroscopy, time of flight, electron density, excitation temperature, Boltzmann plot.
viii
TABLE OF CONTENTS
Résumé... iv Abstract... vi List of Figures... xi Acknowledgement... xix Introduction 1 Chapter 1: Theoretical Background 1.1. Introduction... 111.2. What is Plasma?... 12
1.3. Basics of Laser-Matter Interaction and Processes in Laser-Induced Plasma.. 13
1.4. Laser plasma diagnostics... 17
1.4.1. Emission spectroscopy techniques…... 17
1.4.2 Measurement of electron density... 21
1.4.3 Thermodynamic Equilibrium and Temperatures determination... 23
1.5. Literature Review of Laser-plasma Diagnostics under the effect of ambient gas... 27
1.5.1 Influence of pressure on emission intensity... 28
1.5.2 Effect of ambient gas pressure on plasma density... 32
1.5.3 Effect of ambient gas pressure on plasma temperature... 35
1.5.4 Effect of ambient gas composition... 40
ix Chapter 2: Experimental Setup, Diagnostic Descriptions, and Spectroscopic
Techniques
2.1. Introduction... 51
2.2. Pulsed Laser... 52
2.3. Target and Manipulator... 52
2.4. Spectrograph. ICCD camera and data acquisition... 52
2.5. Target chamber... 56
2.6. Electron density measurements... 56
2.7. Excitation temperature measurements... 59
2.8. Aluminum ion dynamics: Time-Of-Flight... 61
2.9. References... 63
Chapter 3: Effect of ambient gas pressure and nature on the temporal evolution of aluminum laser induced plasmas 3.1. Introduction... 65
3.2. Temporal dependence of plasma emission on gas pressure and nature……... 66
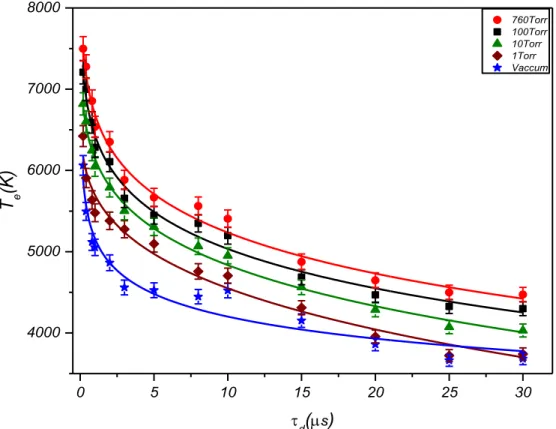
3.3. Dependence of electron density on delay after laser shot, gas pressure and nature... 70 3.4. Dependence of excitation temperature on time delay after laser shot, gas pressure and nature... 74
3.5. Conclusion... 78
3.6. References... 79
Chapter 4: Axial- and radial-resolved electron density and excitation temperature of aluminum plasma induced by nanosecond laser: effect of the ambient gas composition and pressure 4.1. Introduction... 82
4.2. Axial dependence of electron density and excitation temperature... 83
4.3. Radial dependence of electron density and excitation temperature... 90
x
4.5. References... 99
Chapter 5: Influence of gas, composition and pressure on the plasma plume dynamics of nanosecond laser-induced aluminum plasmas 5.1. Introduction... 102
5.2. Plasma plume dynamics... 103
5.3. Aluminum ion dynamic: Time-Of-Flight... 110
5.4. Conclusion... 115
5.5. References... 116
General conclusion and future work 118 Appendix Appendix I: Temporal evolution of the plasma electron density and excitation temperature……….…... 125
Appendix II: Spatial evolution of the plasma electron density and excitation temperature……... 128
Appendix III: Temporal and ambient pressure effects on Aluminum plasma plume dynamics... 131
xi
LIST OF FIGURES
CHAPTER 1
(1-1) Temporal development of laser induced plasma processes and emission radiation. Inset Figure is taken from reference.……… 15 (1-2) Comparison of LIBS spectra of Si at atmospheric pressure and
vacuum………...………... 29
(1-3) LIBS spectra of a geological sample (oolitic hematite) at various
pressures……… 29
(1-4) Effect of air pressure on aluminum line emission intensities from Al-6061 alloy. Each spectrum has been obtained from a single laser pulse of 10 mJ energy, 10 ns delay time and 100 ns gate width. Neutral Al I lines at 308.21, 309.27, 394.6 and 396.15 nm show significant enhancement with rising pressure. Low concentration of Mg (383.8 nm), Fe (360 nm) and Cu (324.7 nm) lines present in the Al- 6061 alloy are enhanced under
low-pressure conditions……… 30
(1-5) 3-D plot of the intensity ratio for Pb(II)/Pb(I) at the pressure of 760 – 10 Torr under various atmospheric gases (air, argon, and helium)…………... 31 (1-6) Plasma electron density ne versus capture delay time, for ambient
pressures in the range 103 to 10−4 mbar……….. 32 (1-7) Spatial variation of ne at 1000, 500, and 100 mbar of the ambient
gas……….……… 33
(1-8) ne distributions of Fe plasma in the time windows 5-6 µs of the
laser-induced plasmas generated at various pressures of air: (a) 10mbar, (b) 25 mbar, (c) 100 mbar, (d) 250 mbar, and (e) 1000 mbar……….. 34 (1-9) Spatial evolution of ne of Fe plasma formed by a Xecl excimer laser
(308nm, 10 ns) in air at pressures of 760 (∆) , 50 (◊) and 0.5(□) Torr vs.
xii
(1-10) Influence of the ambient gas pressure on Te of Cu plasma produced by
Nd:YAG single laser pulse of 80mJ (squares) and by two simultaneous laser pulses with total energy of 160mJ (circles)……… 36 (1-11) Spatial Te profile of Fe target formed by a XeCl excimer laser (308nm, 10
ns) in air at 760 (∆) , 50 (◊) and 0.5(□) Torr………. 37 (1-12) Spectral fit Te versus time after the laser pulse for six pressure cases at a
fixed laser energy of 180 mJ/pulse……… 38 (1-13) Temporal evolution of Te of Si plasma produced by Nd:YAG(532 nm)
laser at ambient pressures of air varying from 103 to 10-4
mbar……….……….. 39
(1-14) Temporal evolution of Te and ne of laser produced Fe plasmas generated
in air, argon, and helium at atmospheric pressure………. 41 (1-15) Emission intensities and Time resolved Te in the various atmospheres
Ar(0), air(●) and He(∆). The sample was a standard aluminum alloy
containing 0.97 % iron……….. 42
(1-16) Te dependence on time measured with a copper sample in argon (●), neon
(◊), air (□), nitrogen (x) and helium (∆)………...…. 43 CHAPTER 2
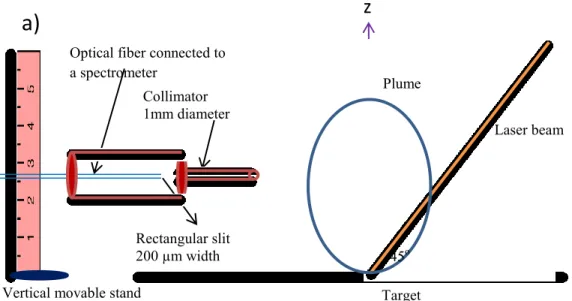
(2-1) Schematic drawing of the experimental arrangement………... 51
(2-2) ICCD Camera delay and integration times diagram………. 54
(2-3) Schematic drawing of the spatial experimental arrangement in the direction a) axial b) radial………. 55
(2-4) The emission line profile of aluminum ion Al II at 281.6 nm in a) argon
and b) helium background gases………... 58
(2-5) a) Spectrum of Fe I lines observed in the plasma and used to make a
Boltzmann plot presented in b)………. 60
(2-5) Temporal evolution of the normalized intensity of Al II emission (at 281.6 nm) in vacuum at distances of 4, 8 and 10 mm from the target surface in
xiii
CHAPTER 3
(3-1) Time dependent behavior of optical emission intensity of Al plasma in the presence of Ar at 100 Torr. The wavelength range contains the AlII line at 281.6 nm as well as MgII line at 279.55 and 280.7nm………. 67
(3-2) The effect of ambient gas pressure on Al II ion line intensity at delay time 100 ns after laser shots. The wavelength range contains the AlII line at 281.6 nm as well as MgII line at 279.55 and 280.7nm ……….... 68
(3-3) Length of the plasma plume as a function of ambient gas pressure and
nature………. 68
(3-4) Effect of ambient gas pressure and nature on the intensity of the Al II line
at 281.6 nm……… 69
(3-5) Time dependence of ne for various argon pressures……….………… 71
(3-6) Time dependence of ne at (a) 1 Torr and (b) 100 Torr for the three
different gases investigated………...……… 72
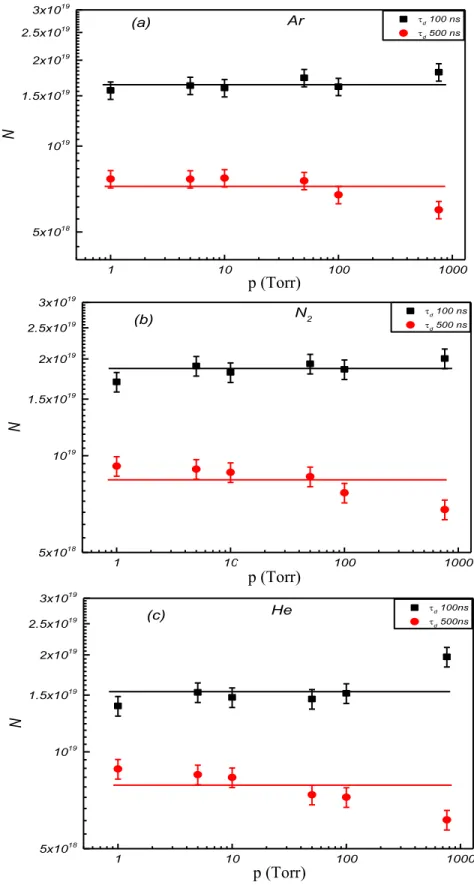
(3-7) Pressure dependence of the total number of electron in the plasma plume at two delays after laser pulse for (a) argon, (b) nitrogen and (c) helium…. 73
(3-8) Time dependence of Te for different gas pressure in Ar
atmosphere……….………... 75
(3-9) Time dependence of Te at (a) 10 Torr and (b) 100 Torr for the three
ambient gases……… 77
CHAPTER 4
(4-1) Axial variation of ne in ambient Ar for different pressures (from vacuum
up to atmosphere) at a) 100 ns, b) 500 ns and c) 1000
xiv (4-2) Axial variation of ne in ambient N2 for different pressures (from vacuum
up to atmosphere) at a) 100 ns, b) 500 ns and c) 1000 ns. The insets show the same experimental results with an expanded vertical
scale……….……….. 85
(4-3) Axial variation of ne in ambient He for different pressures (from vacuum
up to atmosphere) at a) 100 ns, b) 500 ns and c) 1000 ns. The insets show the same experimental results with an expanded vertical
scale……….……….. 86
(4-4) Axial variation of Te in ambient Ar for different pressures (from vacuum
up to atmosphere) at a) 500 ns, b) 5 µs and c) 20 µs………...……. 87
(4-5) Axial variation of Te in ambient N2 for different pressures (from vacuum
up to atmosphere) at a) 500 ns, b) 5 µs and c) 20 µs………...…. 88
(4-6) Axial variation of Te in ambient He for different pressures (from vacuum
up to atmosphere) at a) 500 ns, b) 5 µs and c) 20 µs………...……. 89
(4-7) Radial variation of ne in ambient Ar for different pressures (from vacuum
up to atmosphere) at a) 100 ns, b) 500 ns and c) 1000
ns……….……….. 91
(4-8) Radial variation of ne in ambient N2 for different pressures (from vacuum
up to atmosphere) at a) 100 ns, b) 500 ns and c) 1000
ns………... 92
(4-9) Radial variation of ne in ambient He for different pressures (from vacuum
up to atmosphere) at a) 100 ns, b) 500 ns and c) 1000
ns……….……….. 93
(4-10) Radial variation of Te in ambient Ar for different pressures (from vacuum
up to atmosphere) at a) 500 ns, b) 5 µs and c) 20 µs………...…. 94
(4-11) Radial variation of Te in ambient N2 for different pressures (from vacuum
up to atmosphere) at a) 500 ns, b) 5 µs and c) 20 µs………...……. 96
(4-12) Radial variation of Te in ambient He for different pressures (from vacuum
xv
CHAPTER 5
(5-1) iCCD images of the plasma plume in vacuum (5×10‾7 Torr) at 50, 100, 300, 500 and 1000 ns. A zoom of the plasma plume at 50 ns is shown at
the right of figure ……….……… 103
(5-2) iCCD images of the plasma plume in helium ambient gas at a) 0.1 Torr and b) 100 Torr. A zoom of the plasma plume at 50 ns is shown at the right of figure. The white-dashed contours correspond to the plasma
plume shape observed in vacuum for the same time delay………... 105
(5-3) iCCD images of the plasma plume in nitrogen at a) 0.1 Torr and b) 100 Torr. A zoom of the plasma plume at 50 ns is shown at the right of figure 4. The white-dashed contours correspond to the plasma plume shape
observed in vacuum………... 105
(5-4) iCCD images of the plasma plume in argon ambient gas at a) 0.1 Torr and b) 100 Torr. A zoom of the plasma plume at 50 ns is shown at right of the figure. The white-dashed contours correspond to the plasma plume shape
obtained in vacuum………... 106
(5-5) Time evolution of the plasma plume length (PPL) in a) helium, b) nitrogen and c) argon at different pressures: vacuum (5×10‾7 Torr), 0.1,
10 and 100 Torr………. 107
(5-6) Variation of the plasma plume length (PPL) as a function of the pressure in helium, nitrogen and argon at different time delays: a) 50 ns, b) 300 ns
and c) 1µs……….. 108
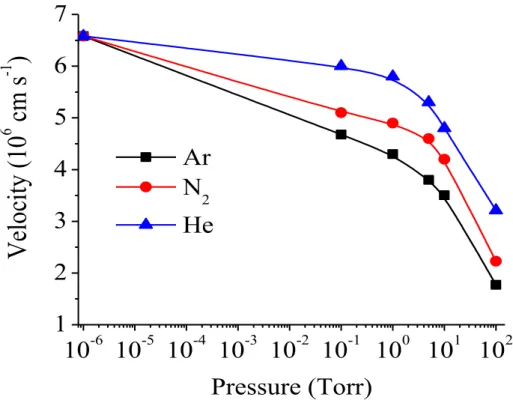
(5-7) Expansion velocity of the plasma plume derived from iCCD images as a
function of pressure in helium, nitrogen and argon……….. 110
(5-8) Temporal evolution of the normalized intensity of Al II emission (at 281.6
xvi (5-9) Temporal evolution of the normalized intensity of Al II emission (at 281.6
nm) in different ambient gases, pressures and distances from the target surface: a) 5 Torr and 4 mm, b) 100 Torr and 4 mm, c) 5 Torr and 8 mm,
d) 100 Torr and 8 mm, e) 5 Torr and 10 mm and f) 100 Torr and 10 mm… 112
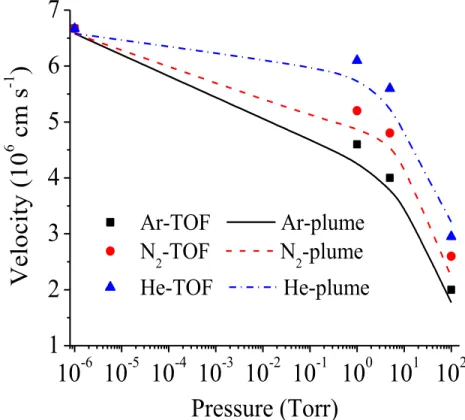
(5-10) Comparison between the expansion velocities of the plasma plume derived from iCCD images and TOF measurements as a function of the
pressure for helium, nitrogen and argon………... 114
APPENDIX
(A-1) Time dependence of ne for various N2 pressures………..… 125 (A-2) Time dependence of ne for various He pressures……….. 125
(A-3) Time dependence of ne for various Ar pressures from AlII (281.6 nm)..…. 126
(A-4) Time dependence of Te for different gas pressure in N2 atmosphere.……... 126 (A-5) Time dependence of Te for different gas pressure in He atmosphere……... 127
(A-6) Axial variation of ne in Ar, N2 and He ambient gases a) at pressure 10
Torr and time delay 500 ns. b) at pressure 50 Torr and time delay 100 ns... 128
(A-7) Axial variation of Te in Ar, N2 and He ambient gases a) at pressure 50
Torr and time delay 500 ns. b) at pressure 1 Torr and time delay 500 ns... 129
(A-8) Radial variation of ne in Ar, N2 and He ambient gases at pressure 100 Torr
and time delay 1 µs……….……….. 130
(A-9) Radial variation of Te in Ar, N2 and He ambient gases at pressure 10 Torr
and time delay 5 µs……….……….. 130
(A-10) iCCD images of the plasma plume in argon ambient gas at a) 0.1 Torr, b) 1 Torr, c) 10 Torr and d) 100 Torr. A zoom of the plasma plume at 50 ns is shown at right of the figure. The white-dashed contours correspond to
xvii (A-11) iCCD images of the plasma plume in nitrogen ambient gas at a) 0.1 Torr,
b) 1 Torr, c) 10 Torr and d) 100 Torr. A zoom of the plasma plume at 50 ns is shown at right of the figure. The white-dashed contours correspond
to the plasma plume shape obtained in vacuum……… 132
(A-12) iCCD images of the plasma plume in nitrogen ambient gas at a) 0.1 Torr, b) 1 Torr, c) 10 Torr and d) 100 Torr. A zoom of the plasma plume at 50 ns is shown at right of the figure. The white-dashed contours correspond
to the plasma plume shape obtained in vacuum……… 133
(A-13) Comparison between iCCD images of the plasma plume in helium,
xviii
LIST OF TABLES
(2-1) ICCD Camera delay and integration time values……….. 54
(2-2) Spectral data for the transitions of Al II, Mg II and Al I……….. 59
(2-3) Spectral data for the transitions of Fe I………. 61
(A-1) Physical properties of the gases……… 127
xix
ACKNOWLEDGMENTS
First and foremost, I would like to express my deepest gratitude to my research adviser, Professor Dr. Joëlle Margot for all the continuous support, scientific guidance and advice she has given me all these years. Her vast knowledge, calm nature and positive criticism motivated me to finish this research. Indeed, I appreciate all her contributions of time, ideas, and funding to make my Ph.D. experience productive and stimulating.
All my gratitude is also going to the members of the Jury committee for having accepted to evaluate this research work:
I would like to express my sincere thanks to Assoc. Prof. Dr. Luc Stafford, of the Physique des Plasmas group at University of Montréal, for having accepted to preside over the jury committee.
I would like to express my special thanks to Prof. Dr. Michael Wertheimer, of the Department of Engineering Physics at Ecole Polytechnique Montréal, for having accepted to review this work and for being part of the jury committee.
I would like to express my deep thanks to Assoc. Prof. Dr. Steven Rehse, of the Department of Physics at the University of Windsor for having accepted to examine this work and for being part of the jury committee.
I am indebted to all the previous and current members of the physics department at the University of Montreal for providing me the opportunity to perform my research in a remarkable human and scientific environment. In particular, special and remarkable thanks to
xx the Physique des Plasmas group at University of Montréal. I consider myself very fortunate and I am incredibly proud to have been a part of this amazing group.
I thank Mr. Richard Piché and Dr. Danielle Kéroack for their kind help and assistance in purchasing equipment needed for the research and setting up the initial stages of the experiment.
Exceptional thanks to Dr. Ahmad Hamdan, who as a good friend was always willing to help and give his best suggestions and contribution in writing the articles.
Lastly, but most importantly, I would like to extend my sincerest gratitude and appreciation to all members of my family and friends for their unwavering support and encouragement during my entire life.
To my parents, my wife and my lovely kids
Aesha & Maryam for their endless love,
support and encouragement.
2
Introduction
In recent years, there has been a growing interest in characterizing plasmas produced by laser-matter interaction. This stems from the need for developing and improving several applications of laser-induced plasma. This includes elemental analysis by laser-induced breakdown spectroscopy (LIBS) performed at atmospheric pressure [1, 2], as well as thin film [3] and nanoparticles and cluster synthesis by pulsed-laser deposition (PLD) in background gas with residual or low pressure [4], in addition to materials machining (welding and cutting) [5], or even for propulsion technology when the target used is adapted for this purpose [6]. The wealth of the physical phenomena allows the development of hybrid laser-based techniques. For instance, the ablation of a solid target immersed in a liquid medium was used for the synthesis of new materials. Indeed, the ablated species are highly confined to a small region in the vicinity of the solid-liquid interface due to the inertia of liquid [7, 8]. It is expected that this region will have an instantaneous high density of energetic species, high pressure and high temperature, forming a suitable medium for the growth of some crystallographic phases [9]. Actually, it has been reported that small crystallites of diamond are formed by the irradiation of a solid target immersed in water [10] or in organic liquids [11]. This has led to significant research progress in the characterization of laser-produced plasma to obtain exhaustive information on the different physical processes governing these plasmas.
3
In laser-induced plasmas, an intense laser beam with an irradiance exceeding a certain threshold value, typically in the order of 108 W/cm2, is focused on the surface of a target which, during or by the end of the pulse, may dissociate, excite, and/or ionize the constituent atomic species of the solid and produce the plasma.
As reported by Raizer [12], when a pulsed laser beam is directed to a small spatial region of target atoms, the laser-material interaction begins, producing a very rapid temperature rise at the focal spot. This produces breakdown in the region of the focal spot of the target atoms and results in the ionization of the atoms. Subsequently, the plasma becomes absorbing at the laser beam wavelength after a certain delay, and it expands out of the focal volume due to the drastic increase of the plasma density in a very short period of time. This extremely high density of plasma energy sustains the plasma plume for a relatively long time after the end of the laser pulse.
The expansion of the plasma begins to slow down via collisions with the ambient gas species or within the plasma plume. Then, electrons and ions recombine, forming a large population of neutral atoms, and the plasma continues to cool down. Depending on the pressure, mass density and thermal conductivity of the ambient gas, the plasma lifetime may vary from a few hundreds of ns to a few tens of µs.
It is worth mentioning that the plasma plume characteristics are extremely dependent on the laser beam parameters such as wavelength, intensity, pulse duration and irradiation spot size, as well as the ambient pressure and gas composition. In particular, the interaction of the plume plasma with an ambient gas is a far more complex gas dynamic process (in contrast with the situation in vacuum, where there is a free expansion), attributed to the occurrence of several physical processes, such as deceleration, attenuation, thermalization of the ablated
4
species, diffusion, recombination, formation of shock waves, and clustering [13]. Moreover, the physical, chemical and mechanical properties of the target material also play an important role in laser ablation [14, 15, and 16].
The plasma emission spectrum is basically a fingerprint of the plasma’s physical state and it can be used to determine several characteristics, including the number densities and temperatures of the different plasma species (i.e. ions, electrons and neutral atoms). Among the aforementioned characteristics, the magnitude and the temporal evolution of both the temperature Te and the electron density ne are two major properties to be investigated and
optimized by carefully choosing suitable diagnostic techniques. The most useful technique is emission spectroscopy, which can provide, in-situ, spatially and temporally precise measurements of plasma species characteristics. Moreover, emission spectroscopy is non-intrusive and it is also often flexible, while enabling investigation of high temperature or high/low pressure systems.
Objectives of the thesis
In literature, there are contradictory published results. On the one hand, Freeman et al. [17] have shown that the ablation of a brass (70% copper and 30% zinc) target in vacuum and in air (at atmospheric pressure) leads to plasma with high ne and Te when the experiments were
performed at atmospheric pressure. The variation as a function of pressure has an identical trend, whatever the laser pulse duration, 8 ns (at 1064 nm) or 40 fs (at 800 nm). Moreover, several experimental studies [18 - 21] have shown that generating laser plasmas in an argon atmosphere yields higher emission intensity as compared to other gases like He, N2 and air.
5
lower ionization energy, and more efficient heating by inverse Bremsstrahlung. On the other hand, Bashir et al. [22] used a 10 ns pulsed laser at 1064 nm to ablate a cadmium target in argon, air and helium background gases at pressure in the ranges of 5-760 Torr. They found that the Te as well as the ne decreases with increasing gas pressure. Farid et al. [23] used the
same laser characteristic as Bashir et al. (10 ns at 1064 nm) to ablate a copper target also in the same environments of argon, air and helium in pressure ranges of 5-760 Torr. The authors found that the Te increases with rising pressure, reaching a maximum at ~100 Torr, and
decreases to reach an identical value (that obtained at low pressure) at 760 Torr. The same variation was also observed in the ne, but it was more pronounced in argon gas compared to air
and helium. Furthermore, other research groups [24-26] confirmed that for each ambient gas there existed an optimum pressure range at which the emission intensity and the plasma parameters were maximized. They attributed these results to the interaction between the plasma plume and the ambient gas. It has been also reported that at high pressures, instabilities can appear at the plasma-gas interface, especially Rayleigh-Taylor (RT) instability (RT instability occurs when there are two fluids of different densities adjacent to each other and the lighter fluid is accelerated towards the denser fluid) [13, 27]. The physical processes occurring at this interface, again, were very complex and far from being completely understood at this date.
It can therefore be concluded from these various observations and comparisons of the contradictory published results, that the physics occurring during ablation is not only complicated, but also very sensitive to the experimental conditions. They indicate that there is no clear consensus on how laser-induced plasmas are influenced by their environment.
6
In this context, the primary objective of the present work is to conduct a thorough study of the interplay between the ablated plasma plume and the ambient gas. We present a deep study of analyzing the temporal and spatial evolution of an aluminum plasma in terms of spectral intensity, ne and Te within various environments, extending from vacuum (10‾7 Torr)
to atmospheric pressure (760 Torr), while using an inert gas like Ar and He, as well as a chemically active gas, N2. Moreover, we present in detail the effect of the background gas
composition on the plasma plume dynamics. Al was chosen as a typical target, on one hand, for which a remarkable amount of spectral characteristics and atomic data are known, which facilitates the interpretation of emission spectra from a wide variety of analytical techniques. On the other hand, Al is used in the applications of laser propulsion, where the plasma produced from an Al target is found to have a significant potential to be used as explosives and propellants. In addition, Al is used as an explosive to augment air blast, raise reaction temperatures, and create incendiary effects [28]. Moreover, Al is found to be a promising metal in the field of nanotechnology; in particular in nanoparticle synthesis for biomedical applications [29-31].
Finally, our experimental results are compared to previous studies in order to provide a comprehensive study of the correlation between the surrounding ambient conditions and the plasma plume dynamics.
This thesis is organized as follows: Chapter 1 contains a review of laser-matter interaction and the steps leading to plasma formation. Then, the temporal and spatial evolution of laser-induced plasma will be reviewed, followed by a description of various methods used for determining plasma ne and Te. A brief review of recent experimental works on
7
Chapter 2 is devoted to a detailed description of the experimental setup and of the data acquisition system. In addition, we present several parameters that were optimized and calibrated to enhance the accuracy and precision of the collected data for both temporal and spatial evolution. At the end of the chapter, the methods used to determine the ne and Te are
described.
Chapter 3 provides a comprehensive analysis of the temporal evolution of an Al plasma in terms of spectral intensity, ne and Te within various environments, extending from
vacuum to atmosphere, and using different ambient gases like Ar, N2 and He. Our
experimental results are compared to those available in the literature to establish some correlation between the surrounding ambient conditions and the plasma plume dynamics.
Chapter 4 presents the axial and radial spatial distribution of different plasma parameters as a function of time after the laser shot. Moreover, the effect of ambient gas pressure and composition is examined and compared to previous studies. Finally, the plasma expansion geometry is examined to provide a comprehensive understanding of the whole plasma evolution.
In chapter 5 we present an exhaustive study of the plasma plume dynamics under the effect of the ambient gas composition and pressure. Space- and time- resolved emission spectroscopic studies for Al ions at 281.6 nm were used to determine the Time-Of-Flight profiles (TOF). The effect of the ambient gases on the TOF profiles and therefore on the propagation velocity of Al ions is discussed. Furthermore, a correlation between the plasma plume expansion velocities, deduced from iCCD images and TOF profiles, is presented.
Finally, brief interpretations of the main results will be presented in the conclusion section. A few perspectives for future works will also be discussed.
8
References
[01] B. Sallé, D.A. Cremers, S. Maurice, R.C. Wiens and P. Fichet, Spectrochim. Acta B, 60(6), 805–815, 2005.
[02] J.L. Gottfried, F.C. De Lucia Jr, C.A. Munson and A.W. Miziolek, Anal. Bioanal. Chem., 395(2), 283–300, 2009.
[03] D.B. Chrisey and G.K. Hubler, Pulsed Laser Deposition of Thin Films, pp. 648. ISBN 0-471-59218-8. Wiley-VCH, 2003.
[04] R.S. Lee, H.J. Kim, J.E. Fischer, A. Thess, and R.E. Smalley, Nature, 388(6639), 255– 257, 1997.
[05] Z. Szymanski, J. Kurzyna and W. Kalita, J. Phys. D Appl. Phys., 30(22), 3153, 1997. [06] S. Yuasa, Y. Zhu and S. Sogo, Combust. Flame, 108, 387, 1997.
[07] L. Berthe, R. Fabbro, P. Peyre, L. Tollier and E. Bartnicki, J. Appl. Phys. 82, 2826, 1997.
[08] S. Zhu, Y.F. Lu, M.H. Hong and X.Y. Chen, J. Appl. Phys., 89, 2400, 2001. [09] K. Saito, T. Sakka and Y.H. Ogata, J. Appl. Phys., 94(9), 5530–5536, 2003.
[10] J.B. Wang and G.W. Yang, Journal of Physics: Condensed Matter, 11(37), 7089, 1999. [11] Y.F. Lu, S.M. Huang, X.B. Wang and Z.X. Shen, Appl. Phys. A Mater. Sci., 66(5),
543–547, 1998.
[12] Y.P Raizer, Gas Discharge Physics., (Berlin: Springer- Verlag), 1991.
[13] S.S. Harilal, C.V. Bindhu, M.S. Tillack, F. Najmabadi and A.C. Gaeris, J. Appl. Phys., 93(5), 2380–2388, 2003.
[14] L.J. Radziemski, T.R. Loree, D.A. Cremers, N.M. Hoffman, Anal. Chem., 55, 1246– 1252, 1983.
[15] K.J. Grant, G.L. Paul, Appl. Spectrosc., 44, 1349–1354, 1990. [16] J.B. Simeonsson, A.W. Miziolek, Appl. Opt., 32, 939–947, 1993.
[17] J.R. Freeman, S.S. Harilal, P.K. Diwakar, B. Verhoff and A. Hassanein, Spectrochim. Acta B, 87, 43–50, 2013.
[18] Y. Lee, K. Song, and J. Sneddon, “Laser induced plasmas for analytical atomic spectroscopy” ch. 5 in Lasers Analytical Atomic Spectroscopy, J. Sneddon et al. (Eds.), New York: VCH, 197–235, 1997.
9
[19] W. Sdorra and K. Niemax, Mikrochim. Acta, 107, 319, 1992.
[20] X. L. Mao, W. T. Chan, M. A. Shannon, and R. E. Russo, J. Appl. Phys., 74, 4915, 1993.
[21] H. Lindnera, K. H. Loperb, D. W. Hahnb and K. Niemax, Spectrochim. Acta B, 66, 179, 2011.
[22] S. Bashir, N. Farid, K. Mahmood and M.S. Rafique, Appl. Phys. A Mater. Sci., 107(1), 203–212, 2012.
[23] N. Farid, S. Bashir and K. Mahmood, Physica Scripta, 85(1), 015702, 2012. [24] Y. Iida, Spectrochim. Acta B, 45, 1353, 1990.
[25] G. Asimellis, S. Hamilton, A. Giannoudakos, and M. Kompitsas, Spectrochim. Acta B, 60, 1132, 2005.
[26] A. K. Knight, N. L. Scharbarth, D. A. Cremers, and M. J. Ferris, Appl. Spectrosc., 54, 331, 2000.
[27] A.K. Sharma and R.K. Thareja, Appl. Surf. Sci., 243(1), 68–75, 2005. [28] S. Yuasa, Y. Zhu and S. Sogo, Combust. Flame 108, 387, 1997.
[29] LG Gutwein, TJ Webster, American Ceramic Society 26 th Annual Meeting
Conference Proceedings, 2003, in press.
[30] M. H. Chowdhury, K.Ray, S. K. Gray, J. Pond, & J. R. Lakowicz, Anal. Chem.,81(4), 1397-1403, 2009.
[31] I. M. Sadiq, B. Chowdhury, N. Chandrasekaran, & A. Mukherjee, Nanotechnology, Biology and Medicine, 5(3), 282-286, 2009.
CHAPTER 1:
11
Chapter 1:
Theoretical Background
1.1 Introduction
Understanding the processes, which occur in laser-matter interaction, is the key to control and improve the laser-induced plasma properties in view of their applications. The process of removing material from a solid surface by focusing a short-pulse laser beam (~108 W/cm2) on a small volume of the target is known as laser ablation. Such interaction results in melting and evaporation of this focal volume, which will further interact with the laser beam to form a highly energetic plasma plume that consists of free electrons, excited atoms and ions. Wen et al. [1] pointed out that the rate of vaporization of the material is mainly dependent on the ambient gas pressure and not on the composition of the gas. Chan and Russo [2] showed that the ablation process is stoichiometric in this regime, owing to the more uniform non-thermal heating and the more explosive release of the ejected material. This suggests that the composition of the plasma plume is representative of the composition of the target material. Moreover, the produced plasma plume characteristics are extremely dependent on the laser beam parameters such as wavelength, intensity and pulse duration, irradiation spot size as well as on ambient pressure and gas composition. In addition, the physical, chemical and mechanical properties of the target material also play an important role in laser-induced ablation [3-5].
Many analyses and experiments have been conducted since the 1960’s in order to understand the physical mechanisms, the dynamics and the important factors that affect the plasma generated by laser ablation [6-9]. Herein and after, it is important to acquire detailed
12
information on the characteristics (ne and Te, atom and ion density, expansion rate, species
distribution, etc.) and the physical chemistry of the laser-induced plasmas.
The present chapter provides a basic framework for several concepts involved in laser plasmas starting with the definition of plasma and its parameters. Short notes about laser matter interaction and stages of plasma formation and explanation of temporal and spatial evolution of laser-induced plasma will be reviewed, followed by a description of various methods used for the measurements of ne and Te. Finally, we introduce a brief review of recent
experimental works on laser induced plasma. Throughout this review, plasma modeling approaches are also listed to enhance our knowledge of laser-induced plasma processes and dynamics.
1.2 What is Plasma?
Plasma is a quasineutral gas of charged and neutral particles, which exhibits a collective behavior [10].
Quasineutrality means that the negative and the positive charge densities are (almost) equal, which is the requirement for the plasma to resist against external potentials. Creating a plasma produces a cloud of electrons and positively charged ions, where electrons are more mobile than ions. Hence, we can visualize this charge cloud as stationary heavy ions surrounded by moving light electrons. If every ion is surrounded by enough electrons, a sphere with a zero net charge will be formed. The minimum radius of this sphere is known as the Debye length. Plasma is said to be quasineutral if the Debye length “D” is significantly less
than the plasma’s characteristic length “L”. Moreover, the Debye sphere is statistically valid when it contains a large number of particles “ND”.
To define the “collective behavior”, assume that we have an ordinary molecule, such as air molecules, which are generally neutral and so light that they are not affected by gravity. Consequently, they move undisturbed until they collide with another particle. Thus, in a neutral gas, the movements of the molecules are controlled by collisions. In contrast, plasma contains charged particles, so the motions of these particles create magnetic fields and regions of space with net positive or negative charges. These space charges create electric fields. The
13
Coulomb force that describes the electrostatic interaction decays only slowly as r−2, which resulting in a long-range force. At this moment, the motions of individual particles can no longer be described by local collisions, but each particle influences many nearby charged particles, which provide a collective behavior of the plasma.
One last difference that distinguishes a plasma from a neutral gas is that the plasma frequency is much larger than the electron-ion collision frequency. Assume plasma contains mobile electrons which are slightly displaced from the nearby ions, resulting for example from the random movements of electrons. Then the Coulomb restoring force will cause these electrons to oscillate about their equilibrium position. The periodic motion of the electrons is called the plasma frequency (fp, ωp=2πfp). If the frequency of this motion is greater than the
collision frequency of the individual particles υ, then the individual particle collisions can be ignored.
To summarize, a plasma must meet three requirements:
1. The Debye length is much less than the characteristic length of the plasma D<< L.
2. The number of charged particles within the Debye sphere is very large ND >>1.
3. The oscillation frequency of the plasma is large compared to the collision frequency of individual particles ωp˃˃υ.
1.3 Basics of Laser-Matter Interaction and Processes in Laser-Induced Plasma
In this section, the laser ablation process will be presented according to three steps: plasma ignition, plasma expansion and plasma cooling. Figure (1-1) summarizes these steps and the various mechanisms that they involve.When a ns laser pulse impacts a solid target material (metals, semiconductors or dielectrics), within the first few nanoseconds, the surface electrons acquire an electromagnetic energy and hence gain enough kinetic energy to leave the target surface [11]. As a consequence, a thermal ablation is the dominant mechanism during plasma ignition (i.e. the temperature of the solid surface increases and direct sublimation or melting occurs followed
14
by evaporation, boiling or phase explosion) as electrons and ions will be in thermal equilibrium and heating [12].
Target breakdown is not a well-defined processes but it consists of complex body of processes such as multi-photon ionization, coulomb explosion, cascade ion ionization, electrostatic ablation and thermal ablation, which are dependent on both the irradiated target and the ablation laser. In case of ns laser, the process of target breakdown is initiated by multi-photon ionization process which creates the seed electrons. These electrons produce ionizing collisions with the neutral atoms which yield to a cascade of electrons by an electron-ion inverse Bremsstrahlung (avalanche ionization). These processes can be described respectively as follow:
→ →
where A and A+ are the atoms or molecules of the target and the singly charged ion of the species and m is an integer number.
Accordingly, the plasma grows rapidly, producing an extremely energized cloud of electrons and ions, a plasma plume. During this stage of plasma ignition, laser irradiance and pulse duration controls the type of mechanisms and plasma properties. A detailed discussion of these complex processes and gas-dynamic aspects of laser-induced plasma propagation can be found in [13-15].
At that time, the emission is dominant by the background continuum (Bremsstrahlung radiation) resulting from electron–ion collision and recombination from the plasma free electrons. When sufficient number of electrons is generated, the dominant laser absorption mechanisms make a transition to electron-ion inverse Bremsstrahlung. Photo-ionization of excited states can also contribute in the case of interactions with short wavelength radiation. Although continuum background is very intense, the ion lines can rapidly be detected. The fast spatial growth in this step lasts for about hundreds of nanoseconds.
The preceding process leads to the next stage, where the plasma continues to grow for a few microseconds, but at a reduced rate. The various ion transitions present at early times are
15
detected and distinguished from the plasma plume background continuum emission. In this stage, the expansion strongly depends on the initial plasma properties (e.g. ne, Te and energy of
plume). Furthermore, the ambient gas begins to play an important role in the shape, size and speed of propagation of the plasma plume. The interaction of the plasma plume with the ambient gas can be described by two mechanisms, depending on the gas pressure and nature: (i) the expansion of the high pressure plasma compresses the surrounding gas and drives a shock wave; and (ii) the plume energy is transferred to the ambient gas by thermal conduction, by radiative transfer or by both of them.
Figure (1-1): Temporal development of laser-induced plasma processes and emission radiation. Inset Figure is taken from reference [16].
16
Plasma cooling takes place after about 1µs when the plume vapor temperature reaches the boiling temperature of the target material and stops at the condensation temperature of the material. At this step, the plasma begins to decay due to electron and ion recombination yielding neutral atoms and both Te and ne decrease. This recombination process lasts for tens
of microseconds. Consequently, the number of neutral atoms increases in the focal volume and the spectral lines associated with these neutral atoms are clearly observed during this period.
As the plasma cools drastically through radiative transfer and quenching processes, emission in the visible spectrum increases, continuum emission decreases, and distinct spectral lines become prominent. This time period lasts from approximately 1-40 μs following the laser pulse. It is ideal for capturing and analyzing atomic spectra that can be used for example in laser induced breakdown spectroscopy applications.
ne and Te further decays beyond 40 μs as atoms combine to form molecules. Molecular
spectral bands thus appear and are detected along with fading atomic lines. The plasma continues to emit out to hundreds of microseconds following the initial laser pulse, but the useful signal is strongly diminishes with time. The plasma completely ends when no more emission is detectable and the volume is almost fully occupied by neutral constituents at or near ambient conditions.
As discussed above, laser ablation involves complex non-linear physical and chemical mechanisms that span several orders of magnitude in time with respect to the different predominant emitting species under ambient conditions and to the different physical phenomena observed during the plasma expansion.
As a closing remark for this section, there are many challenges in obtaining quantitative and qualitative data about the spatial and temporal conditions. In order to overcome these challenges, most researchers have utilized the visible, near ultraviolet or near infrared spectral regions, due to the ease of using conventional spectrometers and also to the higher availability of atomic data for these spectral regions. However, VUV spectroscopy has been used to characterize the early phase of plasma generated in vacuum and for detecting the UV line emission from light elements in high ionization degree [17].
17
1.4 Laser plasma diagnostics
Laser plasma diagnostics are designed to provide information about microscopic and macroscopic parameters such as the number densities and temperatures of the different plasma species, i.e. ions, electrons and neutral atoms, as a function of space and time. Among the aforementioned, of prime importance are the magnitude and the temporal and spatial evolution of ne and Te, which are the key parameters of laser ablated plumes.
There are several diagnostic techniques employed for the determination of these parameters, which include plasma emission spectroscopy, laser-induced fluorescence, Langmuir probe, magnetic B-dot probe, self-excited electron plasma resonance spectroscopy, microwave and laser interferometry, and Thomson scattering. Thomson scattering is a direct and less theory-dependent diagnostic, but unfortunately, the very low cross-section of the underlying process makes the experimental technique very difficult in practice. In the other side, plasma spectroscopy diagnostic techniques, which will be described in details in the following section, can be divided into two categories: (1) optical emission diagnostic techniques, analyzing plasma emission spectra, and (2) diagnostics based on radiation introduced into the plasma such as laser-induced fluorescence or absorption spectroscopy. Plasma emission spectroscopy is the simplest and for many parameters the most appropriate diagnostic technique, though several approximations are required to interpret the emission spectra.
1.4.1 Emission spectroscopy techniques
Emission spectroscopy is an in-situ, non-intrusive method, selective to species and quantum level. It can provide an excellent spatial and temporal resolution. The most useful methods for determining the plasma parameters are based on the optically thin emission of spectral lines.
In the optical emission spectroscopic techniques, we have two main contributions to the spectrum, (1) emission from the plasma itself, including continuum and line radiation; (2) emission due to scattering of the incident laser light by different modes in plasma. In our
18
study, we will only consider the spontaneous emission, which provides information about the plasma temperature and the electron and ion densities.
Plasma emission consists of continuum radiation (Bremsstrahlung and recombination radiation) and line radiation. The Bremsstrahlung radiation is caused by free-free transitions and occurs when a free electron is accelerated by a scattering interaction with an ion. The electron is free before and after the acceleration process, hence the designation as free-free transition. This process takes place during the initial plasma expansion.
The recombination radiation or free-bound radiation occurs when an initially free electron is captured by an ion. The spectrum of recombination radiation will therefore show sudden jumps representing recombination in different energy levels. This process takes place when the plasma cools down during the relaxation process and it strongly depends on the ne,
the ion charge and Te.
Line radiation or bound-bound radiation occurs when transitions are made between bound states of an atom. The emission may come either from resonance transitions (transitions to ground state) or from transitions between different excited states. The intensity of the ion and atomic lines depends on the position in the plasma and reflects the local temperature of the plasma.
In laser plasmas, the spatial behavior of plasma emission shows that the Bremsstrahlung radiation is emitted close to the target surface. As the plasma plume expands away from the target, the line emission becomes dominated by radiation, the highly ionized lines being emitted close to the surface and the atomic lines farther from the plasma. The temporal behavior of the plasma emission is schematized in Figure (1-1) and it lasts for 10s to 100s of microseconds after plasma ignition until it cools down.
Measuring line intensity, broadening and shift can yield valuable information on electron and ion densities, temperatures and plasma motion. Several factors determine the line shape; these are the natural line broadening (quantum effect), the thermal motion of atoms (Doppler broadening), the interaction of the radiation system with plasma (pressure broadening), perturbation of the energy levels by the electric fields (Stark broadening and
19
shift) and by the magnetic fields (Zeeman Effect). Zehang et al. [18], came up with criteria to selecthe appropriate lineses for a better estimation of different plasma parameters:
(1) The lines must have reasonable line-to-background intensity ratio. (2) The spectral efficiency should be measured accurately.
(3) The greater the gap between the upper energy levels of selected lines, the better the accuracy of temperature measurement.
(4) The accuracy of spontaneous transition probability is relatively high.
(5) Special care should be taken to avoid the lines of self-absorption resonance or having low-lying energy levels.
Indeed, the determinations of the ne by the Stark broadening effect, as well as the
measurement of Te using the Boltzmann and Saha–Boltzmann equations require that the
spectral lines are optically thin. If this condition is not satisfied, that is, if the lines used for characterization suffer from self-absorption, their line profiles show distorted widths and areas that lead to wrong values of ne and Te. Optically thin plasma should satisfy the following
criteria [18] ;
(1) For the multiple lines of a species whose lower/upper terms have a single level, the intensity ratio of them is in accordance with the statistical weight ratio.
(2) The intensity ratio of two atomic lines having the same upper level energy should be within the limit defined by a branching ratio
(3) The optical depth of the plasma should be much lower than 1. (4) The value of self-absorption coefficient should be close to 1. (5) The curve of growth of the line should be a straight line.
In the experiments, a lens collected plasma emission from the ablation plume and the image is focused on the narrow entrance slit of the spectrometer. This slit spatially limits the plume image to its shape. This new image is focused via a series of mirrors onto an optical grating dispersing the emission into its many optical wavelengths. The resulting rectangle image is then imaged onto a rectangular CCD matrix. The CCD matrix is composed of a
20
rectangular array of pixels, which are individual photon detectors. Therefore, each column of the matrix corresponds to a particular wavelength. Plots of photon counts (corresponding to light intensity) as a function of wavelength are then produced by adding the total photon counts from all the pixels in a column and associating that count with the wavelength corresponding to that column. It's worth to note that the statistical error is reduced by repetitive sampling of the emission, which is generated in successive laser shots during wavelength scanning of the spectrometer.
It is obvious that, due to their transient nature, laser-induced plasmas are spectroscopic sources that display fast spatial and temporal evolution of their characteristic parameters such as the populations and temperatures of the various species present in the plume. For this reason, in plasma plume spectroscopy, measurements are usually carried out using time-resolved detection. In this way, it is possible to identify the line spectrum and its evolution as plasma expands and decays, and to isolate the strong continuum emission present at early times.
Depending on the required information and experimental conditions, a 100 ns resolution time is often sufficient to measure the evolution of the spectral line emission. However, for early continuum emission a shorter time resolution of nanosecond can be achieved by using a solid-state multichannel detector or a gated intensified charge-coupled device (ICCD) detector [17]. Radziemski et al. [13] used a linear diode array to gecharacterizeime resolution to characterise laser plasmas generated at atmospheric pressure. On the other hand, Sony George et al. [19] described the effect of ambient gas on the growth dynamics of plasma plume of multi-layered LiF-C thin film using an ICCD camera with 4 ns gate opening (integration time). Hermann et al.[20] used a fast ICCD to diagnose laser-induced plasmas generated with a femtosecond laser in air, He or Ar at pressures ranging from 10-2 to 105 Pa with an observation gate of 10 ns. Finally, Hermann et al.[21] used a fast photomultiplier to characterize the early continuum emission of laser-induced plasmas generated from a Ti target at a low pressure N2 atmosphere with a time resolution of 2 ns.
On the other side, laser-induced plasma parameters have significant gradients in the spatial distributions in both axial and radial directions. In the experimental point of view, the spatially-resolved characterization of laser-induced plasma depends on the selection of the
21
light collection system, the spectrometer and the detector [17]. The preferred setup system was carried out based on a fiber-optic cable, which prevents problems related to the dependence of focusing on wavelength in a very large spectral range and avoids the effects of chromatic aberration of focusing lenses. The emission of plasma plume was collected along the line-of-sight, the plasma parameters are population-averaged on the entrance of the fibre-optic by varying the position of the optical fibre in the image plane for axial measurements [21-23] and in the transverse plane for radial measurements [24]. Using the same procedure a two-dimensional grid of measurements of the plasma emission was also obtained [25].
1.4.2 Measurement of electron density
The electron density can be calculated from Stark broadening of lines, for densities typically ≥ 1014cm-3. Besides natural broadening and instrumental broadening, other causes such as Doppler broadening, pressure broadening and Stark broadening may also contribute to the line shape. Stark broadening is extracted from the line shape by removing the other types of non-Lorentzian broadening. Once other broadening components have been removed, a Lorentzian curve can be fitted to the Stark component. ne can be obtained from the full-width
at half maximum (FWHM) from the relation [26]
(1-1)
where ⁄ is the FWHM of the peak (in Å); ω is the electron impact parameter, which can
be found in the comprehensive text by Griem [27]. The Stark width is a function of the Te, but
this dependence is weak and it is most often neglected. Stark widths have been calculated for numerous transitions of the neutral and singly-ionized states of about twenty elements [27], with additional work currently underway [28, 29].
Experimental evidence indicates that the electron densities determined using the calculated width parameters are subject to 20% error. These errors are mainly due to the uncertainty on Stark width measurements and on the theoretical calculations of the Stark broadening parameter ω. On the other hand, the calculations of Stark width for ion lines have a lower accuracy than those of neutral lines [27].
22
Although Stark broadening cannot be easily distinguished from other competing broadenings, such as Doppler and instrumental broadening, the spectra could be corrected for these second-order effects, in order to prevent them from exaggerating the extent of Stark broadening [30]. Instrumental broadening was reduced as much as possible by minimizing the entrance slit width of a high-resolution spectrograph. The effects of Doppler broadening, , can be found through the relation:
(1-2)
where vz is the velocity of the emitting particle, c is the speed of light in a vacuum, and is the
transition wavelength. In laser-induced plasma, ne is large, so the effects of Doppler
broadening are expected to be small, and Stark broadening is the dominant broadening mechanism [30].
Other methods can be used to determine the ne, such as Stark shift and the
Saha-Boltzmann equation. In the Stark shift method, ne is determined from the wavelength shift of
the line profiles. The shift value is compared with those predicted by the approximated formula in Griem's book [27] that gives the total Stark shift dtotal as a function of the ne.
* + (1-3)
where d is the electron-impact shift parameter, A is the ion broadening parameter, which is a measure of the relative importance of the collisions with ions in the broadening, and neref is a
reference ne, usually of the order of 1016 or 1017 cm−3, at which the parameters ω and A are
measured or calculated. The parameters ω and A are weak functions of temperature. R is the ratio of the mean distance between ions and the Debye radius.
The determination of ne by the Saha–Boltzmann equation described in equation (1-5)
consists in using the Boltzmann plot method to obtain the plasma temperature, discussed in the next section. Then, one can introduce the temperature values in the Saha–Boltzmann equation to deduce ne. The calculated values of ne are within a factor of about 2 from that calculated