HAL Id: hal-01760252
https://hal.archives-ouvertes.fr/hal-01760252v2
Submitted on 30 Jan 2020
HAL is a multi-disciplinary open access
archive for the deposit and dissemination of
sci-entific research documents, whether they are
pub-lished or not. The documents may come from
teaching and research institutions in France or
abroad, or from public or private research centers.
L’archive ouverte pluridisciplinaire HAL, est
destinée au dépôt et à la diffusion de documents
scientifiques de niveau recherche, publiés ou non,
émanant des établissements d’enseignement et de
recherche français ou étrangers, des laboratoires
publics ou privés.
Optimization of the Upstream Bandwidth Allocation in
Passive Optical Networks Using Internet Users’
Behavior Forecast
Nejm Eddine Frigui, Tayeb Lemlouma, Stephane Gosselin, Benoît Radier,
Renaud Le Meur, Jean-Marie Bonnin
To cite this version:
Nejm Eddine Frigui, Tayeb Lemlouma, Stephane Gosselin, Benoît Radier, Renaud Le Meur, et al..
Optimization of the Upstream Bandwidth Allocation in Passive Optical Networks Using Internet
Users’ Behavior Forecast. ONDM 2018 : 22nd International Conference on Optical Network Design
and Modeling, May 2018, Dublin, Ireland. pp.1-6, �10.23919/ONDM.2018.8396107�. �hal-01760252v2�
Optimization of the Upstream Bandwidth Allocation
in Passive Optical Networks Using Internet Users’
Behavior Forecast
Nejm Eddine Frigui⇤, Tayeb Lemlouma†, St´ephane Gosselin⇤
Benoit Radier⇤, Renaud Le Meur⇤, and Jean-Marie Bonnin‡ ⇤Orange Labs, Lannion, France
†University of Rennes 1 IRISA, Lannion, France ‡IMT Atlantique, Cesson S´evign´e, France
nejm.frigui@orange.com, tayeb.lemlouma@irisa.fr, stephane.gosselin@orange.com benoit.radier@orange.com, renaud.lemeur@orange.com, jm.bonnin@imt-atlantique.fr
Abstract—The application of classification techniques based on machine learning approaches to analyze the behavior of network users has interested many researchers in the last years. In a recent work, we have proposed an architecture for optimizing the upstream bandwidth allocation in Passive Optical Network (PON) based on the traffic pattern of each user. Clustering analysis was used in association with an assignment index calculation in order to specify for PON users their upstream data transmission tendency. A dynamic adjustment of Service Level Agreement (SLA) parameters is then performed to maximize the overall customers’ satisfaction with the network. In this work, we extend the proposed architecture by adding a prediction module as a complementary to the first classification phase. Grey Model GM(1,1) is used in this context to learn more about the traffic trend of users and improve their assignment. An experimental study is conducted to show the impact of the forecaster and how it can overcome the limits of the initial model.
Index Terms—Passive Optical Network (PON), Clustering Analysis, Service Level Agreement (SLA), Grey Model GM(1,1)
I. INTRODUCTION
In the recent years, a change of paradigm in fixed access networks has been experienced. The fast emergence of Passive Optical Networks (PONs) allowed to carry huge amounts of traffic and to offer high bandwidth services to operators’ customers. However, the continuous exponential growth of data traffic in the next years as well as the expected widespread integration of Internet of Things, 5G networks, and high-speed services may impact the efficiency of the bandwidth allocation process. Dynamic Bandwidth Allocation (DBA) is currently the mechanism responsible for allocating the up-stream resources in PONs. To optimize the DBA performance, two approaches can be distinguished. The first consists in modifying the way in which the DBA works by acting on the algorithm itself and trying to invent a new mechanism that can overcome the limits of the existing one. The second relies on managing the external parameters of the DBA in a different way without modifying the DBA control algorithm itself at the Optical Line Terminal (OLT) level. The main difficulty of the first approach is the inability to be directly implementable from the operator perspective. Indeed, the DBA as a closed
control protocol in the PON network cannot be modified by the network operator who doesn’t have the total control of this mechanism due to equipment supplier dependency. In this regard, the second approach looks more suitable in a context of network resources optimization under the control of the network administrator.
In a recent work [1], we have proposed an architecture for optimizing the upstream bandwidth allocation in PON based on the dynamic adjustment of Service Level Agreement (SLA) parameters. The latter represent the input parameters of the DBA algorithm that can be managed by the operator. The idea was to efficiently exploit the bandwidth available in the network by adjusting dynamically the SLA parameters based on the estimation of users’ traffic patterns linked to daily life. Clustering analysis was used to identify heavy and light users based on their mean upstream bitrates for a specific time interval (e.g., 5 minutes). Then, an Assignment Index Calculator module was proposed to assign each user to a particular class (heavy, light, or flexible) for all the time series possessed by the network operator. The combination of the clustering analysis and the assignment index calculation allows to have an overall vision of the traffic profile of each user and makes it possible to estimate the possible behavior of a specific user at a specific time. In this case, the reallocation of the SLA parameters can be very useful and advantageous in the context of optimizing PON upstream resources for a specific day period. The evaluation phase that we have conducted in [1] was limited to the analysis of the clustering module in order to select which algorithm gives a better distribution of users. In this work, we continue the evaluation of the model that we have proposed in [1] by analysing the assignment index module and its impact on the user classification phase. Then, we extend the proposed architecture by adding a forecasting module as a part of a second user classification step that we suggest to be an improvement of the first classification method. The paper is structured as follows. Section II presents some work related to the DBA mechanism optimization, a summary of the initial model that we have proposed in a previous
work, its limits, and the need for a forecasting approach to deal with network users’ traffic behavior. Section III presents the enhanced version of the initial model using a forecasting module based on the GM(1,1) model. In section IV, we present simulations used to evaluate the classification techniques as well as the obtained experimental results and their analysis. Finally, we conclude our work in section V.
II. RELATEDWORK
The dynamicity of users’ traffic patterns lets always network operators thinking about new ideas to make the upstream bandwidth allocation mechanism more efficient. In the re-search world, many works [2]–[5] have been proposed in this context with the aim of enhancing the DBA overall operation. Despite their contribution at the optimization level, the majority of these works remain theoretical proposals that a network operator cannot directly integrate in its equipment due to the implementation nature of the DBA (a closed control protocol) and the dependency on a specific vendor.
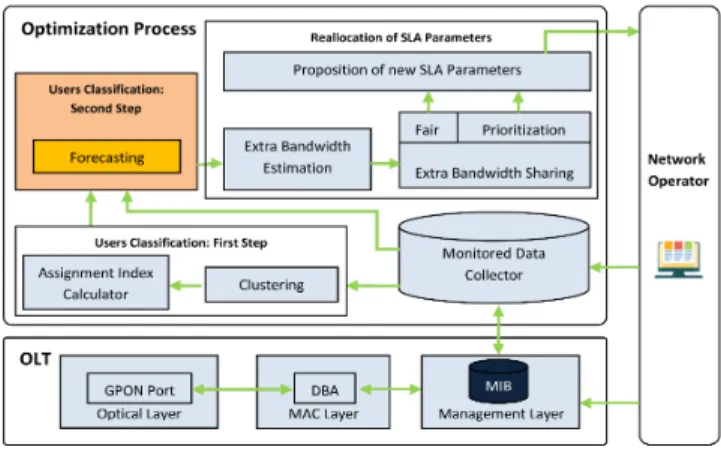
With the trend of using machine learning in the last few years, thoughts are directed towards approaches that have the character of being able to be managed and capable of learning over time. In this context, we have proposed in [1] a new model (Fig.1) for the optimization of PON upstream resources which stems from a very simple idea: analyzing the past customers’ behavior based on their historical data to estimate and reallocate their upstream bitrates in the future.
Fig. 1. The proposed model for optimizing PON upstream resources [1]
Indeed, in daily life, traffic patterns of different users may change several times per day. In this case, it is highly possible to have some customers who consume more bandwidth than others for a specific day period. The current DBA allows allocation of PON resources, depending on the instantaneous demand of each Optical Network Unit (ONU). However, each user is limited by predefined Peak Information Rate, which represents one of the SLA parameters which defines the max-imum bitrate that a user might benefit from. In this case, when the extra available bandwidth resulting from the presence of light ONUs is greater than the maximum bandwidth authorized to be allocated to heavy users, a part of the extra bandwidth will be lost and not exploited. For this, the idea was to try to exploit this extra bandwidth theoretically untapped by the
DBA in order to share it among heavy users without being limited by the constraints of the SLA parameters. As the goal is to propose an implementable approach by the operator in which the DBA algorihm should not be touched, the challenge is then to be able to model the functioning of the DBA while using the historical data provided by the operator and acting only on the DBA externally manageable parameters i.e., SLA parameters.
By analogy with the DBA process, four main components were proposed. The Monitored Data Collector gathers the traffic data for each ONU by requesting the Management Infor-mation Base (MIB) at regular intervals. This module connects also to the network operator in order to store the historical transmission data. As the DBA refers to the paquet queue status of each ONU to know its needs, two complementary modules responsible for the classification of different users depending on their historical transmission data were proposed. The clustering module classifies users into 3 classes: heavy, light, and flexible. Depending on the chosen algorithm, the results may vary. In [1], two well known clustering algorithms namely, K-Means [6] and DBSCAN [7] were evaluated. The results have shown that K-Means using a log10(Bitrate) metric
outperforms DBSCAN in terms of a more balanced customer distribution. The clustering module is supposed to be applied per time interval (e.g., 5 minutes). To be able to classify all users based on the entire time series, a second module called Assignment Index Calculator was proposed. This module aims to provide the probability for each user to be either heavy, light or flexible. For each day and for each time interval, it analyzes the clustering results. If the user belongs to the heavy class in a given time interval, his probability to be a heavy will increase and likewise for the light class. Then, a calculation process of the average of all probabilities associated to a standard de-viation calculation (for validation) is assured to finally assign each user to a specific class. The final users’ classification will be used then by the Reallocation of SLA Parameters module to define for each heavy user new temporary upstream bitrate allocation in a specific day period.
The purpose of using clustering analysis associated with an assignment index calculation process is to classify PON users depending on their traffic patterns. Although this approach is characterized by its high accuracy in the assignment of a PON user to a certain traffic class, it can lead to an unbalanced user distribution where the majority of ONUs will be assigned to the flexible users class. This may be an impediment to the overall objective which consists in maximizing as much as possible the satisfaction for the majority of customers. In this case, it is preferable to have a significant ratio of heavy and light users in order to maximize the efficiency of the band-width usage in the network. To resolve this issue, reference can be made to forecasting-based approaches that deal with the analysis and the prediction of network users’ traffic behavior in order to have an idea about the possible future trend of flexible users (whether heavy or light ). [8]–[10] represent some works related to the network traffic behavior forecasting in several types of networks. In general, we can distinguish two main
techniques for forecasting models: qualitative and quantitative approaches. The first technique relies on the knowledge and the experience of the forecaster who will take the final decision about the expected trend of data. The second one aims to identify the data patterns from the historical dataset in order to predict the future values [11] [12]. Quantitative approaches may be also classified into causal relationship methods and time series ones. While the first category tries to make a relationship between many factors in order to generate the forecasted values, the second is limited to the statistical data that was observed and collected over regular time intervals such as hourly, daily, weekly, monthly, etc [13].
Since the historical data required by the network operator to forceast users’ traffic behavior can be easily obtained and processed with the aim to classify the different customers, the focus will be on time series methods and especially on two major forecasting models, respectively Artificial Neural Networks and Grey theory. Artificial neural network (ANN) represents one of the most popular forecasting paradigms [14]. Classified as a machine learning approach, ANN has the ability to learn from complicated data and deduce its pattern and tendency. It can be very appropriate in the context of a knowledge-based learning mechanism that is difficult to specify [15]. By analogy to the human brain, ANN ensure the information process through the interaction of artificial neurons and can interpret the future behavior of a dataset despite the existence of noisy information [11] [15]. As for Grey forecasting theory [16], it was proposed for the first time in 1982. Thanks to its ability to estimate the possible data behavior based only on a few information samples even if they are incomplete, Grey theory becomes one of the most popular prediction approaches used in the research world [17]. The core and the most commonly used model of Grey is known as GM(1,1) [13]. The main task of this model is to identify the mathematical relationship between different points to learn about the behavior of the dataset and to make the right decision about the future trend [11].
In relation with our recent work [1], ANN and Grey model allow both to achieve our main goal concerning the forecasting of customers’ traffic behavior. However, we expect that only the Grey Model GM(1,1) remains for the moment the most appropriate for our usecase. This is due to the fact that the dataset we have is limited, which does not represent a problem for Grey systems which can even work with incomplete data. However, neural networks require a very large amount of data to ensure that the forecasted values are statistically accurate, which makes the learning speed slower [11] [18].
III. ENHANCEDMODELUSING AFORECASTINGMODULE
In this section, we propose the design of the enhanced model inspired by the first model [1] while the main novelty introduced lies in the integration of a forecasting module based on the GM(1,1) model. Fig.2 shows the architecture of the new proposed model.
We expect that the forecasting module will be considered as a second step of the users classification phase as it depends
Fig. 2. Enhanced model using a forecasting module
on the results of the clustering analysis and assignment index calculator modules. This new module will be applied particu-larly to the assignment indexes of flexible users while heavy and light ones will not be involved. Indeed, in our approach, a user can be flexible only if the averages of his assignment indexes to heavy and light users over the supervised days are smaller than 0.5 (the selected threshold). That is, the user does not tend to be neither heavy nor light. Since the index is calculated on the basis of historical data, cases like missing data or the lack of a vision on the traffic trend of users in the future will be often encountered. This can impact the calculation of the assignment index and subsequently the classification of users. In this context, the enhancement of the initial model by using a forecasting approach can be beneficial to have a more reliable and useful approach where a part of flexible users can be assigned to one of the other two classes. Accordingly, the extra bandwidth estimated and the number of beneficiary heavy users will increase automatically. Unlike the initial model where PON users are classified based on the whole set of supervised days, we propose in this work to classify customers per weekdays (from Monday to Friday) and per weekends (Saturday and Sunday). This aims to determine whether the online behavior of PON users is the same for weekdays as it is for weekends.
The mathematical formulation of the Grey forecasting Model GM(1,1) is illustrated below. We assume the initial data series with n (n 4)non-negative values as follows:
x(0)= (x(0)(1), x(0)(2), ..., x(0)(n)) (1) The Accumulated Generating Operation (AGO) is then applied since the initial data series may change randomly while there is a need to know its regular pattern [16]:
x(1)= (x(1)(1), x(1)(2), ..., x(1)(n)) (2) Where x(1)(k) =Pk
m=1x(0)(m), k2 [1, n]
The original form of the GM(1,1) model is:
Where a is the developing coefficient and b is the grey input according to the Grey theory. x(1)(k) can be replaced then
by the average of two consecutive neighbours x(1)(k) and
x(1)(k 1):
x(0)(k) + az(1)(k) = b, k2 [2, n] (4) Where z(1)(k) = 0, 5(x(1)(k) + x(1)(k 1))
According to the least square method, a and b can be identified as follow: A = a b = (B TB) 1BTY (5) Where: B = 2 6 6 6 6 6 6 4 z(1)(2) 1 z(1)(3) 1 . . . z(1)(n) 1 3 7 7 7 7 7 7 5 Y = 2 6 6 6 6 6 6 4 x(0)(2) x(0)(3) . . . x(0)(n) 3 7 7 7 7 7 7 5
By regarding the following differential equation as a shadow of Eq. (4):
dx(1)(k)
dk + ax
(1)(k) = b (6)
The GM(1,1) can be therefore established: b
x(1)(k + 1) = (x(1)(1) b
a)e
ak+ b
a (7)
As we have applied the AGO in the equation 2, we apply the inverse (IAGO) to obtain the forecasted value of the original data x(0):
b
x(0)(k + 1) = (1 ea)(x(1)(1) b a)e
ak (8)
IV. EXPERIMENTATION ANDRESULTS
In this section, we proceed to an evaluation of the user classification modules proposed in the initial model [1] and the enhanced one proposed in this work. The objective is to demonstrate that adding a forecasting module can give a more balanced distribution and consequently provide top customers satisfaction. The reference dataset used in this work relies on a real traffic traces collected within the Orange France network. The data collection was ensured by the use of a probe called OTARIE and equipped with a DAG (Data Acquisition and Generation) traffic capture card which has an Application Programming Interface (API) that allows reading the packets as they arrive on the network interface. 3447 ONUs belonging to the same OLT were supervised over a period of one month between the 2nd of November and the 3rd of December 2016. Given that the traffic traces do not cover the whole day, the day period theoretically qualified as the busiest which is between 9p.m and 12a.m was selected in order to analyze the behavior of the majority of subscribers.
As the customer traffic pattern is linked to daily life where the online behavior in the weekends may not be the same as the other weekdays, we decide to classify customers per weekday and per weekend. For display reasons, we decide to show the
results for a list of Wednesdays as a weekday and a list of Saturdays as day of the weekend. The accomplishment of the experiment relies on the use of Python scripts to evaluate the different algorithms and Matplotlib and Seaborn libraries to plot the different results in the most convenient way. Fig.3 and Fig.4 show the users rate for each class (heavy, light, and flexible) for Wednesdays and Saturdays of the supervised period. These rates are calculated for each day based on the assignment index of each user to the heavy or light classes, calculated once the clustering process based on the K-Means algorithm is finished. This index has been fixed at 0.5 and represents the probability of belonging to a specific class of users. The selected threshold 0.5 is the minimum value that must be chosen to remove any ambiguity concerning the classification step. Indeed, the sum of the assignment indexes to the heavy and light classes is always lower than 1. If we choose a threshold lower than 0.5, we may have cases where both indexes are above the selected threshold and therefore, users will be assigned to both classes at the same time.
Fig. 3. OLT user distribution for Wednesdays
Fig. 4. OLT user distribution for Saturdays
The analysis of the resulting user rates shows an absolute majority of flexible users compared to light and heavy ones as it was expected. This is confirmed for Wednesdays as well as Saturdays. To be able to show the impact of using our forecasting module on the users’ rate, we choose to work on a specific OLT PON Port instead of working on the whole OLT. This choice is more appropriate since our optimization approach is supposed to be applied per PON port. As for the whole OLT, Fig.5 and Fig.6 show the users distribution for
a PON port that connects 32 subscribers. Fig.7 presents the final distribution of the PON port users based on the average of their assignment indexes over all supervised days.
Fig. 5. A PON port user distribution for Wednesdays
Fig. 6. A PON port user distribution for Saturdays
Fig. 7. A PON port user distribution for Wednesdays and Saturdays
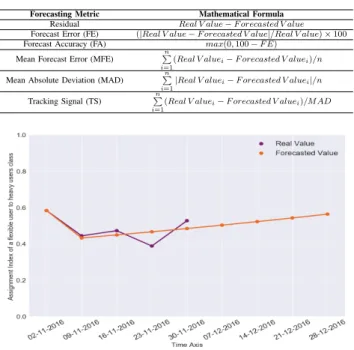
As mentioned in section III, the Grey forecasting model takes into account the different user distributions resulted from the combination of clustering analysis and assignment index calculation. While the heavy and light users are already selected with high precision, the flexible ones which represent the majority may tend to one of the other classes if we extend the dataset and generate more indexes. This can influence the final users distribution and consequently the extra bandwidth that will be estimated to be shared among heavy customers. Fig.8 and Table II highlight for a flexible user, the real values
of the assignment index to the heavy class for all Wednesdays in the supervised period, and the forecasted values while extending the dataset by 4 weeks. We evaluated our forecasting module based on GM(1,1) using the metrics presented in Table I.
TABLE I
MATHEMATICALFORMULAS OFFORECASTINGMETRICS Forecasting Metric Mathematical Formula
Residual Real V alue F orecasted V alue Forecast Error (FE) (|Real V alue F orecasted V alue|/Real V alue) ⇥ 100 Forecast Accuracy (FA) max(0, 100 F E)
Mean Forecast Error (MFE) Pn
i=1
(Real V aluei F orecasted V aluei)/n
Mean Absolute Deviation (MAD) Pn
i=1|Real V aluei
F orecasted V aluei|/n
Tracking Signal (TS) Pn
i=1
(Real V aluei F orecasted V aluei)/M AD
Fig. 8. Forecasted and real assignment indexes of a flexible user to the heavy users class for Wednesdays using GM(1,1)
TABLE II
ASSIGNMENT INDEX(AI)OF A FLEXIBLE USER TO THE HEAVY CLASS:
REAL AND FORECASTED VALUES
Day AI to Heavy UsersReal Value AI to Heavy UsersForecasted Value Residual Error (%)Forecast Accuracy (%)Forecast
02-11-2016 0,583 0,583 0 0 100 09-11-2016 0,444 0,432 0,012 2,702 97,298 16-11-2016 0,472 0,448 0,024 5,084 94,916 23-11-2016 0,388 0,465 -0,077 19,845 80,155 30-11-2016 0,527 0,483 0,044 8,349 91,651 07-12-2016 - 0,502 - - -14-12-2016 - 0,522 - - -21-12-2016 - 0,542 - - -28-12-2016 - 0,563 - -
-Mean Forecast Error (MFE) : 0,0006 Mean Absolute Deviation (MAD) : 0,0314 Tracking Signal (TS) : 0,095
The results demonstrate that the average of the assignment indexes to the heavy class for this flexible user increases from 0.4828 (using real values for the supervised days) to 0.505 (using real values for the supervised days and forecasted ones for the next 4 weeks), which qualifies it as a heavy user instead of a flexible one. The different metrics used to evaluate the GM(1,1) show high performances of this model with a good forecast accuracy (the minimum obtained is 80,155 %) and a low Mean Absolute Deviation. The Tracking Signal is generally used to decide if the forecasting model need or not to be reviewed. The low value that we have obtained for this parameter brings confirmation of the good quality of the GM(1,1) model. We performed the same approach for all flexible users belonging to the same PON port. The new
users classification is shown in Fig.9. Whereas before using
Fig. 9. A PON port user distribution for Wednesdays And Saturdays Using GM(1,1)
the forecasting model, the rate of flexible users was 87,5% for Wednesdays and 96,87 % for Saturdays, the application of the GM(1,1) shows a more balanced distribution where the flexible users rate decreases to 68,75% for Wednesdays and 75% for Saturdays. The fact that a part of flexible users tends to be heavy more than light for Wednesdays whereas it’s the opposite for Saturdays can be explained by making the analogy with the daily life of connected people where the most of them tend to go out on weekends more than weekdays. By looking to the new users’ distribution resulted from the application of the Grey model, it’s clear that the additional bandwidth that can be estimated will be greater since the number of light users has increased whether for Wednesdays or Saturdays. Additionally, the number of users who will benefit from the bandwidth supplement i.e., heavy users, has also increased, which asserts that the use of the GM(1,1) looks essential and advantageous in a context of satisfying the majority of customers in our approach.
V. CONCLUSIONS ANDFUTUREWORK
A new approach for enhancing PON users classification based on their traffic patterns has been proposed in this paper. In a previous work, we have proposed a mechanism for reallocating SLA parameters in a PON network based on their online behavior. This mechanism has as objective to optimize the upstream bandwidth allocation process without modifying the DBA itself. The idea was to classify PON users into 3 classes, heavy, light, and flexible and then, try to add an extra bandwidth to heavy users for a specific day period. The classification mechanism was designed based on clus-tering analysis and an assignment index calculation method. This mechanism is limited by the fact that the majority of users were assigned to the flexible class, which looks like an obstacle in our optimization approach. In this work, we referred to the Grey forecasting theory in order to predict the possible traffic behavior of flexible users in the future with the aim to have a more balanced distribution. Results have shown clearly the advantage of using this predictive approach to improve the final users distribution which impacts
directly the extra bandwidth estimation and the number of beneficiary customers. In a future work, we expect to proceed to the whole evaluation of the proposed model taking into account several QoS parameters. We also plan to have a third version of our model based on the self management aspect where our optimization mechanism will be integrated in a real platform and managed by the network itself without any human intervention.
REFERENCES
[1] N. E. Frigui, T. Lemlouma, S. Gosselin, B. Radier, R. Le Meur, and J.-M. Bonnin, “Dynamic reallocation of SLA parameters in passive optical network based on clustering analysis,” in 2018 21st Conference on Innovation in Clouds, Internet and Networks (ICIN) (ICIN 2018), Paris, France, Feb. 2018.
[2] D. Nowak, P. Perry, and J. Murphy, “Bandwidth allocation for service level agreement aware Ethernet passive optical networks,” in Global Telecommunications Conference, 2004. GLOBECOM ’04. IEEE, vol. 3, Nov 2004, pp. 1953–1957.
[3] S. i. Choi and J. Park, “SLA-Aware Dynamic Bandwidth Allocation for QoS in EPONs,” IEEE/OSA Journal of Optical Communications and Networking, vol. 2, no. 9, pp. 773–781, September 2010.
[4] B. Skubic, J. Chen, J. Ahmed, L. Wosinska, and B. Mukherjee, “A comparison of dynamic bandwidth allocation for EPON, GPON, and next-generation TDM PON,” IEEE Communications Magazine, vol. 47, no. 3, pp. S40–S48, March 2009.
[5] C. M. Assi, Y. Ye, S. Dixit, and M. A. Ali, “Dynamic bandwidth allocation for quality-of-service over Ethernet PONs,” IEEE Journal on Selected Areas in Communications, vol. 21, no. 9, pp. 1467–1477, 2003. [6] J. MacQueen et al., “Some methods for classification and analysis of multivariate observations,” in Proceedings of the fifth Berkeley sympo-sium on mathematical statistics and probability, vol. 1, no. 14. Oakland, CA, USA., 1967, pp. 281–297.
[7] M. Ester, H.-P. Kriegel, J. Sander, X. Xu et al., “A density-based algorithm for discovering clusters in large spatial databases with noise,” in Kdd, vol. 96, no. 34, 1996, pp. 226–231.
[8] P. Cortez, M. Rio, M. Rocha, and P. Sousa, “Multi-scale internet traffic forecasting using neural networks and time series methods,” Expert Systems, vol. 29, no. 2, pp. 143–155, 2012.
[9] R. Babiarz and J.-S. Bedo, Internet Traffic Mid-term Forecasting: A Pragmatic Approach Using Statistical Analysis Tools. Berlin, Heidel-berg: Springer Berlin Heidelberg, 2006, pp. 110–122.
[10] V. Alarcon-Aquino and J. A. Barria, “Multiresolution fir neural-network-based learning algorithm applied to network traffic prediction,” IEEE Transactions on Systems, Man, and Cybernetics, Part C (Applications and Reviews), vol. 36, no. 2, pp. 208–220, March 2006.
[11] L. Yi, X. Ke, and S. Junde, “Research on forecasting and early-warning methods,” in 2013 IEEE 9th International Conference on Mobile Ad-hoc and Sensor Networks, Dec 2013, pp. 570–576.
[12] M. Uysal and J. L. Crompton, “An overview of approaches used to forecast tourism demand,” Journal of Travel Research, vol. 23, no. 4, pp. 7–15, 1985.
[13] R. Jouini, T. Lemlouma, K. Maalaoui, and L. A. Saidane, “Employ-ing grey model forecast“Employ-ing gm(1,1) to historical medical sensor data towards system preventive in smart home e-health for elderly person,” in 2016 International Wireless Communications and Mobile Computing Conference (IWCMC), Sept 2016, pp. 1086–1091.
[14] J. Milojkovi and V. Litovski, “Ann versus grey theory based forecasting methods implemented on short time series,” in 10th Symposium on Neural Network Applications in Electrical Engineering, Sept 2010, pp. 117–122.
[15] G. Zhang, B. E. Patuwo, and M. Y. Hu, “Forecasting with artificial neural networks:: The state of the art,” International journal of forecasting, vol. 14, no. 1, pp. 35–62, 1998.
[16] J. L. Deng, “Introduction to grey system theory,” J. Grey Syst., vol. 1, no. 1, pp. 1–24, Nov. 1989.
[17] X. Wang, L. Qi, C. Chen, J. Tang, and M. Jiang, “Grey system theory based prediction for topic trend on internet,” Engineering Applications of Artificial Intelligence, vol. 29, pp. 191 – 200, 2014.
[18] J. Cannady, “Artificial neural networks for misuse detection,” in National information systems security conference, 1998, pp. 368–81.
![Fig. 1. The proposed model for optimizing PON upstream resources [1]](https://thumb-eu.123doks.com/thumbv2/123doknet/12406322.332484/3.892.75.440.619.811/fig-proposed-model-optimizing-pon-upstream-resources.webp)