Single and Multiple Domain Amnestic MCI: two sides of the same coin?
Brambati Simona Maria1, PhD, Belleville Sylvie1,2, PhD, MS, Kergoat Marie-Jeanne1,3,4, MD, Chayer Céline 3,4,5, MD, Gauthier Serge6, MD, Joubert Sven1,2, PhD.
1 Centre de recherche, Institut universitaire de gériatrie de Montréal (CRIUGM), Montréal (QC), 2 CERNEC et Département de psychologie, Université de Montréal,
Montréal (QC), 3 Clinique de cognition de l'Institut universitaire de gériatrie de Montréal, Montréal (QC), 4 Département de Médecine, Université de Montréal (QC), 5
Clinique de Mémoire de l'Hôpital Maisonneuve-Rosemont, Montréal (QC), 6 McGill Centre for Studies in Aging (MCSA), Montréal (QC)
Corresponding author:
Simona Maria Brambati
Centre de recherche de l’IUGM, 4565, chemin Queen Mary, Montréal QC H3W 1W5, Canada; Tel.: (514) 340-3540, ext. 4147; Fax: (514) 340-3548
simona.maria.brambati@umontreal.ca; simonabrambati@gmail.com
Key words: GM atrophy, Voxel Based Morphomery, amnestic MCI, AD
ABSTRACT
Background. Amnestic Mild Cognitive Impairment (aMCI) is considered a transition
stage between normal aging and Alzheimer's disease (AD). Two main clinical subtypes of aMCI have been identified: 1) aMCI single domain (aMCI-SD), with isolated episodic memory impairments, and 2) aMCI multiple domain (aMCI-MD), with episodic memory impairments and deficits in one or more other cognitive domains.
Aims.To map the pattern of gray matter (GM) atrophy associated with SD,
aMCI-MD and mild AD.
Methods. A group of aMCI-SD, aMCI-MD characterized by executive function disorders,
mild AD patients and cognitively unimpaired age-matched subjects underwent a comprehensive neuropsychological assessment and a high-definition MR brain scan. Voxel-based morphometry (VBM) analysis was used to characterize the GM tissue loss in each patient group, and the common pattern of GM atrophy in SD and aMCI-MD.
Results. The results revealed that aMCI-SD and aMCI-MD are characterized by a
common pattern of GM atrophy within the medial temporal cortex, predisposing to AD and correlating with the severity of verbal memory symptoms. Moreover, the pattern of GM atrophy observed in aMCI-SD, aMCI-MD and mild AD revealed that, from an anatomical point of view, these three clinical syndromes could represent three severity points along the continuum between normal aging and AD.
Key Words: Mild cognitive impairment, Alzheimer`s disease, voxel-based
INTRODUCTION
Alzheimer’s disease (AD) is a neurodegenerative disorder that progressively disrupts patients’ cognitive capacities. Although it is widely accepted that episodic memory impairment is the clinical hallmark of AD in the majority of cases [1] (for a review see [2]), deficits of executive functions [3, 4], semantic memory [5-8], and visuospatial abilities [9] have also been reported at the very early stages of the disease. From a neuropathological point of view, it has been suggested that the medial temporal cortex is the anatomical site of the first pathological alterations in AD [10, 11]. In fact, the neurofibrillatory pathology, highly correlated with neural and synapsis loss [12], would begin to compromise these regions years or even decades before the diagnosis of AD, when the disease is still considered ‘clinically silent’ [10]. The neuropathology would then spread through the limbic cortex and finally, at more advanced stages of the disease, to the isocortical association regions [10, 11].
Over the last 10-15 years, clinical research has focused on what is considered the preclinical phase of AD, i.e. the Mild Cognitive Impairment (MCI). MCI is defined as a cognitive decline greater than expected for an individual’s age and education level but that does not interfere notably with activities of daily life [13, 14]. Amnestic MCI (aMCI) is characterized by memory complaints and deficits have been consistently shown to be at high risk of progressing towards AD. In fact, about 10-15% of aMCI convert to AD yearly, a rate that is five times greater than that of healthy elders [14-17]. In aMCI, poor performance in delayed recall tests, as revealed by formal neuropsychological assessment [18-20], and brain damage (brain tissue loss and/or hypoperfusion) in the medial temporal regions [21-25] are considered key prognostic indicators of progression to AD.
Two main clinical subtypes of aMCI have been identified: 1) single domain aMCI (aMCI-SD), when memory is the only domain impaired, and 2) multiple domain aMCI
variant (aMCI-MD), when besides the memory deficit, at least another cognitive domain
is impaired (e.g. executive function, language, or visuo-spatial skills) [26]. It has been suggested that these two aMCI subtypes not only differ in their clinical manifestations, but that they are also associated with different outcomes. In fact, the rate of conversion to AD is considerably greater when memory deficits are associated with other cognitive deficits than when they are isolated [27], suggesting that aMCI-MD may represent a more advanced prodromal stage of AD. However, at present, it is not known whether single and multiple domain aMCI reflect different degrees of impairment along a continuum towards AD.
In the present study, we address this issue from an anatomical point of view by delineating the pattern of gray matter (GM) atrophy in aMCI single domain (aMCI-SD), aMCI multiple domain (aMCI-MD) and mild Alzheimer’s disease patients, by means of voxel-based morphometry technique. In order to minimize the clinical heterogeneity of our participant samples, only aMCI-MD subjects presenting an executive function deficit associated with the memory impairment were included in the study. If aMCI-SD and aMCI-MD represent two different severity stages on the continuum between normal aging and mild AD, we expect that: 1) they share a common pattern of GM atrophy reflecting the same underlying neuropathological mechanisms predisposing to AD; 2) The pattern of atrophy of each group of patients at a more ‘advanced stage’ of the disease should encompass the same regions found to be atrophied at earlier stage(s) of the disease.
METHODS Subjects
Participants were selected from a pool of patients fulfilling clinical criteria for Alzheimer’s disease (AD) or Mild Cognitive Impairment (MCI) recruited at the Alzheimer and Related Disorders Clinic of the McGill centre for studies in aging (MCSA) and at the Cognition Clinique of the Institut Universitaire de Gériatrie de Montréal. AD patients met the Diagnostic and Statistical Manual for Mental Disorders-IV [28] clinical criteria and the NINCDS-ADRDA research criteria for probable AD [29]. Only patients mild-AD, defined as those with a MMSE score [30] ≤ 24 and ≥18, were included in the study.
MCI met Petersen’s criteria [13]. According to the criteria, MCI showed (1) a cognitive complaint corroborated by an informant; (2) objective memory deficit (see below); (3) normal global functional level, as measured by a Mini-Mental Mental State Examination score ≥ 25 [30]; (4) no significant impact on normal daily activities, as assessed by the Functional Autonomy Measurement System (SMAF) or Instrumental Activities of Daily Living (IADL) scale and a clinical interview.
Amnestic MCI were classified into two subgroups, a subgroup of single domain amnestic MCI (SD) and a subgroup of multiple domain amnestic MCI (MD). aMCI-SD patients were identified based on the presence of an isolated memory impairment, as revealed by impaired performance (1.5 standard deviations below the average of age- and sex-matched healthy subjects) on at least one of the standard memory tests employed in the neuropsychological battery described below. In order to minimize the clinical
heterogeneity, only executive aMCI-MD subjects were included in the study. aMCI-MD patients were selected based on the presence of an executive function deficit accompanying the memory impairment. The executive function deficit was defined on the basis of a performance at least 1.5 standard deviations below normative values in the Stroop-Victoria test – 3rd plate subtest (see ‘Neuropsychological Battery’ section). MCI individuals without memory deficits (non-amnestic MCI) were not included in the study. A total of 35 patients were included in the study. Of these, ten met criteria for mild AD (age= 71.5±5.9, M/F=5/5), 11 for SD (age= 74.9±7.7, M/F=5/6) and 14 for aMCI-MD (age= 72.3±6.2, M/F=3/11).
Even though all patients underwent a high definition brain MRI scan, diagnosis was made blind to MRI images. Both AD and aMCI had a complete neurological and medical examination to exclude other neurological diseases or other factors that could account for their condition.
A group of 13 cognitively unimpaired individuals (normal controls - NC) (age= 75.0±5.1, M/F=5/8), as assessed by a neuropsychological screening battery, was recruited from the same community of AD and MCI patients (Table 1). Normal controls were matched by age, sex and education to AD and MCI patients. Exclusion criteria for all participants (both patients and healthy controls) included history of systemic or neurological disease (including cerebrovascular disease), past or current psychiatric illness, traumatic brain injury, former intracranial surgery, history of alcoholism or drug abuse, untreated medical or metabolic condition, general anesthesia in the last 12 months, and uncorrected hearing and vision problems.
The study was approved by the ethics committee on human research of the Centre de Recherche de l’Institut Universitaire de Gériatrie de Montréal (CRIUGM). All participants provided written informed consent before taking part in the study.
Neuropsychological Screening Assessment
Both patients and controls underwent a battery of standard tests in order to assess their
neuropsychological profile. General functional level was measured by means of the Mini Mental State Examination (MMSE) [30]. Verbal and visuo-spatial episodic memory were assessed with the Test de rappel libre/rappel indicé à 16 items (RL/RI-16), a commonly-used verbal test of free and cued recall in French-speaking populations [31, 32] and the immediate and delayed recall of Rey Complex Figure [33], respectively. Executive functions were tested by means of the Stroop-Victoria test [34], more specifically the subtest where subjects are asked to name the color of words written in different color ink (the Stroop-Victoria test – 3rd plate). Visuospatial abilities were evaluated using the copy of the Rey Complex Figure [33] and the Benton Line orientation Test [35], while semantic abilities were assessed using the 15-item version of the Boston Naming Test, BNT [36].
Statistical Analysis
A one-way ANOVA statistical analysis was carried out in order to assess for significant differences in each test score between the different groups. Specifically, the test score was entered in the model as dependent variable and the ‘group’ as four-level factor (NC, aMCI-SD, aMCI-MD, mild AD). For each test revealing significant differences among groups, post hoc pair-wise comparisons were performed using Tukey’s method.
All statistical analyses were performed using SPSS 16.0 software package for Windows (release 16.0.0, SPSS Inc., Chicago, IL).
Voxel-Based Morphometry Analysis Image Acquisition
MRI images were obtained on a 3T Siemens Trio MRI (Siemens, Erlangen, Germany) at the Unité de neuroimagerie fonctionnelle (UNF) of the Institut Universitaire de Gériatrie de Montréal (www.unf-montreal.ca). A volumetric magnetization prepared rapid gradient echo (MPRAGE) sequence was used to acquire high resolution T1-weighted 3D anatomical images, using the following parameters: TR = 2.3 sec, TE = 2.91 ms, TI = 900 ms, flip angle =9°, FOV = 240 x 256, voxel size = 1x1x1.2 mm3, 8-channel coil. Images were acquired in the horizontal plane, along the length of the hippocampal axis.
Voxel-Based Morphometry analysis
Voxel-Based Morphometry (VBM) analysis included two steps: spatial preprocessing (normalization, segmentation, Jacobian modulation and smoothing) and statistical analysis. Both steps were implemented in the SPM5 software package (Wellcome Department of Imaging Neuroscience, London; http://www.fil.ion.ucl.ac.uk/spm) running on Matlab 6.5.1 (MathWorks, Natick, MA).
Anatomical MRI images were spatially pre-processed using standard procedures [37]. All T1 structural images were segmented, bias corrected and spatially normalized to Montreal Neurological Institute (MNI) space using the unified segmentation procedure [38]. The VBM analysis was based on modulated gray matter images, whereby the gray matter value in each voxel is multiplied by the Jacobian determinant derived from the spatial normalization in order to preserve the total amount of gray matter from the
original images. These modulated gray matter images were smoothed with a Gaussian kernel (8 mm FWHM).
In order to test for GM volume difference among subject groups, a full-factorial ANOVA statistical design was employed entering the GM smoothed images as dependent variable, the group as a four-level factor, and sex and age as confounding covariates. In order to test for significant regional differences that cannot be ascribed to changes in total GM volume, a proportional scaling model was used.
Gray matter volume differences between patients and controls were assessed using the General Linear Model [39] and the significance of each effect was determined using the theory of Gaussian fields [40]. Specific statistical contrasts were set in order to identify the brain regions showing:
- Common GM atrophy in aMCI-SD and aMCI-MD (aMCI-MD vs. NC inclusively masked for the contrast aMCI-SD vs. NC at a threshold of p<0.005);
- GM atrophy in aMCI-SD, aMCI-MD and mildAD compared to normal controls (aMCI-SD vs. NC; aMCI-MD vs. NC; mildAD vs. NC).
When the whole-brain was explored, a threshold of significance of p<0.001 uncorrected was accepted. Within our a priori regions of interests (ROIs) based on previous neuroanatomical studies [10, 11, 24, 41], incuding temporal and frontal brain regions, a less conservative threshold of p<0.005 uncorrected was employed. The ROIs, including the bilateral temporal lobes, were drawn using the Anatomical Automatic Labeling brain atlas [42] and were applied to the SPM dataset by means of the Wake Forest University Pick Atlas toolbox [43].
RESULTS
Neuropsychological Screening Assessment (Table 1)
The one-way ANOVA revealed a group effect for all tests included in our neuropsychological battery. As revealed by the Tukey’s post-hoc analyses, the group effect was largely driven by the AD group for the majority of tests. AD subjects showed a lower performance than NC in all tests except for the Benton Line Orientation Test. Moreover, AD scores were lower than aMCI-SD in the Rey-Osterrieth Figure Recall subtests, the RL/RI-16 recall subtests, and in the Stroop-Victoria 3rd plate, and AD scores were lower than aMCI-MD in RL/RI-16 delayed and total free recall subtests and in the Stroop-Victoria 3rd plate (time). Both aMCI subgroups showed lower performance than NC in the verbal memory test, but only aMCI-MD revealed significant differences in the recall subtests of the Rey Complex Figure.
Consistently with our inclusion criteria, aMCI-MD showed a lower performance in the executive function ability score (Stroop-Victoria 3rd plate - number of errors) when compared to aMCI-SD. No significant differences were observed in other tests of the neuropsychological screening battery between aMCI-SD and aMCI-MD, although a trend towards significance was observed in tests assessing visuo-spatial memory (Figure 1).
Voxel-Based Morphometry
Pattern of common GM atrophy in aMCI-SD and aMCI-MD (Figure 2)
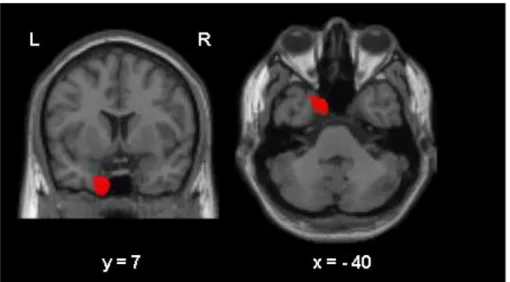
We observed a common pattern of GM atrophy in aMCI-SD and aMCI-MD confined to the left enthorinal cortex (x= -11, y= 10, z= -40, Z-score= 3.7, p<0.001 uncorrected) (Figure 2).
Post-hoc correlation analysis between left medial temporal cortex atrophy and cognitive scores
A post-hoc correlation analysis was performed in order to test the hypothesis of an association between the GM volume in the left medial temporal cortex and the performance in memory tests in the aMCI cohort. For each participant, the value of GM volume was extracted from a 6-mm radius sphere centered on peak of common atrophy in aMCI-SD and aMCI-MD (x= -11, y= 10, z= -40) by means of SPM5 software. A bivariate correlation statistical analysis was then run using SPSS statistical package in order to test the association between GM volume and the score in each test included in the neuropsychological assessment. The results showed a significant positive correlation between the GM volume in this area and the performance in tests assessing verbal memory (RL/RI-16: Delayed Free Recall, r=0.40, p<0.05; Delayed Total Recall, r=0.43, p<0.05), but not in tests assessing visuo-spatial memory (Rey Complex Figure: 3 min recall, r=0.30, p=0.15; 20 min recall, r=0.28, p=0.18) and semantic memory (Boston Naming Test, r=0.23, p=0.26), visuo-spatial (Rey Complex Figure copy: r=-0.01, p=0.94; Benton Line Orientation: r=-0.29, p=0.16) and executive function abilities (Stroop-Victoria Test: 3rd plate errors, r=-0.28, p=0.17; 3rd plate time (sec), r=-0.01, p=0.95).
Pattern of GM atrophy in aMCI-SD, aMCI-MD and mild AD (Table 2 and Figure 3)
aMCI-SD vs. NC
When compared to normal controls, aMCI-SD showed a pattern of GM atrophy mainly confined to the left medial temporal cortex, including the medial temporal lobe and the
left enthorinal cortex, and the bilateral superior frontal gyrus. At the subcortical level, brain areas of atrophy were also found bilaterally in the thalamus.
aMCI-MD vs. NC
When compared to normal controls, aMCI-MD showed a pattern of GM atrophy that included all regions that were found to be atrophic in the comparison between aMCI-SD and normal controls. In addition to what was observed in aMCI-SD, the aMCI-MD group showed a more extensive pattern of atrophy involving brain areas such as the lateral temporal cortex that were not damaged in the aMCI-SD sample. Specifically, aMCI-MD showed GM loss bilaterally in the inferior temporal regions, including the bilateral temporal gyri and the right fusiform gyrus, and in the anterior portion of the left superior temporal gyrus.
Mild AD vs. NC
When compared to normal controls, mild AD showed a pattern of GM atrophy that included all regions that were found to be atrophic in the comparison between aMCI-MD and normal controls. However, in addition to what was observed in aMCI-MD, the comparison between mild AD and normal controls revealed areas of GM atrophy in the right medial temporal cortex (medial temporal lobe and enthorinal cortex) spreading to the hippocampus and amygdala. The atrophy in the lateral temporal lobes also involved posterior regions of the left middle temporal gyrus and the right temporal pole. Within the frontal lobe, GM volume loss was observed in the left inferior frontal gyrus pars opercolaris, in addition to the bilateral superior frontal gyri, already found to be atrophic in both aMCI-SD and aMCI-MD.
DISCUSSION
In the present study, we aimed to identify the pattern of gray matter (GM) atrophy in patients with amnestic MCI single (aMCI-SD) and multiple domain (aMCI-MD) and mild AD. Our VBM anatomical results showed that: 1) aMCI-SD and aMCI-MD individuals share a common pattern of anatomical alterations within the medial temporal cortex predisposing to AD and revealing the common nature of these conditions; 2) the GM volume in this regions correlates with verbal memory scores, revealing the anatomical counterpart of the memory deficit observed in the neuropsychological evaluation; 3) from an anatomical point of view, we observed that aMCI-MD represents a transition stage between aMCI-SD and mild AD.
aMCI sample characterization
Amnestic MCI individuals were here classified as single domain (aMCI-SD) when the episodic memory impairment was isolated and as multiple domains when it was associated with an executive function deficit (aMCI-MD). Based on our inclusion criteria, 11 out of 25 aMCI (44%) were labeled as single domain, while 14 out of 25 (56%) as aMCI-MD, consistently with previous studies reporting that isolated memory impairments are generally less common than multiple cognitive domain deficits [25, 44, 45].
Overall, the neuropsychological assessment did not reveal significant score differences between aMCI-SD and aMCI-MD in any of the memory tests included in the neuropsychological screening battery. However, aMCI-MD showed a trend for lower performance in visuo-spatial memory tests, approaching the level of statistical
significance. This result could indicate that aMCI-MD do not only differ from aMCI-SD in the presence of a cognitive deficit associated with the memory impairment, but also in the severity of the memory deficit. A pattern of more severe memory deficit in aMCI-MD compared to aMCI-SD would provide support to the hypothesis that, from a neuropsychological point of view, aMCI-SD and aMCI-MD are two severity stages on the same continuum rather than two separate clinical syndromes. However, further neuropsychological studies aimed at better characterizing the nature of memory deficits in larger samples of aMCI-SD and aMCI-MD and follow-up data are necessary to confirm this hypothesis.
Common atrophy in aMCI-SD and aMCI-MD
The analysis of the common atrophy in aMCI-SD and aMCI-MD revealed that the two clinical subgroups share a common pattern of GM loss involving the left enthorinal cortex. The enthorinal together with the transenthorinal cortex have been identified as the anatomical sites of the first pathological alterations in AD [10, 11], that are believed to occur years before the dementia syndrome develops [10]. In previous anatomical studies, gray matter tissue loss in the antero-medial temporal lobe was observed in individuals with aMCI [45-48], who are considered to be in the prodromal stage of AD, but only in a small percentage of non amnestic MCI [25] who are considered at lower risk of progressing to AD. As a matter of fact, the presence of medial temporal atrophy can successfully predict the clinical progression to AD in individuals with MCI [22-25]. Here, for the first time, we showed that the atrophy in the antero-medial temporal cortex not only characterizes different clinical subtypes of aMCI, at high risk of progressing to
AD, but also that the degree of atrophy is significantly associated with the severity of the memory symptoms. Taken together, these data suggest that an in-depth evaluation of memory abilities and of anatomical features could represent valuable tools to identify aMCI individuals at risk of converting to AD. Moreover, these findings suggest that aMCI-SD and aMCI-MD may share a common underlying pathology, rather than reflecting two separate clinical entities.
Pattern of GM atrophy in aMCI-SD, aMCI-MD and mild AD
As predicted by the hypothesis that aMCI-SD, aMCI-MD and mild AD could represent three different severity points on the same continuum, the brain regions found to be atrophied in the more advanced stages involved the same brain regions found to be atrophied in the earlier stages. Specifically, the three clinical groups revealed a pattern of GM atrophy spreading from medial temporal areas to the limbic system at earlier stages and then to the associative areas of the neo-cortex at more advanced stages.
Medial temporal regions are more severely and more extensively atrophic in the left-hemisphere in aMCI-SD. A more severe degree of atrophy in the left compared to the right medio-temporal cortex has been previously reported in AD patients [49, 50]. This left-lateralized effect observed in anatomical studies may reflect a recruitment bias and may be influenced by the differential symptoms associated with the left and right medio-temporal atrophy. In fact, it is possible that aMCI individuals characterized by early visuo-spatial memory symptoms associated with right medio-temporal cortex atrophy rarely present at a neurology clinic; therefore they are less likely to be classified as aMCI early. These patients may consult their physician at later stages of the neurodegenerative
course, when more verbal aspects of the memory impairment (associated with left medio-temporal cortex atrophy) emerge and when the memory deficit becomes more evident. aMCI-MD individuals, who were characterized by executive function deficits based on our inclusion criteria, did not show more severe atrophy in frontal areas compared to aMCI-SD as expected. This could be explained by the fact that early executive function deficits in aMCI-MD may result from a disconnection between anterior and posterior cortical areas before subsequent atrophy in the prefrontal cortex can be detected, as previously proposed [51].
It must be noted that the anatomic results could be influenced by the fact that the aMCI-MD cohort includes more individuals with incipient AD compared to the aMCI-SD. In fact, longitudinal studies have shown that aMCI-MD have a greater risk of progressing towards AD than patients with single domain aMCI-SD [26]. Further studies with longitudinal follow-up should be performed in order to confirm this result.
Taken together, our findings suggest that aMCI-SD and aMCI-MD represent two degrees of severity along a continuum between normal aging and AD, rather than reflecting two separate clinical syndromes resulting from different etiological factors. Even if we are not allow to draw conclusions on the pathology based on GM atrophy data, the pattern of GM atrophy observed in aMCI-SD, aMCI-MD and mild AD when compared to healthy controls seems to mirror the different neuropathological stages of Alzheimer’s related changes described by Braak and colleagues [10, 11], with GM atrophy spreading from medial temporal areas to the limbic system at earlier stages and then to the associative areas of the neo-cortex at more advanced stages. In this context, aMCI-SD individuals
deserve particular attention for early intervention. Identifying the prodromal stages of AD may in fact allow us – once a specific treatment has become available – to slow down the neurodegenerative process before developing full-blown dementia.
AKNOWLEDGEMENTS
This research was supported by funds to SJ from the Fonds de recherche en Santé du Québec (FRSQ) and from the Alzheimer Society of Canada (ASC), and to SB from the FRSQ and from the Heart and Stroke Foundation/CIHR vascular cognitive impairment initiative. SMB fellowship is supported by the Canadian Institute of Health Research (CIHR), the CIHR Institute of Aging and the Fondation Institut universitaire de gériatrie de Montréal.
References
1. Greene J D, Baddeley A D, Hodges J R: Analysis of the episodic memory deficit in early Alzheimer's disease: evidence from the doors and people test.
Neuropsychologia 1996; 34(6): 537-51.
2. Collie A, Maruff P: The neuropsychology of preclinical Alzheimer's disease and mild cognitive impairment. Neuroscience & Biobehavioral Reviews 2000; 24(3): 365-374.
3. Perry R J, Hodges J R: Attention and Executive deficits in Alzheimer's disease: a critical review. Brain 1999; 122: 383-404.
4. Belleville S, Bherer L, Lepage É, Chertkow H, Gauthier S: Task switching capacities in persons with Alzheimer's disease and mild cognitive impairment. Neuropsychologia 2008; 46(8): 2225-2233.
5. Blackwell A D, Sahakian B J, Vesey R, Semple J M, Robbins T W, Hodges J R: Detecting dementia: novel neuropsychological markers of preclinical Alzheimer's disease. Dement Geriatr Cogn Disord 2004; 17(1-2): 42-8.
6. Hodges J R, Patterson K: Is semantic memory consistently impaired early in the course of Alzheimer's disease? Neuroanatomical and diagnostic implications. Neuropsychologia 1995; 33: 441-459.
7. Joubert S, Brambati S M, Ansado J, Barbeau E, Felician O, Lacombe J, Goldstein R, Chayer C, Kergoat M J: The nature of semantic memory impairment in mild cognitive impairment and early Alzheimer’s disease. Brain Submitted.
8. Joubert S, Felician O, Barbeau E, Didic M, Poncet M, Ceccaldi M: Patterns of semantic memory impairment in Mild Cognitive Impairment. Behav Neurology 2008; 19(1-2): 35-40.
9. Lambon Ralph M A, Patterson K, Graham N, Dawson K, R H J: Homogeneity and heterogeneity in mild cognitive impairment and Alzheimer's disease: a crosssectional and longitudinal study of 55 cases. Brain 2003; 126: 2350-2362. 10. Braak H, Braak E: Neuropathological stageing of Alzheimer-related changes.
Acta Neuropathol 1991; 82(4): 239-59.
11. Braak H, Braak E: Staging of Alzheimer's disease-related neurofibrillary changes. Neurobiol Aging 1995; 16(3): 271-284.
12. Nagy Z, Hindley N J, Braak H, Braak E, Yilmazer-Hanke D M, Schultz C, Barnetson L, Jobst K A, Smith A D: Relationship between clinical and radiological diagnostic criteria for Alzheimer's disease and the extent of neuropathology as reflected by 'stages': a prospective study. Dementia and Geriatric Cognitive Disorders 1999; 10(2): 109-14.
13. Petersen R C, Stevens J C, Ganguli M, Tangalos E G, Cummings J L, DeKosky S T: Practice parameter: early detection of dementia: mild cognitive impairment (an evidence-based review). Report of the Quality Standards Subcommittee of the American Academy of Neurology. Neurology 2001; 56(9): 1133-42.
14. Gauthier S, Reisberg B, Zaudig M, Petersen R C, Ritchie K, Broich K, Belleville S, Brodaty H, Bennett D, Chertkow H, Cummings J L, de Leon M, Feldman H, Ganguli M, Hampel H, Scheltens P, Tierney M C, Whitehouse P, Winblad B: Mild cognitive impairment. Lancet 2006; 367(9518): 1262-70.
15. Bennett D A, Wilson R S, Schneider J A, Evans D A, Beckett L A, Aggarwal N T, Barnes L L, Fox J H, Bach J: Natural history of mild cognitive impairment in older persons. Neurology 2002; 59(2): 198-205.
16. Petersen R C, Smith G E, Waring S C, Ivnik R J, Tangalos E G, Kokmen E: Mild cognitive impairment: clinical characterization and outcome. Arch Neurol 1999; 56(3): 303-8.
17. Yaffe K, Petersen R C, Lindquist K, Kramer J, Miller B L: Subtype of Mild Cognitive Impairment and Progression to Dementia and Death. Dementia and Geriatric Cognitive Disorders 2006; 22: 312-9.
18. Flicker C, Ferris S H, Reisberg B: Mild cognitive impairment in the elderly: predictors of dementia. Neurology 1991; 41(7): 1006-9.
19. Chen P, Ratcliff G, Belle S H, Cauley J A, DeKosky S T, Ganguli M: Cognitive tests that best discriminate between presymptomatic AD and those who remain nondemented. Neurology 2000; 55(12): 1847-53.
20. Ritchie K, Artero S, Touchon J: Classifi cation criteria for mild cognitive impairment: a population-based validation study. Neurology 2001; 56: 37-42. 21. Bennett D A, Schneider J A, Bienias J L, Evans D A, Wilson R S: Mild cognitive
impairment is related to Alzheimer disease pathology and cerebral infarctions. Neurology 2005; 64(5): 834-41.
22. Korf E S, Wahlund L O, Visser P J, Scheltens P: Medial temporal lobe atrophy on MRI predicts dementia in patients with mild cognitive impairment. Neurology 2004; 63(1): 94-100.
23. Stoub T R, Bulgakova M, Leurgans S, Bennett D A, Fleischman D, Turner D A, deToledo-Morrell L: MRI predictors of risk of incident Alzheimer disease: a longitudinal study. Neurology 2005; 64(9): 1520-4.
24. Whitwell J L, Shiung M M, Przybelski S A, Weigand S D, Knopman D S, Boeve B F, Petersen R C, Jack C R: MRI patterns of atrophy associated with progression to AD in amnestic mild cognitive impairment. Neurology 2008; 70(7): 512-20. 25. Geroldi C, Rossi R, Calvagna C, Testa C, Bresciani L, Binetti G, Zanetti O,
Frisoni G B: Medial temporal atrophy but not memory deficit predicts progression to dementia in patients with mild cognitive impairment. Journal of Neurology, Neurosurgery & Psychiatry 2006; 76: 1219-1222.
26. Petersen R C: Mild Cognitive Impairment: Current Research and Clinical Implications. Seminars in Neurology 2007; 27(1): 22-31.
27. Backman L, Jones S, Berger A, Laukka E, Small B: Multiple cognitive defi cits during transition to Alzheimer’s disease. Journal of Internal Medecine 2004; 256(195-204).
28. APA: Diagnostic and Statstical Manual of Mental Disorders, 4th ed. Fourth ed. 1994, Washington DC: APA.
29. McKhann G, Drachman D, Folstein M, Katzman R, Price D, Stadlan E M: Clinical diagnosis of Alzheimer's disease: report of the NINCDS-ADRDA Work Group under the auspices of Department of Health and Human Services Task Force on Alzheimer's Disease. Neurology 1984; 34(7): 939-44.
30. Folstein M F, Folstein S E, McHugh P R: "Mini-mental state" : A practical method for grading the cognitive state of patients for the clinician. Journal of Psychiatric Research 1975; 12(3): 189-198.
31. Van der Linden M, Collectif: L’épreuve de rappel libre / rappel indicé à 16 items (RL/RI-16), in L'évaluation des troubles de la mémoire - Présentation de qutre tests de mémoire épisodique (avec leur étalonnage), Solal, Editor. 2004: Marseille. p. 25-47.
32. Buschke H: Control of cognitive processing, in Neuropsychology of memory, L.R. Squire and N. Butters, Editors. 1984, Guilford: New York. p. 37-40.
33. Rey A: Le test de copie de figure complexe, ed. É.d.c.d.p. appliquée. 1959, Paris. 34. Regard M, Cognitive rigidity and flexibility: A neuropsychological study. 1981,
35. Benton A L, Varney N R, Hamsher K D: Visuospatial judgment. A clinical test. Arch Neurol 1978; 35(6): 364-7.
36. Calero M D, Arnedo M L, Navarro E, Ruiz-Pedrosa M, Carnero C: Usefulness of a 15-item version of the Boston Naming Test in neuropsychological assessment of low-educational elders with dementia. J Gerontol B Psychol Sci Soc Sci 2002; 57(2): P187-91.
37. Good C D, Johnsrude I S, Ashburner J, Henson R N, Friston K J, Frackowiak R S: A voxel-based morphometric study of ageing in 465 normal adult human brains. NeuroImage 2001; 14(1, Part 1): 21-36.
38. Ashburner J, Friston K J: Unified segmentation. Neuroimage 2005; 26: 839-851. 39. Friston K, Holmes A, Worsley K, Poline J-P, Frith C, Frackowiak R: Statistical
parametric map in finctional imaging: A general linear approach. Human Brain Mapping 1995; 2: 189-210.
40. Friston K J, Holmes A, Poline J B, Price C J, Frith C D: Detecting activations in PET and fMRI: levels of inference and power. Neuroimage 1996; 4(3 Pt 1): 223-35.
41. Boxer A L, Rankin K P, Miller B L, Schuff N, Weiner M, Gorno-Tempini M L, Rosen H J: Cinguloparietal atrophy distinguishes Alzheimer disease from semantic dementia. Archives of Neurology 2003; 60(7): 949-56.
42. Tzourio-Mazoyer N, Landeau B, Papathanassiou D, Crivello F, Etard O, Delcroix N, Mazoyer B, Joliot M: Automated Anatomical Labeling of Activations in SPM Using a Macroscopic Anatomical Parcellation of the MNI MRI Single-Subject Brain. Neuroimage 2002; 15(1): 273-289.
43. Maldjian J A, Laurienti P J, Kraft R A, Burdette J H: An automated method for neuroanatomic and cytoarchitectonic atlas-based interrogation of fMRI data sets. Neuroimage 2003; 19(3): 1233-1239.
44. Lopez O L, Becker J T, Jagust W J, Fitzpatrick A, Carlson M C, DeKosky S T, Breitner J, Lyketsos C G, Jones B, Kawas C, Kuller L H: Neuropsychological characteristics of mild cognitive impairment subgroups. Journal of Neurology, Neurosurgery & Psychiatry 2006; 77(2): 159-65.
45. Seo S W, Im K, Lee J M, Kim Y H, Kim S T, Kim S Y, Yang D W, Kim S I, Cho Y S, Na D L: Cortical thickness in single- versus multiple-domain amnestic mild cognitive impairment. NeuroImage 2007; 36(2): 289-97.
46. Whitwell J L, Petersen R C, Negash S, Weigand S D, Kantarci K, Ivnik R J, Knopman D S, Boeve B F, Smith G E, Jack C R: Patterns of atrophy differ among specific subtypes of mild cognitive impairment. Archives of Neurology 2007; 64(8): 1130-8.
47. Karas G B, Scheltens P, Rombouts S A R B, Visser P J, van Schijndel R A, Fox N C, Barkhof F: Global and local gray matter loss in mild cognitive impairment and Alzheimer's disease. NeuroImage 2004; 23(2): 708-716.
48. Chételat G, Landeau B, Eustache F, Mézenge F, Viader F, de la Sayette V, Desgranges B, Baron J C: Using voxel-based morphometry to map the structural changes associated with rapid conversion in MCI: a longitudinal MRI study. NeuroImage 2005; 27(4): 934-46.
49. Thompson P M, Hayashi K M, de Zubicaray G, Janke A L, Rose S E, Semple J, Herman D, Hong M S, Dittmer S S, Doddrell D M, Toga A W: Dynamics of gray
matter loss in Alzheimer's disease. Journal of Neuroscience 2003; 23(3): 994-1005.
50. Singh V, Chertkow H, Lerch J P, Evans A C, Dorr A E, Kabani N J: Spatial patterns of cortical thinning in mild cognitive impairment and Alzheimer's disease. Brain 2006; 129(11): 2885-93.
51. Collette F, Amieva H, Adam S, Hogge M, Van der Linden M, Fabrigoule C, Salmon E: Comparison of inhibitory functioning in mild Alzheimer's disease and frontotemporal dementia. Cortex 2007; 43(7): 866-74.
FIGURE LEGENDS
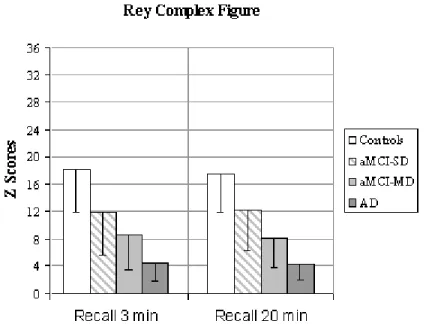
Figure 1. Performance of the four groups of participants at the Rey Complex Figure
Figure 2. Pattern of common atrophy in aMCI-SD and aMCI-MD (aMCI-MD vs. NC
inclusively masked for the contrast aMCI-SD vs. NC). The results are superimposed to a coronal (left) and axial (right) slice of a canonical T1 template. The coordinates reported below the brain sections correspond to the position of the slices within the MNI
stereotaxic space.
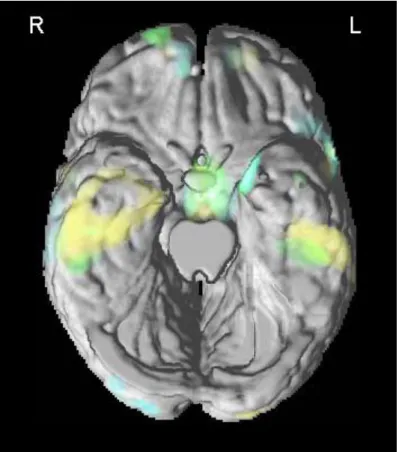
Figure 3. VBM results superimposed to the 3-D rendering of the standard MNI brain
without cerebellum showing the involvement of the temporal regions in aMCI-SD (green), aMCI-MD (yellow) and mild AD (light blue) compared to the control group.
TABLES
Table 1. Neuropsychological data for the four groups of participants. Overall ANOVA NC n=13 aMCI-SD n=11 aMCI-MD n=14 Mild AD n=10 Demographics Age (years) F(3,44)=0.9 75.0 (5.0) 74.9 (7.7) 72.3 (6.2) 71.5 (5.9) Education (years) F(3,44)=0.6 14.9 (5.0) 13.6 (3.6) 12.9 (5.2) 12.6 (4.7) Gender (M/F) χ²=2.5 5/8 5/6 3/11 5/5
General Functional Level
MMSE F(3,43)=35.3* 29.1 (1.2) 28.5 (1.0) 26.5 (1.8)a,c 22.5 (2.3)a,b,c
Neuropsychological Assessment Rey Complex Figure (max=36)
Copy F(3,44)=3.6* 33.1 (2.3) 29.5 (3.6) 28.6 (3.0)a 27.9 (7.4)a
Immediate Recall 3 min F(3,44)= 14.0* 18.1 (6.2) 11.9 (6.3)a 8.5 (5.0)a 4.5 (2.6)a,b
Delayed Recall 20 min F(3,42)=14.4* 17.5 (5.6) 12.2 (6.0) 8.2 (4.4)a 4.3 (2.3)a,b
RL/RI-16 (max=16)
Immediate free recall F(3,43)=14.8* 8.7 (2.5) 5.5 (1.7)a 4.9 (2.0)a 3.3 (1.2)a
Immediate total recall F(3,43)=13.8* 15.1 (0.8) 11.9 (2.5)a 11.1 (3.4)a 8.3 (2.4)a,c
Delayed free recall F(3,43)=21.9* 12.2 (2.0) 7.0 (2.3)a 6.4 (3.9)a 2.2 (2.9)a,b,c
Delayed total recall F(3,43)=19.2* 15.7 (0.6) 13.3 (2.8) 11.9 (3.1)a 6.9 (3.7)a,b,c
Stroop-Victoria Test
3rd plate errors F(3,42)=5.5* 1.3 (1.1) 1.0 (1.0) 3.3 (2.0)b 4.1 (3.9)a,b
3rd plate time (sec) F(3,42)=8.9* 27.9 (7.3) 30.6 (8.6) 43.8 (12.7) 73.4 (46.5)a,b,c
BNT (max=15) F(3,44)=4.0* 13.8 (1.3) 12.3 (2.1) 12.0 (2.1) 11.2 (2.9)a
Benton Line Orientation (max=30) F(3,35)=3.1 24.5 (3.1) 24.1 (4.1) 21.4 (3.1) 21.1 (3.2) Overall ANOVA:
* p<0.05 across all groups
Post-hoc pair-wise comparisons using Tukey’s method:
a
p<0.05 vs. NC; b p<0.05 vs. aMCI-SD; c p<0.05 vs. aMCI-MD Scores are reported as mean score (standard deviation).
Abbreviations: MMSE = Mini-mental state examination; RL/RI-16= rappel libre/rappel indicé à 16 items; BNT=Boston Naming Test.
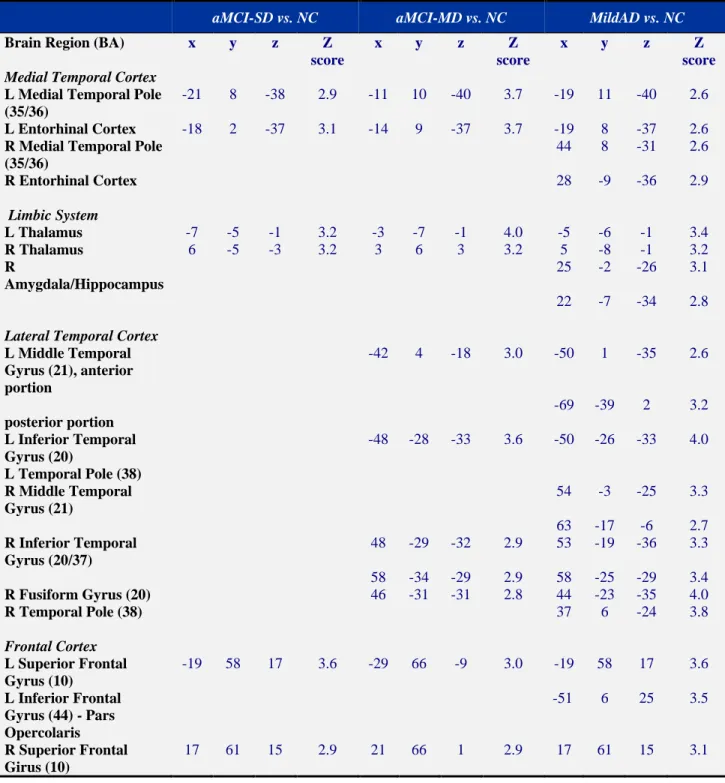
Table 2. Results of the VBM statistical comparisons.
aMCI-SD vs. NC aMCI-MD vs. NC MildAD vs. NC
Brain Region (BA) x y z Z
score
x y z Z
score
x y z Z
score Medial Temporal Cortex
L Medial Temporal Pole (35/36)
-21 8 -38 2.9 -11 10 -40 3.7 -19 11 -40 2.6
L Entorhinal Cortex -18 2 -37 3.1 -14 9 -37 3.7 -19 8 -37 2.6
R Medial Temporal Pole (35/36) 44 8 -31 2.6 R Entorhinal Cortex 28 -9 -36 2.9 Limbic System L Thalamus -7 -5 -1 3.2 -3 -7 -1 4.0 -5 -6 -1 3.4 R Thalamus 6 -5 -3 3.2 3 6 3 3.2 5 -8 -1 3.2 R Amygdala/Hippocampus 25 -2 -26 3.1 22 -7 -34 2.8 Lateral Temporal Cortex
L Middle Temporal Gyrus (21), anterior portion -42 4 -18 3.0 -50 1 -35 2.6 posterior portion -69 -39 2 3.2 L Inferior Temporal Gyrus (20) -48 -28 -33 3.6 -50 -26 -33 4.0 L Temporal Pole (38) R Middle Temporal Gyrus (21) 54 -3 -25 3.3 63 -17 -6 2.7 R Inferior Temporal Gyrus (20/37) 48 -29 -32 2.9 53 -19 -36 3.3 58 -34 -29 2.9 58 -25 -29 3.4 R Fusiform Gyrus (20) 46 -31 -31 2.8 44 -23 -35 4.0 R Temporal Pole (38) 37 6 -24 3.8 Frontal Cortex L Superior Frontal Gyrus (10) -19 58 17 3.6 -29 66 -9 3.0 -19 58 17 3.6 L Inferior Frontal Gyrus (44) - Pars Opercolaris -51 6 25 3.5 R Superior Frontal Girus (10) 17 61 15 2.9 21 66 1 2.9 17 61 15 3.1