HAL Id: hal-01180243
https://hal.archives-ouvertes.fr/hal-01180243
Submitted on 24 Jul 2015
HAL is a multi-disciplinary open access
archive for the deposit and dissemination of
sci-entific research documents, whether they are
pub-lished or not. The documents may come from
teaching and research institutions in France or
abroad, or from public or private research centers.
L’archive ouverte pluridisciplinaire HAL, est
destinée au dépôt et à la diffusion de documents
scientifiques de niveau recherche, publiés ou non,
émanant des établissements d’enseignement et de
recherche français ou étrangers, des laboratoires
publics ou privés.
Public Domain
Towards an Online Fuzzy Modeling for Human Internal
States Detection
Amir Aly, Adriana Tapus
To cite this version:
Amir Aly, Adriana Tapus. Towards an Online Fuzzy Modeling for Human Internal States Detection.
The 11th IEEE International Conference on Control, Automation, Robotics, and Vision (ICARCV),
Dec 2012, Guangzhou, China. �10.1109/ICARCV.2012.6485379�. �hal-01180243�
Towards an Online Fuzzy Modeling for Human
Internal States Detection
Amir Aly and Adriana Tapus
ENSTA-ParisTech, 32 Blvd. Victor, 75015, Paris, France Email:{amir.aly,adriana.tapus}@ensta-paristech.fr
Abstract—In human-robot interaction, a social intelligent
robot should be capable of understanding the emotional internal state of the interacting human so as to behave in a proper manner. The main problem towards this approach is that human internal states can’t be totally trained on, so the robot should be able to learn and classify emotional states online. This research paper focuses on developing a novel online incremental learning of human emotional states using Takagi-Sugeno (TS) fuzzy model. When new data is present, a decisive criterion decides if the new elements constitute a new cluster or if they confirm one of the previously existing clusters. If the new data is attributed to an existing cluster, the evolving fuzzy rules of the TS model may be updated whether by adding a new rule or by modifying existing rules according to the descriptive potential of the new data elements with respect to the entire existing cluster centers. However, if a new cluster is formed, a corresponding new TS fuzzy model is created and then updated when new data elements get attributed to it. The subtractive clustering algorithm is used to calculate the cluster centers that present the rules of the TS models. Experimental results show the effectiveness of the proposed method.
I. INTRODUCTION
The automatic recognition of emotions has recently received much attention from the robotics community in order to build a more intuitive human-robot interaction. Relevant acoustic features from voice signals such as pitch and energy are needed so as to reasonably recognize the expressed emotions. The fast developing human-robot interaction applications implies that robots become capable of dealing appropriately with different and varying situations and human emotions and affective intents. Traditional approaches for human internal states detec-tion are based on constructing a finite database with a specific number of classes and on performing a batch (offline) learning on the constructed database. However, the problems associated with the batch learning show the importance of processing data online for the following reasons: (1) avoiding storage problems associated with huge databases, and (2) input data comes as a continuous stream of unlimited length which makes a big difficulty in applying the batch learning algorithms. The absence of online learning methods can make the robot unable to cope with different interactional situations in an appropriate way due to an error in classifying a new internal state as being one of the internal states previously learnt, while its emotional content constitutes a new internal state category.
Many approaches are presented in the literature for the detection of human emotional and affective states from voice signal. The significance of prosody in conveying emotions is illustrated in [18], [7]. The authors present a comparative
study for the variation of some relevant parameters (such as pitch, voice quality, and articulation) under many emo-tional states. Moreover, Cahn in [7], explains the emoemo-tionally driven changes in the voice signal’s acoustic features under physiological effects in order to understand how the vocal acoustic features accompanying internal states differ. Roy and Pentland in [10], present a spoken affect analysis system that can recognize speaker approval versus speaker disapproval from child-directed speech. Similarly, Slaney and McRoberts in [23], propose a system that can recognize praise, prohibition, and attentional bids from infant-directed speech. Breazeal and Aryananda in [5] investigate a more direct scope for affective intent recognition in robotics. They extract some acoustic features (i.e., pitch and energy) and discuss how they can change the total recognition score of the affective intent in robot-directed speech. A framework for human emotions recognition from voice via gender differentiation is described in [30]. Generally, the results of the offline emotions recogni-tion in terms of the above menrecogni-tioned vocal characteristics are reasonable.
On the other hand, the importance of using fuzzy logic in modeling complex systems increased gradually in the last decade. It mimics human control logic by using an imprecise, but descriptive language to deal with input data. Zadeh in [33], [34], put the first theory of fuzzy sets after observing that the traditional mathematical definition of classes of objects in the real world is not sufficient because these classes may have imprecise criteria of membership. This observation remains valid for emotion classes; so that the emotion class “Anger” may have clear membership criteria in terms of the vocal acoustic characteristics with respect to the emotion class “Sad-ness”. However, it can have ambiguous membership criteria when compared to the emotion class “Happiness” because of the similarity of the acoustic vocal characteristics of the two emotional states. One of the main reasons behind this emotions ambiguity is that people show different amounts of spoken affect according to the personal and cultural characteristics. This validates the necessity of modeling the emotional internal states using fuzzy sets and linguistic if-then rules to illustrate the relationships between these sets. Fuzzy inference is the pro-cess of mapping a given input to an output using fuzzy logic, which provides a basis from which a decision could be made. The history of fuzzy inference systems reveals two major inference models: Mamdani [16] and Sugeno [26]. Mamdani in [16], stated the first fuzzy inference system designed for
controlling a steam engine and a boiler combination by a set of linguistic control rules obtained from experienced human operators. Meanwhile, Sugeno in [25], [26], developed another fuzzy inference system known as TS fuzzy model, which can generate fuzzy rules from a given input-output dataset. Clearly, TS fuzzy model is the model adopted in this study because we have an initial database of emotion labeled states constituting the input and output data necessary for defining the initial TS model. The relationship between these emotion states is presented by fuzzy sets. When new data arrives, whether a new TS fuzzy model is constructed corresponding to a newly created cluster or one of the existing TS models is updated according to the cluster to which the new data is attributed.
On the way for an online recognition system for human internal states, clustering algorithms have shown their impor-tance [4], [29]. Clustering is concerned with grouping data vectors based on their similarity (which generates specific data points “cluster centers” that construct the initial TS fuzzy rules indicated above). K-means algorithm defines the membership of each vector as belonging to only one cluster and not belonging to the rest of the clusters. Fuzzy C-means algorithm as proposed by Dunn [11] and then improved by Bezdek [4] is an extension of the K-means algorithm trying to include the fuzziness present in a data set. Thus, it indicates the membership degrees of data vectors to all of the existing clusters. However the data set and the number of clusters need to be defined a priori which makes it not applicable for our online recognition approach. Gustafsson and Kessel in [14], extend the standard Fuzzy C-means algorithm by employing an adaptive distance norm, in order to detect clusters of different geometrical shapes in one data set. However, as in the Fuzzy C-means algorithm, the number of clusters has to be defined a priori. Furthermore, the authors in [13], describe an unsupervised extension of the algorithm in [14] that takes the size and the density of the clusters into account. Unlike [14], their algorithm doesn’t request a priori knowledge about the number of clusters in the data set, but it suffers from other problems, such as: (1) the algorithm can get easily stuck to the local minima with increasing complexity, and (2) the resulting model is not transparent as it is hard to interpret the linguistic terms defined on the linear combination of the input variables. Other algorithms were proposed to overcome the drawbacks of the previous mentioned clustering algorithms. For example, the mountain clustering algorithm [31], [32], tries to find clus-ter cenclus-ters based on a density measure (mountain function) of a grid on the data space, in which cluster centers are the points with the highest density values. However, even if this algorithm is relatively efficient, its computation grows exponentially with the dimension of the problem. The subtractive clustering [8] solves this problem by using data points as candidates for the cluster centers, instead of constructing a grid each time when calculating a cluster center as in the mountain clustering. In this work, we choosed to use the subtractive clustering algorithm in order to identify the parameters of the TS fuzzy model [8], [26].
The rest of the paper is structured as following: Section II
presents a general overview of the basic and complex emotions. Section III presents the offline detection of human internal states. Sections IV and V overview the subtractive clustering and Takagi-Sugeno fuzzy model. Section VI describes the online updating of Takagi-Sugeno fuzzy model. Section VII provides a description of the experimental results, and Section VIII concludes the paper.
II. BASIC AND COMPLEX EMOTIONS
Emotions are one of the most controversial issues in human-human interaction nowadays, in terms of the best way to conceptualize them and interpret their role in life. They seem to be centrally involved in determining the behavioral reaction to social environmental and internal events of major significance for the needs and goals of a human [15], [20]. One of the main difficulties behind studying the objective of emotions is that the internal experience of emotions is highly personal dependant on the surrounding environmental circumstances and culture, and that many emotions may be experienced at the same time [20].
Many contemporary theories of emotion identify a relatively small set of basic or fundamental emotions which are meant to be fixed and universal to all humans, i.e., they can not be broken down into smaller parts. There are many diver-gence of opinion regarding the number of emotions. Some examples are Ekman [12] (6 basic emotions), Tomkins [28] (9 primary emotions), and Izard [15] (10 primary emotions). The differences between emotions are often more a matter of degree than of kind. More theories exist in the literature of emotions modeling. However, most of them don’t consider the evolutionary and combinatory nature of emotions which leads to a new advanced category of complex emotions that could be considered as mixtures of primary emotions based on cultural or idiosyncratic aspects.
Plutchik offers an integrative theory based on evolutionary principles [20]. He created a three-dimensional (Intensity, Similarity, and Polarity) circumplex wheel of emotions that illustrates different compelling and nuanced emotions (see Figure 1) based on a psychological-biological research study. The 8 sectors indicate that there are 8 primary emotions (anger, fear, sadness, disgust, surprise, anticipation, acceptance, and joy) arranged in four opposite pairs (different polarity; i.e. joy versus sadness). The circles present emotions of similar intensity; the smaller circle contains the emotions of highest intensity in each branch, while the second circle contains extensions of the first emotions in the first circle but in a lighter intensity, and so on. The blank spaces present the primary dyads which are mixtures of two adjacent primary emotions. However, the secondary dyads are mixture of two non adjacent primary emotions with one primary emotion in between (e.g. anger + joy = pride, or f ear + sadness = desperation). Meanwhile, tertiary dyads are mixtures of two non adjacent primary emotions with two primary emotions in between (e.g. f ear+disgust = shame or anticipation+f ear = anxiety). The Plutchik model is therefore the most appropriate model for this research paper.
Fig. 1. Plutchik [20] primary and mixture emotions are presented in a 2-D wheel or in a 3-D cone.
III. OFFLINE DETECTION OF INTERNAL STATES In this research, we investigate the performance of the offline classification system (using the support vector machine SVM algorithm) with 15 primary and complex emotions. Then, we create a fuzzy classification system and we train it on 6 primary emotions in addition to the neutral emotion (anger, disgust, happiness, sadness, surprise, fear, neutral). Whereas, the online test phase contains 5 complex emotions (anxiety, shame, desperation, pride, contempt), beside 3 primary emo-tions (interest, elation, boredom). It is remarkable that the emotion classes in the total database don’t have all the same intensity, and that there are extensions between 4 emotions in two cases: boredom-disgust and elation-happiness. This is due to the big difficulty to obtain well known databases with specific emotion categories that can cover all the mentioned emotions in Plutchik model. However, we used 3 databases (including around 1000 voice samples) in this research trying to cover this point as much as possible. These databases are: (1) German emotional speech database (GES) [6], (2) Geneva vocal emotion expression stimulus set (GVEESS) [3] 1, and
(3) Spanish emotional speech database (SES) [17]2.
For all voice samples from the three databases, relevant acoustic characteristics (pitch and energy) [5], are extracted in order to find out their possible effect on characterizing internal states. The internal state detection system normally includes three different processes: Speech Signal Processing, Features Extraction, and Classification.
A. Speech Signal Processing
Talkin in [27] defined the pitch as the auditory percept of tone, which is not directly measurable from a signal. Moreover, 1The stimulus set used is based on research conducted by Klaus Scherer,
Harald Wallbott, Rainer Banse and Heiner Ellgring. Detailed information on the production of the stimuli can be found in [3]
2The SES database is a property of Universidad Politecnica de Madrid,
Departamento de Ingenieria Electronica, Grupo de Tecnologia del Habla, Madrid (Spain)
it is a nonlinear function of the signal’s spectral and temporal energy distribution. Instead, another vocal characteristic (the fundamental frequency F 0) is measured as it correlates well with the perceived pitch.
Voice processing systems that estimate the fundamental frequency F 0 often have three common processes: (1) Sig-nal conditioning, (2) Candidate periods estimation, and (3) Post processing. Signal conditioning process tries to remove interfering signal components such as any extraneous noise by using low pass filtering which removes the apparent loss of periodicity in the voiced signal spectrum at higher frequencies, and by using high pass filtering when there are DC or very low frequency components in the signal. Candidate periods estimation step tries to estimate the candidate voiced periods from which the fundamental frequency F 0 could be calculated. Talkin [27] developed the traditional Normalized Cross Correlation (NCC) method [24], [21], in order to estimate reliably the voicing periods and the fundamental frequency F 0 by considering all candidates simultaneously in a large temporal context, in order to avoid the variation of the glottal excitation periods through the signal. This methodology uses two pass normalized cross correlation (NCC) calculation for searching the fundamental frequency F 0 which reduces the overall computation load with respect to the traditional (NCC) method. Post processing step uses median filtering in order to refine the calculated fundamental frequency F 0 and ignore isolated outliers.
B. Features Extraction
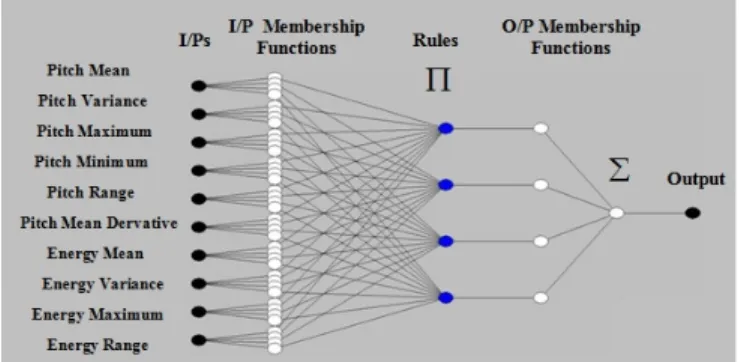
The authors in [22] present a detailed study concerning the common acoustic features used in the literature of emotion recognition and their significance. After trying many acoustic features in the offline classification process, we found that the most important acoustic features are: Pitch and Energy, upon which the recognition score highly depends. Meanwhile, other features (e.g. duration and rhythm) didn’t have a significant effect on the recognition score. Relevant statistical features are calculated in order to create relevant characteristic vectors used in constructing the database. The 10 extracted features, used in our work, are [5]: (1) Pitch Mean, (2) Pitch Variance, (3) Pitch Maximum, (4) Pitch Minimum, (5) Pitch Range, (6) Pitch Mean Derivative, (7) Energy Mean, (8) Energy Variance, (9) Energy Maximum, and (10) Energy Range.
C. Classification
Voice samples are classified using the support vector ma-chines (SVM) algorithm with a quadratic kernel function [9], [19], and the results are cross validated. Table I indicates the obtained recognition scores of 15 different internal states. The mean values of the recognition scores indicated in Table I reflect the high precision of our classification system with respect to similar obtained scores in the literature. In [6], the mean value of emotion recognition scores is 86.1%, while in [3] the mean value of emotion recognition scores is 60%, and in [17] the mean value of emotion recognition scores is 85.9%. The calculated recognition scores of emotional states de-pend on the performance of the actors in the database when
Emotions GES GVEESS SES All 3 DB mixed Anger 80.8% 88.7% 79.8% 81.7% Boredom 85.4% 87.1% - 90.1% Disgust 92.1% 91.7% - 93.5% Anxiety 87.3% 86.5% - 87.5% Happiness 86.9% 88.5% 75.1% 86.1% Neutral 83.7% - 89.5% 87.8% Sadness 86.9% 90.1% 94.1% 85.7% Surprise - - 95.7% 96.3% Interest - 89.3% - 90.4% Shame - 90.7% - 91.9% Contempt - 91.3% - 90.6% Desperation - 87.7% - 89.2% Elation - 89.9% - 87.5% Pride - 86.9% - 87.3% Fear - 85.7% - 89.7% Mean Value 86.2% 88.8% 86.8% 89% TABLE I
RECOGNITION SCORES OF DIFFERENT INTERNAL STATES. EMPTY SPACES ARE EMOTIONS NOT INCLUDED IN THESE DATABASES.
they simulate the emotions and on the amount of spoken affect they show. This may lead to a problem in real human-robot interaction scenarios when the expressed emotions to the robot are totally different in terms of their acoustic features from those of the similar emotions present in the database. Consequently, two scenarios may exist: (1) if the expressed emotion is intended to belong to one of the prescribed emotion classes in the database, it is probable that the robot mis-classifies it. This depends totally on the performance of the recognition system and on the training of the system. And (2) if the expressed emotion doesn’t belong to any of the existing emotion classes in the database, however the robot attributes it to the nearest existing emotion class (instead of constituting a new emotion class), which may lead to an action out of context. Therefore, in order to avoid any inappropriate robot behavior, it is important for the robot to understand if the online expressed emotion constitutes a new internal state class or not. This allows it to perform a neutral action different from the prescribed associated actions to the previously learnt emotions, which won’t make the performed action seems to be out of context to the interacting human.
IV. SUBTRACTIVE CLUSTERING
Subtractive Clustering [8] is a fast algorithm used for estimating the cluster centers in a set of data. It uses data points as candidates for the cluster centers, and then it calculates for each proposed cluster center a potential function which indicates how the proposed cluster center is affected by the surrounding points in the dataset.
Suppose a cluster composed of k normalized data points {x1, x2, ..., xk} in an M-dimensional space, where each data point is considered as a cluster center of potential P that could be presented as following (see Equation 1):
Pd= k X u=1 e−r24kxd−xuk 2 ; d∈ {1 · · · k}, (1)
where r is the neighborhood radius, that we fixed to 0.3 because it gave the best cluster centers calculation. After choosing the first cluster center (which is the data point with the highest potential value), the potential of other data points is calculated with respect to it. Let x∗1 be the location of the first cluster center and P1∗ be its potential value, the potential of each data point xd is reformulated as following (see Equation 2, where rb is a positive constant):
Pd⇐ Pd− P1∗e −4 r2bkxd−x ∗ 1k 2 | {z } X (2)
From the previous Equation, it is clear that the potential of each data point is subtracted by the amount X, which is a function of the distance between each point and the first cluster center. Consequently, data points near the first cluster center have reduced potential and so, excluded from the selection of the next cluster center. To avoid obtaining closely spaced cluster centers, the value of rb could be chosen greater than the value of the neighboring radius r (rb=1.5r) [8].
After calculating the reduced potential of all data points with respect to the first cluster according to Equation 2, the second cluster point is chosen as the highest potential value. This process is repeated (the potential of each data point is therefore reduced with respect to the last obtained cluster center) until a sufficient number of centers is reached.
Chiu in [8], proposed a criterion for accepting and rejecting cluster centers in order to define the final sufficient number of clusters. It defines two limiting conditions: lower (εP1∗) and upper (εP1∗) boundaries (where ε and ε are small threshold fractions). A data point is chosen to be a new cluster center if its potential (Pk) is higher than the upper threshold, and is rejected when its potential value is lower than the lower threshold. If the potential of the data point is between the upper and lower thresholds, a new decisive rule is used for accepting new cluster centers (see Equation 3):
dmin
r +
Pk
P1∗ ≥ 1, (3)
where dminis the shortest of the distances between xkand the locations of all the previously found cluster centers. Otherwise, the data point is rejected. According to Chiu in [8], the upper threshold (ε) is fixed to 0.5, while the lower threshold (ε) is fixed to 0.15. This approach is used for estimating the antecedent parameters of the fuzzy model. It relies on the idea that each cluster center represents a characteristic behavior (fuzzy rule) of the system.
V. TAKAGI-SUGENO (TS) FUZZY MODEL Takagi-Sugeno (TS) fuzzy model uses fuzzy rules, which are linguistic if− then statements involving fuzzy sets, fuzzy logic, and fuzzy inference. The fuzziness in the input sets is characterized by the input membership functions which could have many varying shapes (Triangular-Gaussian etc.) according to the nature of the modeled process.
Considering a set of n cluster centers {x∗1, x∗2, ..., x∗n} produced from clustering the input-output data space; each
vector x∗i is decomposed into two component vectors y∗i and
z∗i, which contain the coordinates of the cluster center in the input and output spaces in order (i.e. the number of input and output membership functions is determined by the number of cluster centers).
Suppose that each cluster center x∗i is a fuzzy rule, therefore for an input vector y= [y1, y2, ..., ym], the firing degree of the input vector’s component yj to the input membership function corresponding to the jth input component and the ith fuzzy rule y∗jiis defined as (see Equation 4) [2]:
µji= e(− 4 r2kyj−y ∗ jik2) ; i∈ {1 · · · n}, j ∈ {1 · · · m} (4) Thus, the total degree of membership of rule i with respect to the whole input vector is defined as following (see Equation 5): τi= µ1i(y1)× µ2i(y2)× · · · × µmi(ym) = m Y j=1 µji(yj) (5) The previous model is formulated in terms of linguistic If-Then fuzzy rule as (see Equation 6):
If y1is y1i∗ and · · · and ymis y∗mi
Then zi∗= b0i+ b1iy1+· · · + bmiym (6) where zi∗ is the corresponding linear output membership function to rule i. The input membership functions present generally a linguistic description of the input vector (e.g. small, big, etc). Thus, the first antecedent part of the rule (y1 is y∗1i· · · ) presents the membership level of the input y1
to the function y1i∗. The output vector z could be presented as the weighted average of rules contributions as following (see Equation 7): z = n X i=1 τiz∗i n P l=1 τl = n X i=1 γizi∗ (7)
The learning parameters of the consequent part of the rule could be estimated by the recursive least squares approach. Suppose λi = [b0i, b1i,· · · , bmi], Y = [1, y1,· · · , ym]T, so the previous Equation is reformulated in terms of all fuzzy rules as following (see Equation 8):
z = χϕ (8) where: χ = λ1 λ2 .. . λn , ϕ = [γ1Y, γ2Y,· · · , γnY ]
In our context, for an existing human internal state cluster, the given set of input-output data is used to define a cost function, from which the parameters set χ are calculated by minimizing the function (see Equation 9, where k is the number of data points within a cluster):
Fig. 2. TS fuzzy modeling example of a human internal state cluster
J =
k X d=1
(zd− χϕd)2 (9)
Equation 9 can be reformulated as (see Equation 10): J = (Z− χη)T(Z− χη) (10) where the matrices Z, η are functions in zd and ϕd. The least square estimation of χ is finally defined as following (see Equation 11):
ˆ
χ = (ηηT)−1ηZ (11)
A typical fuzzy modeling of a human internal state is illustrated in Figure (2), in which each vocal feature is mapped to a corresponding group of input membership functions equal to the number of rules. The output of the model is presented by the value of z calculated in Equation (7). When the acoustic features of a test voice sample are calculated, they get evaluated through the fuzzy model of each existing internal state. The decisive criterion of the internal state’s class to which the voice sample is attributed is defined as following (see Equation 12):
Class = argmaxα
p=1(zp) (12)
where α is the total number of existing clusters. VI. ONLINE UPDATING TS FUZZY MODEL The online update for the constructed TS fuzzy model is essential for continuous data streams. This requires an incre-mental calculation of the informative potential of the online incoming data [2], in order to decide if the new data confirms the information contained in the existing data clusters or if it constitutes a new cluster. When a new data element comes, it gets attributed to one of the existing clusters according to Equation (12), which leads to one of the 3 scenarios below: A. Scenario 1
The new data element is attributed with a good score to an existing internal state; consequently the robot/system implements the associated action to the winner class (taking into consideration the recognition scores of the internal states shown in Table I, and the possible variation in the spoken
affect shown by humans in real interaction, we consider this score (> 80%), which assures a high relative confidence but not absolute, which is inexistent). Moreover, the fuzzy modeling of the winner class is updated in order to get ready for the arrival of any new elements. The procedures of TS model update are summarized in the following pseudo code (n is the number of cluster centers):
1: if(PN EW > Pl∗),∀ l ∈ {1 · · · n} and the new data point is close to an old cluster center so that the following inequality is fulfilled:
PN EW maxPl∈{1···n}∗
-dmin
r ≥ 1 then
the new data point replaces the old rule center. go to: Scenario 3.
2: else if(PN EW > Pl∗),∀ l ∈ {1 · · · n} then the new data point will be accepted as a new cluster center x∗N EW and a new fuzzy rule is formed go to: Scenario 3.
3: elseThe new data point doesn’t have enough descriptive potential to update the TS model neither by creating a new rule nor by replacing an existing rule.
4: end if
For the steps 1 and 2 of the pseudo code, the consequent parameters of the TS model should be estimated recursively as indicated in Equations (7 to 11). However, for all the steps 1, 2, and 3, the potential of all cluster centers needs to be calculated recursively, because if the potential calculation measures the density level of groupings in the data space, this measure is reduced for an existing center if the data space increases by acquiring more data elements that increase, in turn, the potential of the data point PN EW if they have similar patterns, even in step 3 (see Equation 2).
B. Scenario 2
If the recognition score of the new data element with respect to the existing clusters doesn’t reach a specific threshold (< 80%), an uncertainty factor is considered. Consequently, the new data element is attributed temporarily to all the existing clusters in the same time with a specific label to distinguish it from normal data elements in each cluster and the robot/system implements a prescribed neutral action (different from the normal neutral action associated to the normal neutral emotion class). The main purpose of attributing temporarily the new data element XN EW to all the existing clusters is that when the potential of the new element is recursively calculated, it gets increased gradually if other uncertain new data gets attributed similarly to all clusters provided that they have a similar data pattern as XN EW. Meanwhile, the potential of the original centers of the clusters is reduced (see Equation 2). Thus, a new cluster is created if the potential of XN EW gets greater than the potential of all the original centers in each cluster, as indicated in the following pseudo code (where α is the number of existing clusters and n is the number of cluster centers):
1: if(PPN EW > Pp,l∗ ),∀ l ∈ {1 · · · n}, p ∈ {1 · · · α} then all the copies of the uncertain new elements of similar data patterns are removed from all the clusters and only one group of them creates the new cluster.
and α := α+1
and TS fuzzy model is created for the new class, go to: Scenario 1.
2: end if
In case of a new element that is attributed to a cluster with a confident score as in Scenario 1, the existence of temporarily uncertain data elements in this cluster doesn’t affect at all the potential calculation of the new data element with respect to all the original cluster centers; i.e. they don’t participate at all (in this case) in updating the TS fuzzy models of the clusters in which they exist, which explains the reason behind being labeled differently.
C. Scenario 3
During Scenario 2, it is possible that one of the uncertain data elements belong originally to one of the existing clusters and got classified as an element of uncertain emotional content because of the fact that people show emotional affect in different ways even for the same expressed emotion, which creates a big problem that is the necessity to train the classifier on unlimited emotional patterns for each cluster, which is not possible. Consequently, it is probable that the previous learning experience of the classifier isn’t sufficient enough to recognize the new data element with a confident score. In order to avoid this problem, in each moment that a cluster is updated by a new element recognized with a confident score as in Scenario 1, a revision on the uncertain elements of this cluster is performed by re-calculating the recognition scores of the updated cluster’s fuzzy model to the uncertain elements. If any uncertain element is recognized with a confident score by the fuzzy model classifier of the updated cluster, then this element joins the updated cluster and is eliminated from the uncertain data spaces in the other clusters, as indicated in the following pseudo code (where ω is the number of cluster’s uncertain data points, S denotes the recognition score, and k is the number of cluster’s certain data points):
1: do Scenario 1 (steps 1,2)
2: if(SP,u > 80%),∀ u ∈ {1 · · · ω}, p ∈ {1 · · · α} then the uncertain data point xp,u joins the correct cluster, and is removed from the other clusters.
and kP := kP+1 go to: Scenario 1. 3: end if
VII. EXPERIMENTAL RESULTS
The fuzzy classification system is trained on 7 emotions (anger, disgust, happiness, sadness, surprise, fear, neutral) and the results are cross validated (see Table II). The calculated
Emotions Recognition Score Anger 83.76% Disgust 75.60% Happiness 76.92% Sadness 69.57% Surprise 80.28% Fear 77.08% Neutral 82.14% Mean Value 77.91% TABLE II
RECOGNITION SCORES OF THE FUZZY SYSTEM’S TRAINING EMOTIONS
Emotions RMS Error Anger 0.0829 % Disgust 0.2221 % Happiness 0.2850 % Sadness 0.3051 % Surprise 0.1534 % Fear 0.1809 % Neutral 0.1056 % TABLE III
RMSERROR DURING TRAINING EPOCHS
scores are less than the similar obtained scores using the SVM algorithm (see Table I), however they remain acceptable results. The Root Mean Square error (RMS) values of the 7 emotions during training epochs (see Table III) reveal that the performance of the least squares algorithm in estimating the consequent parameters of the fuzzy models was reasonable. However, the obtained recognition scores were not as good as in Table I, because the SVM algorithm deals directly with the data space, meanwhile, the fuzzy classification system deals with the data space through an approximate TS model.
The online test database includes voice samples covering simple and mixture emotions from the databases in addition to some voice samples for the same emotions expressed in a noisy environment in our laboratory. These 8 emotions are: anxiety, shame, desperation, pride, contempt, interest, elation, and boredom. Table IV illustrates the results of attributing the data elements of the test database’s clusters to the existing clusters that the system was trained on. A small part of the test data elements was attributed with a confident score (> 80%) to the existing clusters which is unavoidable and depends totally on the patterns of the test data elements and on the performance of the actors when performing emotions. However, the results of classification are not totally out of context, like the elements of the anxiety class that were attributed to the fear class, and the elements of the elation class that were attributed to the happiness class.
The part of the new data attributed to the existing clusters (see Table IV) was assigned for the validation of Scenario 1 (section VI). The main problem encountered was the small number of the new data elements attributed to the existing clus-ters, and in most cases was not sufficient to update the fuzzy models of the clusters. Meanwhile, the elements attributed to the fear class were sufficiently descriptive to update the fuzzy
model, so that two new elements satisfied the steps 1 and 2 of Scenario 1.
On the other hand, the uncertain part of the new data (see Table IV) was assigned for the validation of Scenario 2 (section VI). Two new clusters were successfully constructed in case of the anxiety and boredom emotions. However, the number of elements in the other classes (shame, desperation, pride, contempt, interest, elation) was not sufficient to fulfill Scenario 2. Therefore, the elements of these classes are still considered as uncertain data elements until more data elements of similar patterns are acquired, then Scenario 2 is re-checked.
Real experiments with the Nao robot were implemented with different individuals. The voice signal of the interacting human is acquired via a wireless ear microphone (hidden from the angle of the video camera). A video showing our system working in a simple interaction with Nao robot is available at: http://www.ensta-paristech.fr/∼tapus/HRIAA/media/videos/ onlineEmotionsRobot AlyTapus.wmv.
The video is composed of 4 scenes recognizing 3 emotions belonging to the existing clusters in the database and 1 new emotion not included in the database. These emotions are: surprise, anger, boredom, and shame. The surprise and anger emotions were recognized successfully due to their distin-guished acoustic features patterns. Meanwhile, the boredom emotion was confused with the sadness emotion due to the similarity between their acoustic patterns, which made their recognition scores closed to each other. Last but not least, the online shame emotion was recognized correctly as a new emotion after some confusion with one of the previously learnt emotions (anxiety). In the beginning, the expressed shame emotion to the robot was not attributed with a confident score to any of the existing classes. However, the anxiety class was the nearest winner class, but the attained score was less than 80%. Therefore, Scenario 2 (see section VI) was applied. The expressed emotion was attributed to all the existing clusters, to which some data elements from the shame emotion database were added, as if they present previously attributed uncertain data to all the existing clusters. This was done so as to see to which extent the algorithm is able to detect the new emotion and to construct a new cluster.
VIII. CONCLUSION
This research illustrates an online fuzzy modeling for the human internal states. Our approach is based on the subtractive clustering algorithm that calculates the cluster centers of a data space. These centers present the rules of the TS fuzzy models that characterize emotion clusters separately. A decisive cri-terion based on a recursive potential calculation of the new data decides if the new elements constitute a new cluster or if they belong to one of the existing clusters. If a new cluster is constituted, a corresponding TS fuzzy model is created. Meanwhile, if the new data is attributed to one of the existing clusters, it may update the TS model of the winner cluster, whether by adding a new rule or by modifying existing rules according to its descriptive power.
New Data Uncertain New Data (Scenario 2) New Data Belonging to Old Data Clusters (Scenario1)
Anger Disgust Happiness Sadness Surprise Fear Neutral Anxiety 81.6% 0 0 0 2.5% 0 15.9% 0 Shame 73.3% 0 13.3% 0 0 6.7% 0 6.7% Desperation 68.75% 0 12.5% 0 6.25% 0 12.5% 0 Pride 73.3% 0 0 0 6.7% 6.7% 0 13.3% Contempt 62.5% 6.25% 0 0 6.25% 0 18.75% 6.25% Interest 75% 0 0 0 6.25% 6.25% 6.25% 6.25% Elation 68.75% 6.25% 0 12.5% 0 0 0 12.5% Boredom 69.8% 0 0 0 5.2% 0 23.9% 1.1% TABLE IV
CONFUSION MATRIX FOR THE CLASSIFICATION OF THE NEW DATA ELEMENTS AS UNCERTAIN-CLASS ELEMENTS OR AS A PART OF THE OLD CLUSTERS. THE PERCENTAGE VALUES REVEAL EACH ATTRIBUTED AMOUNT OF DATA WITH RESPECT TO THE TOTAL AMOUNT OF DATA.
When a new internal state is detected, the robot performs a neutral action at the beginning in order to avoid any inconsis-tency with respect to the human internal state. Progressively, the robot’s experience and awareness increase, which helps it to create a behavior from its own system by studying all the previous actions and interaction scenarios, in order to propose autonomously new relevant actions. This last point of automatic action generation is a wider scope of our research [1], that will study in parallel other ways to estimate human emotions (e.g. facial expressions and linguistic analysis) and will fuse all the obtained information together in order to arrive to the most precise detection of the human internal state.
REFERENCES
[1] A. Aly and A.Tapus. Speech to head gesture mapping in multimodal human-robot interaction. In Proceedings of the European Conference on
Mobile Robotics (ECMR), Orebro, Sweden, 2011.
[2] P. P. Angelov. Evolving rule-based models: A tool for design of flexible adaptive systems. In Springer-Verlag, Heidelberg, Germany, 2002. [3] R. Banse and K. R. Scherer. Acoustic profiles in vocal emotion
expression. Journal of Personality and Social Psychology, 70:614–636, 1996.
[4] J.C. Bezdek. Pattern Recognition with Fuzzy Objective Function
Algo-rithms.Pattern Recognition with Fuzzy Objective Function Algorithms.
New York: Plenum Press, 1981.
[5] C. Breazeal and L. Aryananda. Recognition of affective communicative intent in robot-directed speech. Autonomous Robots Journal, 12:83–104, 2002.
[6] F. Burkhardt, A. Paeschke, M. Rolfes, W. Sendlmeier, and B. Weiss. A database of german emotional speech (http://database.syntheticspeech.de). In Proc. of Interspeech, Germany, 2005.
[7] J. Cahn. Generating expression in synthesized speech. In Master’s thesis,
MIT Media Lab, USA, 1990.
[8] S. Chiu. Fuzzy model identification based on cluster estimation. Journal
of Intelligent and Fuzzy Systems, 2(3):267–278, 1994.
[9] N. Cristianini and J. Shawe-Taylor. Introduction to support vector machines. Cambridge University Press, 2000.
[10] D.Roy and A. Pentland. Automatic spoken affect analysis and classifica-tion. In Proceedings of the 2nd International Conference on Automatic
Face and Gesture Recognition, Vermont, USA, 1996.
[11] J.C Dunn. A fuzzy relative of the isodata process and its use in detecting compact well-separated clusters. Journal of Cybernetics, 3:32–57, 1973. [12] P. Ekman, W. V. Friesen, and P. Ellsworth. What emotion categories
or dimensions can observers judge from facial behavior? In P. Ekman
(Ed.), Emotion in the human face. New York: Cambridge University Press, 1982.
[13] I. Gath and A. B. Geva. Unsupervised optimal fuzzy clustering. IEEE
Trans. on Pattern Analysis and Machine Intelligence, 11:773–781, 1989.
[14] D. Gustafsson and W. Kessel. Fuzzy clustering with a fuzzy covariance matrix. In Proceedings of the IEEE CDC, pages 761–766, San Diego, CA, USA, 1979.
[15] C. Izard. Face of Emotion. Appleton, New York, 1971.
[16] E.H. Mamdani and S. Assilian. An experiment in linguistic synthesis with a fuzzy logic controller. International Journal of Man-Machine
Studies, 7(1):1–13, 1975.
[17] J.M. Montero, J. Gutierrez-Arriola, S. Palazuelos, E. Enriquez, S. Aguil-era, and J.M. Pardo. Emotional speech synthesis: from speech database to tts. In Proceedings of the International Conference on Spoken Language
Processing’98, pages 923–925, 1998.
[18] I.R. Murray and J.L. Arnott. Toward the simulation of emotion in synthetic speech: A review of the literature on human vocal emotion.
Journal of the Acoustical Society of America, 93(2):1097–1108, 1993.
[19] J.C. Platt. Fast training of support vector machines using sequential mininal optimization. In Microsoft Research Technical Report
MSR-TR-98-14, 1998.
[20] R. Plutchik. The Nature of Emotions. University Press of America, Lanham, MD, 1991.
[21] L. R. Rabiner, B. S. Atal, and M.R. Sambur. Lpc prediction error: analysis of its variation with the position of the analysis frame. IEEE
Trans. on Systems Man, and Cybernetics, 25:434–442, 1977.
[22] J. Rong, G. Li, and Y-P.P. Chen. Acoustic feature selection for automatic emotion recognition from speech. Information Processing and
Management, 45:315–328, 2008.
[23] M. Slaney and G. McRoberts. Baby ears: A recognition system for affective vocalizations. In Proceedings of the 1998 International
Conference on Acoustics, Speech, and Signal Processing (ICASSP),
Seattle, USA, 1998.
[24] M. M. Sondhi. New methods of pitch extraction. IEEE Trans. Audio
and Electroacoustics, 16:262–266, 1968.
[25] M. Sugeno. Industrial applications of fuzzy control. Elsevier Science Pub. Co., 1985.
[26] T. Takagi and M. Sugeno. Fuzzy identification of systems and its application to modeling and control. IEEE Trans. on Systemsm Man,
and Cybernetics, 15:116–132, 1985.
[27] D. Talkin. A robust algorithm for pitch tracking. In Speech Coding and
Synthesis, pages 497–518. W B Kleijn, K Paliwal eds, Elsevier, 1995.
[28] S. S. Tomkins. Affect theory. In K. R. Scherer and P. Ekman, editors,
Approaches to emotion, pages 163–195. Hillsdale, NJ: Erlbaum, 1984.
[29] V. Vapnik. Statistical Learning Theory. Adaptive and Learning Systems. ed. S. Haykin. John Wiley and Sons, 1998.
[30] T. Vogt and E. Andre. Improving automatic emotion recognition from speech via gender differentiation. In Proceedings Language Resources
and Evaluation Conference (LREC 2006), 2006.
[31] R. R. Yager and D. P. Filev. Approximate clustering via the mountain method. In Technical Report MII 1305, Machine Intelligence Institute, Iona College, New Rochelle, 1992.
[32] R. R. Yager and D. P. Filev. Learning of fuzzy rules by mountain clustering. In Proceedings of SPIE Conference on Applications of Fuzzy
Logic Technology, pages 246–254, Boston, MA, 1993.
[33] L.A. Zadeh. Fuzzy sets. Information and Control, 8(3):338–353, 1965. [34] L.A. Zadeh. Outline of a new approach to the analysis of complex systems and decision processes. IEEE Transactions on Systems, Man,
![Fig. 1. Plutchik [20] primary and mixture emotions are presented in a 2-D wheel or in a 3-D cone.](https://thumb-eu.123doks.com/thumbv2/123doknet/7762277.255295/4.918.125.384.80.361/fig-plutchik-primary-mixture-emotions-presented-wheel-cone.webp)