Science Arts & Métiers (SAM)
is an open access repository that collects the work of Arts et Métiers Institute of
Technology researchers and makes it freely available over the web where possible.
This is an author-deposited version published in: https://sam.ensam.eu Handle ID: .http://hdl.handle.net/10985/6915
To cite this version :
Laurent FLACELIERE, Franck MOREL, André DRAGON - Competition between mesoplasticity and damage under HCF – Elasticity/damage shakedown concept - International Journal of Fatigue - Vol. 29, n°12, p.2281-2297 - 2007
Any correspondence concerning this service should be sent to the repository Administrator : [email protected]
Competition between mesoplasticity and damage under
HCF – Elasticity/damage shakedown concept
Laurent Flacelierea, , , Franck Morelb, 1, André Dragona
a E.N.S.M.A., Laboratoire de Mécanique et de Physique des Matériaux (LMPM), UMR CNRS 6617, Site du Futuroscope,
BP 109, 86960 Futuroscope Cedex, France
E.N.S.A.M., Laboratoire Procédés Matériaux Instrumentation (LMPI), UMR 1427, 2 boulevard du Ronceray, BP 93525, 49025 Angers Cedex, France
Abstract
The aim of this paper is to present new modelling dedicated to multiaxial high cycle fatigue (HCF), and applied to polycrystalline metals. The model presented is based on the experimental characterization of damage during HCF tests, under pure tension and torsion modes. The origin of this approach is a mesoscopic model considering three plastic behaviour stages (hardening, saturation and softening) suggested by Papadopoulos [Papadopoulos I.V. Fatigue limit of metals under multiaxial stress conditions: the microscopic approach. Technical Note No. I.93.101, Commission of the European Communities, Joint Research Centre; 1993. [ISEI/IE 2495/93].], and used by Morel [Morel F. A critical plane approach for life prediction of high cycle fatigue under multiaxial variable loading. Int J Fatigue 2000;22:101–119.]. The principal evolution brought in by this study is a competition description during all the sample lifetime of the plasticity and damage effects. The plasticity mechanisms induce a hardening saturating effects (resulting from movement and accumulation of dislocations), especially significant at the beginning of the crystal life. Damage, present at the end of crystal lifetime, is considered as a degradation process inducing a strong reduction of the crystal ductility, leading to its failure (decohesion). The coexistence and the competition between these two effect (hardening and damage-induced softening) describe cyclic crystal behavior, including shakedown phase. The model is formulated in the framework of the continuum damage mechanics, according to the identified physical mechanisms during the tests.
The second purpose is to compare the model predictions with experimental data, after identification of the parameter for a ferritic-pearlitic steel. The case of in-phase loading is merely studied here. In particular, the evolution of a few internal variables is discussed and correlated with the available physical features. It is shown that this model provides a complementary insight into a crystal with respect to the endurance criterion of Dang Van. The model predicts, in a particular stress amplitude range, the damage growth arrest.
Keywords
High cycle fatigue; Multiaxial loading; Continuum damage mechanics; Mesoscopic scale; Life prediction;Multiaxial fatigue; Damage model; Mesoplasticity; Experiment
1. Introduction
The fatigue damage is difficult to predict and analyse, as it is very sensitive to variable characteristics and properties of the microstructures. Moreover, the corresponding failure modes are much scattered, especially in HCF. The sensitivity of fatigue degradation to the loading path is also well known. An increase of 5% of the stress amplitude, or a phase variation between two stress components for multiaxial loading, can change drastically the material reponse. Other effects can affect the fatigue strength: stress distribution near critical points, surface quality (roughness), physico-chemical environment, microstructural gradient at the surface, etc. [3].
The present study focuses on the effects due to the stress history, especially on the influence of tension, torsion and combined tension–torsion loading on the fatigue strength. The fields of the limited and unlimited endurance are explored (lifetimes ranging from 105 to 107 cycles).
The observation of crack nucleation and propagation at the mesoscopic scale is one objective of this work. The characterisation of the damage evolution involving generally a set of micro or meso cracks, will be more particularly detailed.
In the model developed is parallel to experimental study, the authors try to integrate some concepts of the continuum damage mechanics to describe the grain and/or the system of grains degradation until the crack initiates. The damage evolution is deduced from a strong coupling with the cyclic plasticity occuring at the mesoscopic scale.
A short literature survey presents two mesoscopic approaches of damage estimation devoted to HCF of metals. A two scale model proposed by Lemaitre [4], and applied in many further studies related to HCF (Lemaître et al. [5] and [6], Doudard [7]) was built in the framework of continuum damage mechanics. Another approach proposed by Papadopoulos considered the crystal behavior with three successive mesoplastic behaviour phases [1]. These two models form the background of the new proposal. After the observation and the identification of crack initiation and first crack growth mechanisms for a mild steel, a new model built within a thermodynamic framework is proposed. The identification procedure and the predictions are then discussed especially for combined proportional loading paths.
2. The two scale modelling by Lemaitre et al.
Lemaître et al. attempted, since the eighties, to extend the framework of the continuum damage mechanics to the field of fatigue. In HCF, macroscopic plasticity is most of the time negligible, and crack initiation is due to localized plasticity. Two scales were introduced considering that the HCF damage takes place on a lower scale than the engineering scale (e.g. the macroscopic scale) [4]. The study is focused on a microscopic spherical inclusion working in elasto-plastic regime with damage, localised in a macroscopic infinite elastic or elasto-plastic matrix (Fig. 1). During the lifetime of the part, the damage propagation will involve the reduction of the mechanical strength of this inclusion.
Fig. 1. Diagrammatic representation of the construction of the two’s scale model [5].
The damage measurement of the inclusion is considered by a scalar value, denoted as D, and based on the concept of the effective stress, first proposed by Kachanov [8]. From this definition, this approach remains, in a first time, purely macroscopic, and postulates explicit damage effect on stress state (1), through a stiffness loss. This modelling uses the well-known concept of effective stress to carry out the coupling with the damage effect:
(1)
The stress localisation – the term expressed here is a scale transition, namely a passage of the matrix scale to the inclusion scale – is carried out by following the analysis of Eshelby [9], within the
framework of the self-consistent models [10]. The mesoscopic stress tensor σ can be derived from the macroscopic stress tensor Σ
(2)
where Ep and Σ are, respectively, the macroscopic strain and stress tensor, εp and σ are, respectively, the mesoscopic strain and stress tensor, and the coefficient β1 depends on the Poisson ratio by (3)
(3)
The hardening in the inclusion is described by a linear kinematic hardening. The mechanical strength of this inclusion is considered equal to the fatigue limit of the material, denoted as σf, and the damage laws are given as follows:
(4)
(5)
The damage evolution is expressed by Eq. (4), where F is the plasticity-damage potential function of the effective stress and Y, the latter representing the damage driving force i.e. the energy release rate with respect to D. S and s are two material coefficients, and is the accumulated plastic strain
rate corresponding to the damage activation. There are nine parameters to be identified: two on the macroscopic scale (elastic modulus E and Lamé’s coefficient ν), two plastic coefficients on the microscopic scale (fatigue limit σf and kinematic hardening modulus), four damage coefficients (the
factor on the restitution stress rate , the exponent of the damage evolution law s, the cumulative plastic strain of the damage activation pD, and critical damage value Dc), and one coefficient for the
localisation law (β).
The threshold pD corresponds to the accumulated plastic strain necessary to initiate damage at the mesoscopic scale. The number of cycles required to reach pD correspond to a plastic localization phase before the damage growth. Once the damage is active, one multiplier is used to account at the same time for plasticity and damage evolution. The energy release rate Y, at the origin of the damage propagation by Eq.(4), acts only on the elastic part of the stress tensor.
This model predicts no effect of mean shear stress in case of a torsion loading; it leads to a nonlinear damage cumulation under block-loading, and reflects the favourable effect of some non-proportional loadings. These predictions are coherent with most of the observations conducted in HCF on metallic materials
The evolution of local stress, due to mesocrack influence at the inclusion scale is an interesting feature of this model. The damage evolution occurring in the inclusion induces a modification of microscopic stress (in the inclusion). However, the effective stress concept employed in this model influences a priori the effect of damage on local stress and further stress redistribution. In the present paper, a different formulation of the thermodynamic potential and of resulting constitutive equations will be advanced, avoiding effective stress concept, and emphasizing the interaction between damage and mesoscopic plasticity regarding average grain substructure.
3. Mesoscopic cyclic plastic modelling proposed by Papadopoulos
The criterion suggested by Papadopoulos, and presented in this section, is dedicated to the limited endurance of the HCF regime (typically from 5 × 10⁴ to 106 cycles). The starting point of this modelling is based on the elastic shakedown concept proposed by Dang Van [11] and [12]. In spite of an efficient formulation, one disadvantage of the Dang Van criterion is the implementation involving important computation times. Papadopoulos proposed a criterion close to Dang Van formulation, but with an easier implementation. The Schmid law and the isotropic hardening used by Dang Van are replaced by a Von Mises criterion coupled with isotropic and kinematic hardenings.
According to Dang Van, there is no fatigue failure if the microscopic stress in the shakedown state remains in the elastic domain (shakedown theory of Mandel [13]). During the first cycle, the crystal undergoes a hardening and the microscopic cycle tends to a symmetrical position, i.e. a stress stabilized state defined as an elastic shakedown state.
Moreover, Papadopoulos developed a model for the limited endurance based on the cumulative plastic strain considered as a damage variable [1]. This part deals with the finite fatigue life regime and the evolution of damage associated with the mechanism of crack nucleation. Papadopoulos considered the behaviour of single-crystals submitted to constant amplitude plastic strain loading [14],
and noted that the end of the isotropic hardening corresponds to a particular value of the accumulated plastic strain [15].
The model proposed by Papadopoulos deals only with the microscopic cracks nucleation in HCF. Few crystals oriented to the external loading, and inducing plastic strain, lead to the failure rupture. According to experimental observations of Winter [15], Papadopoulos supposed that the elastic limit of the crystal ksreached in the saturation phase is equal to a generalized endurance limit klim specific of the applied loading mode, and depending on the hydrostatic stress:
(6)
ks=klim=f(Σh)
The crystal hardening behaviour is modelled by using three successive phases: hardening, saturation and softening. The global behaviour of this modelling is summarised by the diagram of Fig. 2. The failure is assumed to occur when the elastic limit (=yield threshold) k equals zero. The load function (at the mesoscopic scale) is defined by a Von Mises plastic criterion:
(7)
The isotropic hardening laws, for the three phases, are summarized in Table 2, where c is the kinematic hardening modulus, and μ the macroscopic shear modulus. The next three equations govern the mesoscopic yield limit evolution for each phase.
Hardening phase: with g: isotropic hardening modulus
Saturation phase:
Softening phase: with h: isotropic softening modulus
Fig. 2. Diagrammatic representation of the construction of the three plastic behavior proposal [1].
For a proportional cyclic loading, the accumulated plastic strain can be obtained analytically according to the number of cycles and the macroscopic loading parameters. It is important to notice that the crystal, subjected to a cyclic loading is supposed to fail because of the accumulation of plastic strain. Papadopoulos chose then the accumulated mesoplastic strain as the isotropic damage variable denoted as D the following equation:
This variable can be normalised with , the accumulated plastic strain at the crystal failure, in order to obtain D = 1.
(9)
Of limited complexity, the modelling suggested by Papadopoulos leads to simple analytical equations. For a proportional loading, the number of cycles to crack nucleation is given by the following equation: (10)
where k0 is the initial yield limit of the crystal and l is a coefficient between the generalized fatigue
limitklim and the accumulated plastic strain in the saturation phase (11). Fig. 3 gives a schematic
representation of damage accumulation in terms of accumulated plastic mesostrain and yield limit evolution [17]:
(11)
The parameters to identify are as follows: •
p, q and r, three coefficients depending on the hardening parameters; •
klim, the generalised endurance limit associated to the applied loading (and depending on the hydrostatic stress).
Fig. 3. Damage in terms of accumulated plastic mesostrain and yield limit evolutions in the three phases of behaviour [2].
The Papadopoulos proposal takes into account many effects occurring in HCF (nonlinear cumulative damage, damage growth under the standard fatigue limit klim, description of SN curves for limited endurance domain), with a reasonable complexity. Morel [16], showed, for a high strength steel, that the hardening phase could be reasonably neglected.
The localisation rule, by its simplicity, reduces the mathematical developments, and reflects very important physical phenomena in fatigue: effect of residual stresses at the mesoscopic scale and total transmission of the hydrostatic stress from the macroscopic scale to the mesoscopic scale. Moreover, the modelling of the plastic phenomena at a mesoscopic scale remains simple despite the complexity of the physical phenomena.
Despite all these advantages, some strong assumptions of this approach are questionable. Indeed the last phase corresponding to a reduction of the crystal yield stress seems to correspond more to damage growth then to real plastic softening behavior. The definition of the damage variable, simply identified with the accumulated plastic strain, can hardly account for complex effects due to the microdamage growth. This point serves as guidance for the modelling carried out further.
4. Experimental results and observations under tension and torsion
loading modes
The studied material is a mild steel C36, used in many industrial applications. This steel shows an alternance of ferrite and pearlite lamels, and the mean grain size is 16 μm for ferrite and 22 μm for pearlite. Figs. 4 and 5show two micrographs (SEM) at two different scales.
Figs. 4 and 5. SEM views of the microstructure of the ferrito-pearlitic C36 steel.
Several experimental studies performed on this steel with an Amsler vibrophore and a biaxial Instron machine, lead to an important experimental fatigue database. In particular, Wöhler curves and fatigue limits (at 106 cycles) have been estimated for tension (s−1 = 246 MPa) and torsion (t−1 = 169 MPa) loading modes. The chemical composition of this steel is given in Table 1, and the mechanical characteristics are given inTable 2.
Table 1. Chemical composition of the C36 steel, in average weight (%)
C Si Mn S P Ni Cr Co Mo W V Ti
0.36 0.27 0.6 0.009 0.034 0.07 0.14 0.07 0.01 0.01 0.005 0.009
Table 2. Mechanic characteristics of the C36 steel
Young modulus, E (MPa) RP0,2 monotonous (MPa) RP0,2 cyclic (MPa) Rm (MPa) A%
205,000 350 280 580 30%
In order to reduce the scatter of the test results, mechanical polishing was performed with several abrasive papers up to a grain size of 6 μm. The polishing procedure ends with a paste diamond of 1μ m. Before fatigue tests and to remove the residual stresses occurring during the specimen preparation, all the samples underwent a tempering at 500 °C during one hour under vacuum. The whole experimental work was conducted at room temperature and under air environment on a servo-hydraulic biaxial testing machine (Instron type 1343) operating in load and torque control in the frequency range 10–20 Hz.
On few samples, a replica technique using a bi-component dental resin and applied at the specimen surface on the gauge length, indicates evolutions of each individual crack. After metallization, some observations on a SEM (under low acceleration voltage, in order to preserve the conducting film).
4.1. Damage mechanisms in tension
All the tests and the observations carried out in tension are described in Table 3. On all the observed specimens in tension (eight specimens), the importance in crack initiation and growth of the two critical
planes related either to the maximum shear stress or to the maximum principal stress appears clearly. The plane of maximum shear stress corresponding to the initiation and first stage of short crack growth (stage I, mode II) is represented with dark full lines on all the SEM pictures. After this first phase of shear crack growth, the crack branches toward a plane of maximum normal stress (stage II, mode I) represented by white dashed lines on all the SEM pictures. In tension, this branching occurs for a maximum crack length in surface of 20 μm. According to the observation carried out on all the specimen surface, it occurs that the damage is very localized. Very few signs of damage or plasticity on the gauge length are observed. All the tension cracks initiated from a non-metallic inclusion or most of the time from plastic shear bands occurr on the sample surface.
Table 3. Summarising of alternate tension tests (R = −1) done on the biaxial machine
Sample Stress amplitude (MPa) Failure number of cycles
C36TR01 245 7.31 × 10⁵ C36TR02 4.16 × 10⁵ C36TR03 106 – no failure C36TR04 250 1.45 × 10⁶ C36TR05 8.13 × 10⁵ C36TR06 106 – no failure C36TRV01 250 2.33 × 10⁵ C36TRV02 240 1.53 × 10⁶ C36TRV03 245 5.42 × 10⁵ C36TRV04 243 3.89 × 10⁵ C36TRV05 245 5.04 × 10⁵ C36TRV06 245 4.13 × 10⁵
Fig. 6 shows the surface crack length in function of the applied number of cycles for the four principal cracks observed during a tension test leading to a number of cycles to failure N = 8.13 × 10⁵ cycles. It appears clearly that the cracks No. 2 and No. 3 start to grow after their initiation but stop their propagations because they meet a microstructural barrier such as the pearlite bands (Fig. 6). Two other cracks No. 1 and No. 4 show an increase of the crack speed with the applied number of cycles but only one crack (No. 1) leads to failure. This observation proves the high degree of damage localisation in this fatigue life regime and shows that microdamage sites can exhibit growth independently of each other, i.e. without interactions.
Fig. 6. Crack length in function of number of applied cycles for four cracks occurring on the specimen C36TR05 submitted to tension.
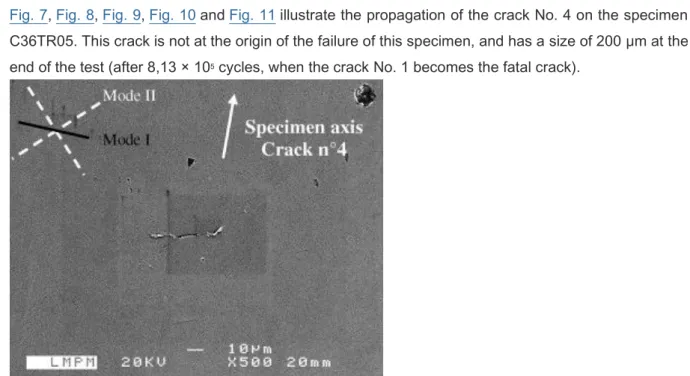
Fig. 7, Fig. 8, Fig. 9, Fig. 10 and Fig. 11 illustrate the propagation of the crack No. 4 on the specimen C36TR05. This crack is not at the origin of the failure of this specimen, and has a size of 200 μm at the end of the test (after 8,13 × 10⁵ cycles, when the crack No. 1 becomes the fatal crack).
Fig. 8. SEM view of the crack No. 4 on the sample C36TR05 after 3 × 10⁵ cycles.
Fig. 9. SEM view of the crack No. 4 on the sample C36TR05 after 4 × 10⁵ cycles.
Fig. 10. SEM view of the crack No. 4 on the sample C36TR05 after 6 × 10⁵ cycles.
Fig. 11. SEM view of the crack No. 4 on the sample C36TR05 after 7,5 × 10⁵ cycles.
After 2 × 10⁵ cycles, the crack has a size of 30 μm, and is oriented along the direction perpendicular to the specimen axis (Fig. 7). The crack growth is very slow between 2 × 10⁵ cycles and 3 × 10⁵ cycles. Fig. 9shows after 4 × 10⁵ cycles a stopped propagation on the right, with a change of the crack path direction and the creation of two branches. The growth there seems to be intergranular (around a grain). This observation is a good example of microstructural barrier interacting with the crack propagation (see Fig. 12, Fig. 13 and Fig. 14).
Fig. 12. SEM view of a sample loading in torsion, after only 105 cycles. The failure number of cycles of this
sample is equal to 4 × 10⁵ cycles. This view gives good example of accumulative plastic strain on critical mode
Fig. 13. SEM view of a replica done on the sample C36TO04 after 105 cycles.
Fig. 14. SEM view of a replica done on the sample C36TO04 after 2 × 10⁵ cycles.
At the end of the specimen lifetime, Fig. 11 shows a crack propagation that does not follow exactly a direction perpendicular to the specimen axis. The propagation rate remains rather slow, and an other crack leads the specimen failure (crack No. 1). It is very important to notice that these cracks are very far from each other and do not interact at all during the first propagation phase.
4.2. Damage mechanisms in torsion
All the tests carried out in torsion, as well as the observations done during these tests, are described in Table 4. The applied shear stress level is such that it leads to the same fatigue life range as in tension (2 × 10⁵ to 106 cycles). The first stage of crack nucleation appears in a shear mode, directed along and perpendicular to the specimen axis. These two directions correspond to the critical plane mode induced by the maximal shear stress. The corresponding orientations are remembered on each SEM view by dotted white lines. After only 105 cycles (first observation) and for a stress amplitude
equal to σzy,a = 175MPa, it is possible to distinguish many cracks along these two directions with a mean crack length of 60 μm. The distribution of these cracks is homogeneous on the specimen surface, and many marks of plastic accumulation occur. On a specimen showing a number of cycles to failure of 4 × 10⁵, one can already distinguish after only 105 cycles (for several tests), many cracks and plastic shear bands oriented along these two directions, with a length of about 20 μm and an almost homogeneous distribution on the specimen gauge length. During the remaining cycles, some new cracks appear and those already existing continue to grow along the transverse axis of the specimen. In the case of the specimen shown in Fig. 17, the first crack coalescence is observed after 5 × 10⁵ cycles, around half of the sample lifetime. The failure occurs after the crack branches to 45° to follow the plane of maximum normal stress. See Table 5.
Table 4. Summarising of alternate torsion tests (R = −1) done on the biaxial machine
Sample Stress amplitude (MPa) Failure number of cycles
C36TO01 175 6.10 × 10⁵ C36TO02 106 – no failure C36TO03 7.61 × 10⁵ C36TO04 9.1 × 10⁵ C36TO07 4 × 10⁵ C36TO05 160 2.59 × 10⁶ C36TO06 140 3 × 10⁶ – no failure
Table 5. Nine parameters identified on C36 tests and needed by the suggested modelling c (MPa) μ (GPa) r∞ (MPa) r0 (MPa) g s k0 (MPa) q dc
2000 70 168 60 0.1 0.06 80 400 3
In case of the specimen denoted as C36TO04 (failure after 9.10 × 10⁵ cycles), the replica technique was used in some observations to characterize the principal stages leading to the macro-crack. One of the outstanding facts, visible in Fig. 16, is the instability of the crack propagation, “hesitating” during half of its lifetime (from 3 × 10⁵ to 7. 105 cycles) between growth in mode I or II. It is difficult to deduce that this instability is due to repeated attempts of branching, influenced by the local stress field, or is rather due to search of less resistant path across the microstructural barriers. At the end of the shear crack growth mode, the average length of the crack central part (corresponding to mode II) reached 250 μm, which is rather long compared to the lengths of cracks in mode II for tension (20 μm).
The propagation instability leads to a fatal macro-crack that was not the biggest crack during the first step.Fig. 15 shows a crack with a length equal to 150 μm after 3 × 10⁵ cycles, located on the right. This crack will be the fatal crack, and has a surface length of only 100 μm. It presents a stopped evolution on the right of the crack path, only the left side of this crack keeps growing. This arrest can be due to the interaction between two close cracks, which is a consequence of the stress redistribution. Finally, the last third of the lifetime is only used to propagate the bifurcated branches of the macro-crack, without extension of the central part (from Fig. 17, Fig. 18, Fig. 19 and Fig. 20).
Fig. 15. SEM view of a replica done on the sample C36TO04 after 3 × 10⁵ cycles.
Fig. 16. SEM view of a replica done on the sample C36TO04 after 4 × 10⁵ cycles.
Fig. 18. SEM view of a replica done on the sample C36TO04 after 6 × 10⁵ cycles.
Fig. 19. SEM view of a replica done on the sample C36TO04 after 7 × 10⁵ cycles.
The observation of the cracks present in the other zones of the gauge length shows exactly the same kind of behaviour. The initial proportion of transverse cracks tends to decrease (by a crack arrest process), and new longitudinal cracks occur. Moreover, during the first observations (105 and 2 × 10⁵ cycles), a roughness, consequence of the plastic slip accumulation, is observed in many places.
According to these observations conducted on five specimens, it is important to point out the very different damage mechanisms occurring in torsion and tension. The tension loading leads to very few cracks while the damage pattern due to torsion is more homogeneous on the specimen surface. The damage kinetics are different, and the damage modelling must correctly reflect this feature.
5. Elasto-plastic damage model for HCF
The framework of irreversible thermodynamics processes with internal variables, for isothermal transformations, independent of time and in small deformations is used. The existence of a potential of state is assumed (the free energy), as well as the existence of a dissipation potential and several multipliers. The hypothesis of the local accompanying state (LAS) makes possible the description of the continuous medium in a given point and at a given moment, thanks to the knowledge of a few state variables [18]. Traditional plasticity rules, independent of time is employed, at the mesoscopic scale. The choice of dissipations uncoupled for plasticity and damage, also made possible to separate the associated mechanisms and the two criteria. This induces two independent dissipation potentials and two distinct multipliers. This choice allows to account for local plastic deformations before any damage development.
The mesoscopic free energy by volume unit is given by (33)
(34)
and the intrinsic dissipation by volume unit, related to the mechanical phenomena, is written as (35)
(35)
The plastic yield at the mesoscopic scale is given by (36)
(36)
(38)
where s is the mesoscopic stress deviator. The specific form of J2 leads for a pure shear stress, to a
value equal to the applied shear. This equivalent stress can be seen as a spatial mean value of local quantities, and represents what happens in a group of average grains.
The thermodynamic force representing the isotropic hardening threshold is given by (39), with g being the hardening parameter and s the damage sensitivity parameter.
(39)
Eq. (39) reflects the effects of plasticity (hardening by the population of dislocations) and those of damage. This damage is thus seen like one or more mesocracks, modifying the behavior and the mechanical strength of the average grains group. In fact, the capacity to propagate the damage (for example, across the grain boundary) depends on the possibility of activating new slips in the grains close to the first nucleated damage.
A kinematic hardening using the linear model proposed by Prager [19] (kinematic module c), is also introduced
(40)
Non-associated laws are used for threshold and damage evolution. Eq. (41) gives the damage load function, where a is the hydrostatic stress sensitivity factor on damage threshold and k0 the initial
damage threshold. k governs the damage threshold evolution and the evolution function (42), uses similar form, with however different parameters, in particular for the hydrostatic stress influence parameter with parameter b:
(41)
h(Fd,k;σh)=Fd(1+aσh)-(k+k0) (42)
H(Fd,k;σh)=Fd(1+bσh)-(k+k1)
The force associated to the damage effect variable d, noted as Fd, is the damage driving force.
Definition of this force uses the cumulated plasticity rate, p, and derived from Eq. (33): (43)
A second scalar variable, denoted as β, plays for the cumulated damage measurement. The combined force to this variable is noted as k:
(44)
In the presence of irreversible phenomena, the knowledge of the thermodynamic potential is not enough to completely describe the evolution laws. It is necessary to describe the evolution of the internal variables, with complementary laws. The assumption of normal dissipation, respectively, for plasticity and damage, specific to the studied material, is applied in the following:
(45)
(46)
(47)
(48)
This model uses two distinct scalar variables to account for the damage phenomenon. The first, noted asd, designates more specifically damage effect on material properties (isotropic hardening), by influencing plastic yield. The second variable β, represents the scalar cumulated damage measurement, and corresponds to the creation of a new surface (crack). The conjugate
force k connected with variable βdetermines also the current damage threshold in (41), see also the model [20]. Distinction between the evolution of damage variable β and this for damage effect variable d is due to the effect of hydrostatic stress, see the following equation:
(49)
6. Identification procedure and prediction in tension and torsion
The identification procedure requires the use of two SN curves, for instance in torsion and in tension. The first identification step is the estimation of the coefficients necessary to simulate the fatigue behaviour under loading inducing no hydrostatic stress. More exactly, a torsion Wöhler curve obtained with a load ratio equal to −1 is used to reflect the two fatigue regimes in HCF. The infinite fatigue life
regime is represented by the torsion fatigue limit that is supposed to reflect an asymptotic mesoscopic plastic behaviour. For the finite fatigue life regime, some shear microcracks occur and propagate. A simple plasticity rule is no more enough to account for the damage mechanisms.
Fig. 21 shows, for the mild steel C36, the correlation between the simulated torsion Wöhler curve and the experimental data. The identification of a and b parameters is possible by using a loading introducing hydrostatic stress. Let us recall that these coefficients reflect the material sensitivity to the hydrostatic stress. They can be reached by using tension results. For the mild steel C36, a = 0.01 and b = 0.04. Fig. 22shows the experimental data in tension, and the corresponding predicted Wöhler curve.
Fig. 21. Experimental data and predicted Wöhler curve in torsion.
Fig. 22. Experimental data and predicted Wöhler curve in tension.
6.1. Comparison with the elastic shakedown criterion proposed by Dang Van
In the field of HCF and for the unlimited endurance domain, it is common to represent the experimental data under several loading modes in a plane built from two reference mechanical parameters. In this plane, Papadopoulos criterion is represented by a line [1]. This graph is very closeto the one proposed by Dang Van. In the case of Papadopoulos proposal, the vertical axis represents an average over all space directions of the shear stress (consequence of the Von Mises equivalent stress J2 use), whereas the horizontal axis corresponds to the hydrostatic stress. Fig. 23 shows in the Papadopoulos plane the experimental points obtained (tension–torsion tests k = 0, k = 0,5, k = 1, and torsion k = ∞) for 106 cycles: they all lie around the endurance line. The perfect match between the two approaches of predictions is due to the use of the same elastic shakedown concept.
Fig. 23. Predicted threshold endurance curve (at 106 cycles and for a 50% failure probability) and experimental
data in the plane usually used by Papadopoulos .
6.2. Tests below the conventional mean fatigue limit and crack arrest
This part deals with the mechanism of crack arrest under torsion loading, for a stress level amplitude lower than the torsion fatigue limit at 106 cycles (estimated at 169 MPa for the tested mild steel). In order to show the relevance of the suggested model to account for the crack arrest phenomena during the specimen life, simulations were carried out corresponding to this stress level.
The first case is the simulation of the loading applied to the specimen C36TO05, i.e. the shear stress is equal to 160 MPa. The second case is relative to the specimen C36TO06, tested in torsion on a level much lower than the stress limit, i.e. the shear stress equal to 140 MPa. All the simulations for shear stress amplitudes equal to 120, 140 and 160 MPa are gathered in Fig. 24. The damage, accumulated plastic strain and other variables reach asymptotic values represented by index∞. The number of cycles to reach the saturation state increases with an increase of the applied stress level.
Fig. 24. Predicted evolution of the plastic yield threshold, the normalized cumulated plastic strain compared to the failure cumulated plastic strain for shear stress amplitude equal to 169 MPa (fatigue limit), and the damage effect variable according to the number of cycles.
Fig. 25 presents on a Wöhler plane, for a pure torsion stress state, three different curves. The first curve, on the top and drawn in continuous black line, corresponds to the prediction of the admissible shear stress amplitude for the given lifetime and a cumulated probability of failure equal to 50%. This curve corresponds to the traditional Wöhler curve. This curve corresponds to the number of cycles for which the damage effect variable dc reaches the critical value dc.
Fig. 25. Predicted failure curve, damage activation curve, and experimental data in a Wöhler diagram for pure alternative torsion loading.
All the area under this first curve (for greater number of cycles, or lower shear stress amplitudes), corresponds to the situation where no sample failure is predicted, from a deterministic point of view. For instance, a shear stress amplitude equal to 160 MPa, corresponding to the experimental point No. 1, must not lead, according to the model, to the sample failure. However, the damage does not remin equal to zero. It too first grows and then tends to a saturation level equal to 0.26. For lower shear stress amplitude of 140 MPa the damage value at saturation equals to 0.06.
In other words, the model is able to predict infinite lifetimes of a sample, in spite of some damage initiation and growth. That is the consequence of Eq. (39), governing the competition between plastic effect and degradation by damage. Even if the damage is initiated, the plastic development makes it possible to reach a plastic yield limit equal to the stress amplitude of the loading. Consequently, the crystal tends to recover a purely elastic response and the development of plasticity and damage. This hardening behaviour accounts for the accumulation of dislocation near the process zone ahead of the crack tip, and also for the difficulty of the damage to cross strong barriers. A typical example of these barriers is the grain boundary.
In Fig. 25, the saturation of the damage effect variable, without final failure, leads to the definition of a second curve, corresponding to the limit under which the saturation value is zero. This curve is plotted in gray in Fig. 25. Between this curve and the conventional SN curve some damage occurs. The noted zone B, located between these first two curves, could be named “elastic shakedown without failure”.
That corresponds to a numerical activation of the damage, but leading more or less to an elastic shakedown state, with a mean grains group working in the elastic domain, without failure (see Fig. 26).
Fig. 26. Predicted evolution of the plastic yield threshold, the normalized cumulated plastic strain compared to the failure cumulated plastic strain for tension stress amplitude equal to 250 MPa, and the damage effect variable according to the number of cycles.
In the lower part of this second curve, the damage is not activated. Nonetheless, some plasticity can be activated at the mesoscopic scale. Only for levels below the initial plastic yield threshold r0 it is not possible to activate neither plasticity nor damage. This zone above r0 denoted as “C”, for which plasticity is first activated, is called “Elastic shakedown without damage”. It corresponds to the traditional concept of the elastic shakedown concept.
Let us now put in balance some predictions for low stress levels with the results and experimental observations. The failure of the sample (C36TO05), loaded at shear stress amplitude equal to 160 MPa, occurred after 2,59 × 10⁶ cycles. This shear stress level is lower than 169 MPa, that is the shear fatigue limit is obtained for a lifetime equal to 106 cycles. The observation by SEM of this specimen, after 106 cycles, shows already signs of plastic accumulation and even several marks of damage, i.e. cracks of a mean length close to 20 μm.
In this modelling, this situation corresponds to “elastic shakedown with damage”. The predictions obtained for these two damage variables, after 3 × 10⁵ cycles, corresponding to saturation effect, are d = β = 0,26. The damage is represented by the mesoscopic cracks observed on the sample after 106 cycles. Of course, a study on a most important number of samples would make possible to distinguish pure effect of crack arrest from scattered results. For stress amplitude lower than the fatigue limit, it would be possible to find a sample leading to crack arrest and no failure.
For a second sample, denoted as C36TO06, and tested at a lower stress amplitude level (σ
zy,a = 140 MPa), the model predicts a no-failure situation, with a very small saturation value of the damage effect variable (d = 0,06). The elastic shakedown with damage, or “damaged shakedown” occurs just after the beginning of the damage activation. This corresponds to the total absence of significant marks of damage during SEM observations, or crack nucleation, on this specimen.
One more time, this observation carried out with a deterministic approach must be put in connection with the data scatter, specific to HCF domain. The use of a probabilistic approach for the damage initiation threshold would make it possible to treat this aspect.
7. Discussion
Some tests carried out on a mild steel are conducted to compare the local damage evolution under tension and torsion loading. For fatigue lives related to stress levels just above the fatigue limit, it appears that the tension and the torsion cracks initiate and grow first according to a shear mode (stage I, mode II) and then branch to a normal mode (stage II, mode I). However, the damage patterns are very different under torsion and tension. While very few tension cracks initiate and grow, the plastic shear bands and the cracks under torsion are observed everywhere on the specimen surface, for stage I mostly along the specimen axis, i.e. along the pearlite bands.
The saturation effect of the damage development below the critical damage value (noted dc) seems to reflect the usually observed crack growth arrest (Fig. 27). Let us recall that this critical damage effect value represents the crystal failure. In the present model, the damage only modifies the crystal cyclic behaviour (Eq. (39)). It implies that for low stress amplitude values, some competition between meso-damage and mesoplasticity can occur and lead to elastic shakedown like in the Dang Van or
Papadopoulos approach, but with a no-null damage value. This model feature is very interesting because it can explain the presence of initiated cracks whose growths are not possible because the driving force is not enough to bypass the microstructural barrier.
Fig. 27. Saturation damage effect variable d∞ according to constant stress amplitude of the tension loading.
The proposed model is based on a continuous competition between the plasticity and damage effects, at the mesoscopic scale. On the contrary to Papadopoulos proposal [1], for which three different cyclic hardening behaviours are applied successively (hardening, saturation and softening), the proposed model does not make such a distinction but simulate the progressive ductility exhaustion by use of a damage variable.
According to our observations on the specimen surface, it clearly appears that the localisation phase of the shear plastic strain is a necessary step of the crystal failure. It is the first stage of crack nucleation. This plastic strain localisation is taken into account by the damage effect variable d used in this modelling. d is indeed related to the reduction of the cyclic plastic properties. Of course, in a second time, the presence of a crack will also reduce the crystal strength. However, for microstructural short cracks (denoted MSC by Miller[21]), it is well known that the microstructural environment near to the crack, plays a very important role in the kinetic and the direction of propagation of the existing crack. Consequently, this effect, and in particular the movement of dislocations around the crack, is taken account for cyclic hardening saturating [22], always acting in competition with the damage (Eq. (39)). The amplitude of this phenomenon depends of course on the number of cycles already applied to the sample.
Moreover, all the plastic and damage phenomena have a direct influence on the elastic behaviour of the crystal, knowing that the slip activation enables strongly anisotropic evolutions of these properties. Consequently, the damage description in a mesoscopic elasticity law is not simple, just as the
experimental characterization of these effects. The approximation of these phenomena by the use of a scalar variable allows already, a dependence of the damage driving force to the effective elastic energy of the no-damaged material. The modelling proposed by Lemaître operates by the same way, also used a scalar damage variable (isotropic point of view) to take account of the damage effect on material behavior, even if the coupling with the other phenomena is different from that retained for our proposal.
For a damage activated very early in the sample life, cyclic hardening did not lead to a stabilized state, allowing a very strong competition between plasticity and damage. This applies well to the case of the short cracks that appear in the first stages of the HCF phenomenon. These cracks are called MSC (microstructural short crack) in the classification suggested by Miller [21]. In the HCF regime, the accumulated plastic strain tends to saturate the isotropic cyclic hardening effect. Then, only the damage at the scale of the crystal operates, even it results from the accumulation of plastic strain. During the second part the cracks growth phase, when the stage of the interaction with the microstructure is exceeded, this mechanism tends to be different, and can be treated by an other approach, like that of the linear fracture mechanics. This stage corresponds to crack PSC (physically short crack) in the classification suggested by Miller.
After the description of the damage occurring in torsion, let us now turn to the tension loading mode. The predicted failure stress amplitude in purely reversed tension test is 247 MPa for 106 cycles. Fig.
26 gathers the evolution of the three characteristic variables (r, p and d) of the modelling for stress amplitudes equal to 40, 200 and 240 MPa. As in torsion, the variables reach asymptotic values corresponding to the saturation damage evolution. This shakedown state is reached more or less quickly depending on the stress level.
Contrarily to torsional loading, the simulation in tension shows an early start of damage (d > 0), and competition between damage effect and plastic hardening. This effect results from lower equivalent stress level in tension. The equivalent measure, based on the stress deviator, does not reflect all the damage mechanisms responsible for the crack growth. The hydrostatic stress must be introduced and then the damage growth is to be accelerated. Its effect is to support crack opening. This damage growth is governed by the damage potential, which is a function of the hydrostatic stress σh:
(42)
H(Fd,k;σh)=Fd(1+bσh)-(k+k1)
In the same way as in torsion, it is possible to distinguish the three zones, noted A, B and C. The first, for purely tension alternating stress amplitude lower than 104 MPa, corresponds to no-initiation of the damage, and purely elastic shakedown of the mean grain group. In the second zone, noted B, the damage is activated, but a shakedown is obtained, according to the asymptotic effect previously shown. Finally, the third zone, noted C, corresponds to tension stress amplitudes higher than 247 MPa where the ruin of the crystal is achieved before 107 cycles.
This work proposes a modelling dedicated to the HCF of polycrystalline materials. Formulated within a thermodynamic framework ensuring its admissibility, in particular from the second principle viewpoint, the crystal behaviour is described continuously during its life, whatever mechanical loading, as a competition (and a relative coupling) between mesoplasticity and damage. The model employs some concepts and tools suitable for nonlinear mechanics of materials. The localisation, this term is employed here as the link between macro and mesoscale, plastic behaviour and the damage growth are based on simple, but robust laws.
This model makes it possible to predict the fatigue limits associated with any multiaxial stress state, admitting high cycle fatigue and to define limited endurance conditions (from 105 to 106 cycles). The resulting predictions are illustrated for a mild steel C36, under proportional loading. After parameters identification carried out, respectively, for alternative pure tension and pure torsion, it appears that the capacities of prediction of the model are fairly good, including in-phase tension–torsion loading. An experimental study presented, in the HCF domain, for the C36 steel, shows very different behaviour of this material in tension and torsion, for the same lifetime range, see also [23]. It corresponds to the physical reality of two different principal crack growth modes (mode I in tension and mode II in torsion). These modes of crack growth have very different consequences on the damage behaviour of the crystal. Thus, mode II is modelled with a storage of energy due partly to the phenomenon of friction between the lips of the cracks, whereas mode I corresponds rather to a phenomenon of decohesion of the crystal. Moreover, the suggested modelling does not consider the depth of the crack, but only their effects on the plastic behaviour.
As presented in this paper, each step of modelling presented has been selected among the simplest possible. The first objective is to show the capacities of this approach, while preserving best possible legibility, as well as easy numerical implementation. It would be of course possible and even desirable, to enrich various stages. For instance, the description of the plastic flow could use modelling tools more powerful than selected. That could appear useful, in particular for the study of out of phase loading. The use of memory models, or models with complex yield surfaces, is a way to be explored, see for example [24]. In the same way, the description of damage can be largely improved, according to the recent developments of the damage mechanics [25], notably in the context of anisotropic deterioration effects.
The localisation is also a step requiring prospective amendment. This step determines in a way the crystal behaviour, by setting mechanical fields “seen” by the crystal (stress, strain…). The choice of the Lin-Taylor localisation responds to the requirement of legibility and simplicity, see [2]. It would be possible to use a more complex localisation formula, corresponding to salient features of crystal degradation, of its environment [26], residual stresses, or of induced anisotropy [27]. Further micro-mechanical analysis, needs to be pursued in this context.
In spite of the simplicity of the selected tools, it appears that the model presented is able to account for the effect of the crystal shakedown, for stress levels not inducing failure. Moreover, for stress amplitudes between no damage activation domain and failure, the model predicts the shakedown of the crystal with non-null damage variable effect values. It corresponds physically to “adaptation” of the
crystal with arrested cracks. Regarding mesoscopic scale, the model is thus able to account for the crack arrest, in a limited interval of stress amplitude. Of course, it is in general the consequence of redistribution effect of stresses in the material volume, and a consequence of several cracks nucleation. Furthermore, coupling with a probabilistic approach will be developed, to account for the strong scatter of the kinetics of propagation of fatigue cracks.
References
[1]Papadopoulos IV. Fatigue limit of metals under multiaxial stress conditions: the microscopic approach. Technical Note No. I.93.101, Commission of the European Communities, Joint Research Centre; 1993. ISEI/IE 2495/93.
[2]F. Morel
A critical plane approach for life prediction of high cycle fatigue under multiaxial variable loading
Int J Fatigue (22) (2000), pp. 101–119
[3]D.L. McDowell
Bassic issues in the mechanics of high cycle metal fatigue
Int J Fract, 80 (1996), pp. 103–145
[4]J. Lemaitre
A continuous damage mechanics model for ductile fracture
J Eng Mater Technol, 107 (1985), pp. 83–89
[5]J. Lemaitre, J.P. Sermage, R. Desmorat A two scale damage concept applied to fatigue
Int J Fract (1999), pp. 67–81
[6]J. Lemaitre, R. Desmorat, M. Sauzay Anisotropic damage law of evolution
Eur J Mech, A/Solids, 19 (2) (2000), pp. 187–208
[7]C. Doudard et al.
Identification of the scatter in high cycle fatigue from temperature measurements
CR Mec, 332 (10) (2004), pp. 795–801
[8]L.M. Kachanov
Time of the rupture process under creep conditions
Isv Akad Nauk, Otd Tekh Nauk, 8 (1958), pp. 26–31
The determination of the elastic field of an ellipsoidal inclusion and related problems
Proc R Soc Lon (1957)
[10]M. Berveiller, A. Zaoui
An extension of the self-consistent scheme to plastically flowing polycrystals
J Mech Phys Solids, 26 (1979), pp. 325–344
[11]K. Dang van
Macro-micro approach in high-cycle multiaxial fatigue
,in: D.L. McDowell, R. Ellis (Eds.), Advances in multiaxial fatigue, ASTM STP, 1191, ASTM, Philadelphia (USA) (1993), pp. 120–130
[12]Dang van K, Sur la résistance à la fatigue des métaux. Sciences et Techniques de l’Armement, Mémorial de l’Artillerie française; 1973. p. 3.
[13]J. Mandel, J. Zarka, B. Halphen
Adaptation d’une structure elastoplastique a écrouissage cinématique
Mech Res Commun, 4 (1977), pp. 309–314
[14]I.V. Papadopoulos
Fatigue polycyclique des métaux: une nouvelle approche
Ecole nationale des ponts et chaussées, Paris (1987)
[15]A.T. Winter
A model for the fatigue of copper at low plastic strain amplitudes
Philos Mag, 30 (1974), pp. 719–738
[16]Morel F. Fatigue multiaxiale sous chargement d’amplitude variable, Thèse de Doctorat de l’Université de Poitiers. Poitiers; 1996.
[17]F. Morel
A fatigue life prediction method based on a mesoscopic approach in constant amplitude multiaxial loading
Fatigue Fract Eng Mater Struct, 21 (2000), pp. 241–256
[18]J. Bataille, J. Kestin
L’interprétation physique de la thermodynamique rationnelle
J Mec, 14 (2) (1975), pp. 365–384
[19]W. Prager
Non isothermal plastic deformation
Koninlijke Nederlandse Akademie van Wetenschapen, 61 (1958), pp. 176–182
[20]K. Hayakawa, S. Murakami
G.Z. Voyiadjis, J.-W.W. Ju, J.L. Chaboche (Eds.), Damage mechanics in engineering materials, Elsevier science B.V. (1998)
[21]Miller KJ. Metal fatigue-past, current and future. Twenty-seventh John Player Lecture; 1991. p. 291–304.
[22]K.V. Rasmussen, O.B. Pederson
Fatigue copper polycrystals at low plastic strain amplitudes
Acta Metal (1980)
[23]V. Docquet
Crack initiation mechanisms in torsional fatigue
Fatigue Fract Eng Mater Struct, 20 (2) (1996), pp. 227–235
[24]L. Vincent, C. Calloch, D. Marquis
A general cyclic plasticity model taking into account yield surface distorsion for multiaxial ratchetting
Int J Plasticity, 20 (10) (2004), pp. 1817–1850
[25]Dragon A, Halm D. Damage mechanics – some modelling challenges -. Amas Lecture notes 9. 2004,
Poland: ed. COEFAMA structures.
[26]D. Krajcinovic Damage mechanics
Elsevier Science, North Holland (1996)
[27]J.L. Chaboche, P.M. Lesne
A non-linear continuous fatigue damage model
![Fig. 1. Diagrammatic representation of the construction of the two’s scale model [5].](https://thumb-eu.123doks.com/thumbv2/123doknet/7300650.209096/4.892.229.662.104.249/fig-diagrammatic-representation-construction-s-scale-model.webp)
![Fig. 2. Diagrammatic representation of the construction of the three plastic behavior proposal [1]](https://thumb-eu.123doks.com/thumbv2/123doknet/7300650.209096/6.892.160.665.626.945/fig-diagrammatic-representation-construction-plastic-behavior-proposal.webp)
![Fig. 3. Damage in terms of accumulated plastic mesostrain and yield limit evolutions in the three phases of behaviour [2]](https://thumb-eu.123doks.com/thumbv2/123doknet/7300650.209096/8.892.234.666.101.499/damage-terms-accumulated-plastic-mesostrain-evolutions-phases-behaviour.webp)