Int. J. Biol. Chem. Sci. 5(6): 2224-2235, December 2011 ISSN 1991-8631
© 2011 International Formulae Group. All rights reserved.
Original Paper
http://indexmedicus.afro.who.int
Partial replacement of fish meal with Azolla meal in diets for Nile
tilapia (Oreochromis niloticus L.) affects growth and whole body
fatty acid composition
Youssouf ABOU
1*, Alphonse ADITE
1, Moudachirou IBIKOUNLE
2,
Yves BECKERS
3, Emile D. FIOGBE
1and Jean-Claude MICHA
41
Unité de Recherche sur les Zones Humides, Département de Zoologie et Génétique, Faculté des Sciences et Techniques, Université d’Abomey-Calavi, Cotonou, Bénin.
2
Département de Zoologie et Génétique, Faculté des Sciences et Techniques, Université d’Abomey-Calavi, Cotonou, Bénin.
3
Unité de Zootechnie, Gembloux Agro-Bio Tech, Gembloux, Université de Liège, Belgium.
4
Research Unit in Environmental and Evolutionary Biology, URBO/FUNDP-University of Namur, 61, rue de Bruxelles, 5000 Namur, Belgium.
*Corresponding author, E-mail: y_abou@yahoo.com, Tél: 00 229 95 42 27 75.
ABSTRACT
The replacement of fishmeal (FM) with Azolla meal (AM) in diets on growth and fatty acid in Nile tilapia, Oreochromis niloticus (initial mean weight: 16.4 g) was studied. Fish were fed with six isonitrogenous (29.2% CP) and isoenergetic (16.9 kJ.g-1) diets containing 0%, 10%, 20%, 30%, 40% and 50% AM respectively, as partial FM substitute. Diet A0 acted as a control. The final weight (51.0-88.3 g), the weight gain (210.8-438.3%) and the SGR (1.3-1.9%day-1) decreased when AM level higher than 10% in diets (P < 0.05). The FCR (1.44 to 2.35) significantly increased when AM level exceeded 20% (P < 0.05). The protein efficiency ratio and the apparent net protein utilization decreased consequently. The fatty acids in the whole fish were significantly influenced by the diets. The replacement of FM by AM produced fish with lower (n-3) highly unsaturated fatty acids mainly docosahexaenoic acid, and higher arachidonic acid (P < 0.05). The n-3/n-6 fatty acid ratio ranged from 0.08 to 0.17, and was lower in fish fed A40 and A50 (P < 0.05). The findings suggest that high AM in diets affects Nile tilapia growth and the fern could be incorporated in diets up to 30% without any adverse effect on fish fatty acid composition. However, alternative additional source of lipid must be used to improve the quality of fish fed AM-diets.
© 2011 International Formulae Group. All rights reserved.
Keywords: Azolla, Fish meal replacement, Growth, Fatty acids, Oreochromis niloticus, bioconversion.
INTRODUCTION
As the global production of fish meal was stabilized at 6 to 7 million tones since 1985, the prices of that feed ingredient has
risen (FAO, 2006). Consequently, research on the use of non-conventional sources of protein as ingredients to replace FM in fish feeds has received increasing attention by fish
2225 nutritionists around the world. Several vegetable sources have shown to be valuable to replace FM in fish diets, either partially or in total substitution. The use of Sesbania seeds (Sesbania aculeata L.), Moringa leaf (Moringa oleifera Lamarck), Mucuna seeds (Mucuna pruriens L.), duckweed (Spirodela
polyrrhiza L. Schleiden), Azolla Lamarck, etc.
in diets for O. niloticus had yielded encouraging results (Fasakin et al., 2001; Hossain et al., 2002; Siddhuraju and Becker, 2003; Afuang et al., 2003; Fiogbé et al., 2004). Interests on the use of the aquatic fern
Azolla in fish farming are recent. Indeed, due
to its symbiotic relationship with the
cyanobacteria named Anabaena azolla
Strasburger, this small-leaf free-floating fern commonly found in aquatic ecosystems of tropic and sub-tropic regions, fix the atmospheric nitrogen and is naturally rich in protein, show a good amino acids profile and contained some vitamins and minerals (Leonard, 1997). Research on the use of
Azolla as a feed ingredient in fish farming had
been conducted in controlled conditions (Leonard, 1997; Micha and Leonard, 2001-2; Fiogbé et al., 2004), as well as in ponds (Abou et al., 2007). So far, Azolla research in that
area is strongly focused on growth
performance and digestibility in O. niloticus and O. aureus Steindachner (Leonard et al., 1998; Micha and Leonard, 2001-2). As a criterion for sustainable aquaculture, the nutritional quality of the fish produced should also be taken into account. Indeed, the market value of cultured fish largely depends on their quality and feed composition is one of the factors that control quality (Shearer, 2001). It is currently well established that increased fish consumption in human is associated with decreased mortality, as well as morbidity from cardiovascular disease and coronary heart disease (Arts et al., 2001). And the links between fish as food and human health are strongly related to the fatty acid composition of the food (Steffens, 1997). Especially, (n-3)
fatty acid series are known to improve neurological function in newborn infants (Maina et al., 2003). Therefore, the fatty acid profile of fish produced could be another tool to evaluate the relative suitability of feeding with Azolla and could serve as an indicator of nutritional quality, especially for the consumer’s health. To date, there is no data on the effect of feeding with Azolla on fish fatty acid composition.
This study aimed at analysing the effects on growth and the changes in fatty acids of Nile tilapia fed with increasing amount of AM as alternative source of dietary protein in replacement of FM.
MATERIALS AND METHODS Azolla culture
The strain of Azolla used is A.
filiculoides Lamarck. The fern was produced
in one pond of 100 m². For use, effort was made to always harvest the fern in its linear phase of growth, i.e. when the biomass of fresh matter is about 1-2 kg m-2 (Van Hove, 1989), in order to entirely conserve its nutritional value. The linear phase of growth in the culture conditions is reached in about
10 days after inoculation (personal
observation), depending however on the density of inoculation. Before its use in diets, the fern was harvested, washed with water to remove residual soil and debris, sun-dried (32-35 °C) and ground (200 µ m). Then, the meal was stored in air-tight plastic containers and kept in a refrigerator (+ 4 °C) until used for diet production.
Fish, diets and feeding regimes
The experiment was carried out for 90 days in station (6°25'1.53"N 2°20'42.2"E) located at the University of Abomey-Calavi, Benin (West Africa). Sixty male fingerlings of Nile tilapia Oreochromis niloticus (initial mean weight = 16.4 g) from Lassissi fish farming center were stocked in each of eighteen 600 L square concrete tanks.
2226 Fish were fed with six isonitrogenous (29.2% CP) and isoenergetic (16.9 kJ.g-1) diets formulated to contain 0% (A0), 10%
(A10), 20% (A20), 30% (A30), 40% (A40) and
50% (A50) of AM using locally available
ingredients and the freshwater fern A.
filiculoides. Formulation and proximate composition of experimental diets are given in Table 1. The experimental diets were prepared according to the procedures described in Abou et al. (2007), broken into smaller pellets (5 mm) and preserved in a refrigerator (+ 4 °C) until their distribution to fish.
Tanks were exposed to natural conditions (32-35 °C; 12 h:12 h dark diurnal photoperiod) and were subjected to an enclosed recirculating system with a water flow rate of 2 L min-1. The used water coming from the rearing tanks flowed respectively through a 300 L tank for decantation, a 300 L tank for biological filtration and a 3 m³ tank containing a pump (Riverdrain 7800) which was able to fill continuously the initial 1m³ tank installed at a 2-m height from the floor. The experimental tanks were randomly assigned to six groups, each in three replicates (6 x 3 tanks) was attributed one of the diets.
Fish were fed every day with the daily ration calculated based on the optimal daily ration rate estimation according to Melard (1986). Daily rations were divided into two parts, each hand-distributed at 8:00 h and 16:00 h respectively. The daily rations were adjusted fortnightly according to fish biomass in each tank.
Sampling and chemical analysis
Six fish per tank were randomly sampled and stored at -20 °C for analysis. Whole fish were mashed using a Robot coupe food processor and whole body crude lipid was determined according to Folch et al. (1957). The diets used were reduced in meal and preserved at -20 °C for biochemical analysis. They were analyzed for dry matter (AOAC, 1990), crude protein (Nitrogen x
6.25, Kjeldahl method), crude lipid (Folch et al., 1957) and crude ash content (incineration for 24 h at 550 °C in a muffle furnace).
Amino acid composition was
determined by ion-exchange chromatography using a Waters HPLC (Waters, Milford, MA, USA), column AccQ-Tag 3.9 x 150, following hydrolysis of samples with 6 M HCl at 110 °C under an atmosphere of N2 for 18 hrs. Fatty
methyl esters were prepared after trans-esterification with anhydrous methanol containing 1% sulphuric acid and 0.01% (w/v) butylated hydroxytoluene (BHT) for 16 h at 50 °C (Christie, 1982). They were separated and quantified by gas chromatography (GC Trace, 2000, Thermo Quest, Carlo Erba, Italy), using a 30 m x 0.32 mm capillary column (FAME-WaxTM, USA).
Statistical analysis
Data of growth performance, body composition and fatty acids in fish were subjected to a one-way analysis of variance (ANOVA) to test the effect of replacement of FM by AM on growth and fatty acid composition of whole fish (n = 3). Differences between means were determined by Duncan’s Multiple Range test (Duncan, 1955) and were considered to be significant when P-values were < 0.05. Before analyses, homogeneity of variance was checked using the "Hartley test" (Hartley, 1959) and all data were log-transformed. All analyses were done using the statistical package SPSS version 17.0 for windows (SPSS, Chicago, Illinois, USA). RESULTS
Amino acid and fatty acid composition of Azolla and diets
Essential amino acid (EAA) of A.
filiculoides and experimental diets are
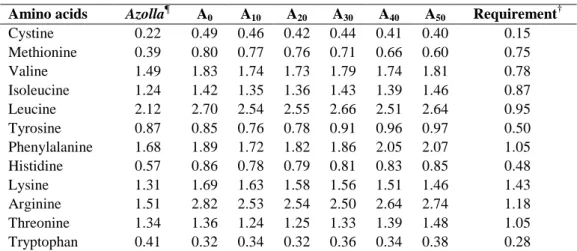
presented in Table 2. Compared to the requirements of Tilapia (NRC, 1993), A.
filiculoides is poor in methionine. This amino
acid is also deficient in diets A30, A40 and A50.
2227 different experimental diets meet the requirements for Tilapia (NRC, 1993).
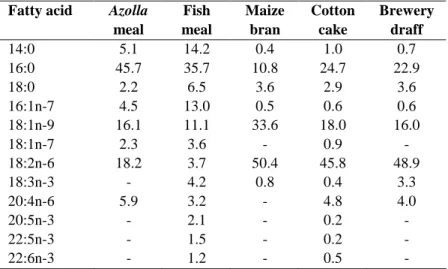
The percentages of fatty acids in A.
filiculoides, in the different feedstuffs and in
experimental diets are presented in Tables 3 and 4. The most abundant fatty acids found in
A. filiculoides were palmitic acid (16:0), oleic
acid (18:1n-9) and linoleic acid (LA, 18:2n-6). All experimental diets showed similar percentages for palmitic acid (27.3-29.3%), stearic acid 18:0 (10.1-12.4%) and oleic acid (16.4-20.4%). Percentages of 14:0 (2.2-6.9%), 16:1n-7 (2.0-4.4%), 18:3n-3 (1.0-2.4%), 20:5n-3 (0.6-1.5%), 22:5n-3 (0.1-0.6%) and 22:6n-3 (0.1-0.4%) decrease with decreasing FM in diets, whereas LA (18:2n-6) and arachidonic acid (ARA, 20:4n-6) levels tend to increase with increasing AM, with values ranging from 24.9% to 29.9% and from 1.4% to 4.1%, respectively.
Growth and body composition of experimental fish
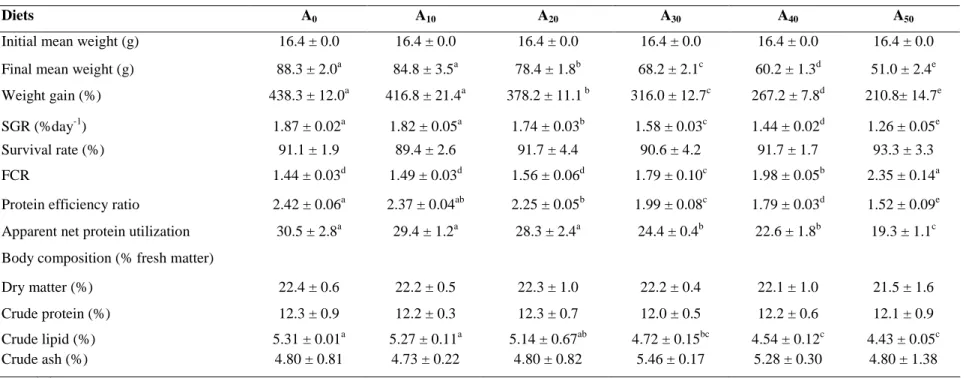
As presented in Table 5, no significant differences were found in survival rate (P > 0.05). The growth rates and feed utilization efficiency of O. niloticus were significantly affected (P < 0.05) by the dietary AM level (Table 5). The final mean weight (range: 51.0-88.3 g) and the weight gain (range: 210.8-438.3%) decreased as AM level higher than 10% in the diets. The FCR (range: 1.44-2.35) increased when AM level is superior to 20% in the diets. Accordingly, PER and ANPU decreased when the level of AM was higher than 10% and 20%, respectively.
Data on Nile tilapia body composition are also presented in Table 5. No significant differences were found in moisture, crude protein and crude ash among fish fed with all experimental diets (P > 0.05). Carcass lipid decreased significantly when AM level exceeded 20% in diets (P < 0.05).
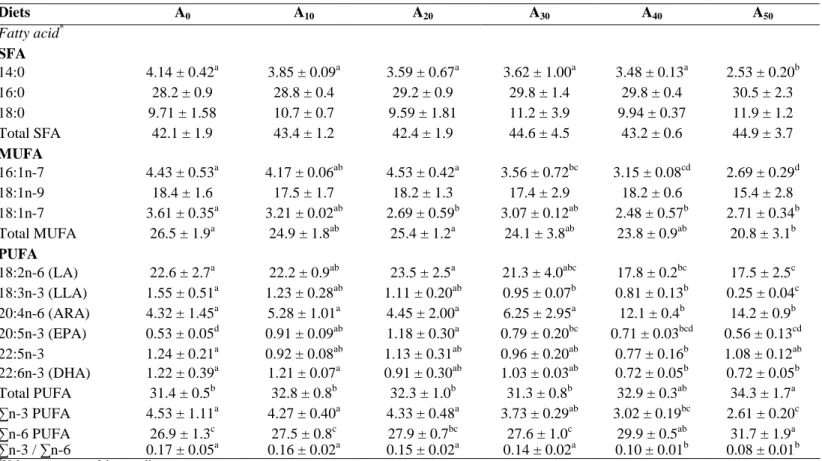
The concentrations in fatty acids of the whole body of the experimental fish are presented in Table 6. Data showed that fatty
acid composition in fish was influenced by the composition in the diet fed. Indeed, fatty acids found in high concentrations in the diets were also the most abundant in fish. 16:0, 18:1n-9 and 18:2n-6 were the most abundant fatty acids in the diets and fish (Tables 4 and 6), and levels of these fatty acids in fish ranged from 28.2 ± 0.9% to 30.5 ± 2.3% for 16:0, 15.4 ± 2.8% to 18.4 ± 1.6% for 18:1n-9 and 17.5 ± 2.5% to 22.6 ± 2.7% for 18:2n-6. Palmitoleic acid (16:1n-7) and vaccenic acid (18:1n-7) levels in fish decreased significantly (P < 0.05) as AM level increased in diets, with values decreasing from 4.4 ± 0.5% to 2.7 ± 0.3% for 16:1n-7 and from 3.6 ± 0.3% to 2.7 ± 0.3% for 18:1n-7.
LA level decreases significantly in fish fed with high AM in diets whereas ARA increased (P < 0.05). The poly-unsaturated (n-3) fatty acids (n-3 PUFAs) group is the family of fatty acids that were presented at lower levels in fish. Level of linolenic acid (LLA, 18:3n-3) decreases in fish, the difference being significant when fish consumed diets
containing more than 30% AM.
Eicosapentaenoic acid (EPA) and
clupanodonic acid levels varied significantly in fish, whereas a decreasing trend was found for docosahexaenoic acid (DHA) level (P < 0.05), the lowest values being observed in fish fed A40 and A50.
Total saturated fatty acids levels were similar in all experimental fish (P > 0.05). The total of fatty acids of (n-3) series ranged from 2.61 to 4.51, the lowest values being obtained in fish fed A40 and A50 (P < 0.05). In contrary,
these fish showed significantly higher values for (n-6) fatty acids series (P < 0.05). As a consequence, the ratio n-3/n-6 calculated (range: 0.08-0.17) were lower in fish fed A40
2228
Table 1: Formulation and proximate composition of experimental diets used for feeding Nile tilapia in concrete tanks for 90 days.
Diets A0 A10 A20 A30 A40 A50 Ingredients (g.100g-1 diet) Fish meal 30 25 20 15 10 5 Azolla meal 0 10 20 30 40 50 Cottonseed meal 30 30 30 30 30 30 Maize bran 18 17 16 15 14 10 Brewery draff 20 16 12 8 4 3 Binder* 1 1 1 1 1 1 Salt (NaCl) 1 1 1 1 1 1 Proximate composition¥ Dry matter (%) 90.3 90.2 91.1 89.4 90.5 90.3 Crude protein (% DM) 29.3 29.3 29.2 29.1 29.2 29.0 Crude lipid (% DM) 10.8 10.0 9.4 9.0 8.4 8.0 Crude ash (% DM) 14.3 13.8 12.5 12.2 10.9 10.0 Crude fibre§ (% DM) 9.9 10.0 10.2 10.4 10.5 10.8 NFE† (% DM) 35.7 36.8 38.7 39 .4 41.0 42.2 Gross energy‡ (kJ.g-1) 17.0 16.9 16.9 16.9 17.0 17.0
*Cassava starch, obtained after cassava processing and bought in local market. ¥ Means of two analyses values.
§Calculated according to Ovograin Feeds Depot, Abomey-Calavi, Bénin and Leonard (1997) for ingredients
and Azolla filiculoides, respectively.
†
Nitrogen-Free Extract, calculated as: 100-(%protein + %lipid + %ash + %crude fibre).
‡Calculated by using conversion factors of 23.0, 38.1 and 17.2 kJ.g-1 for protein, lipids and carbohydrates
(Tacon, 1990). DM : dry matter.
Table 2: Essential amino acid (EAA) composition (% on dry matter basis) of A. filiculoides and experimental diets used for feeding Nile tilapia in concrete tanks for 90 days.
†Essential amino acid requirements (g.100 g-1 feed) for tilapia taken from NRC (1993).
¶Azolla filiculoides strain was used.
Amino acids Azolla¶ A0 A10 A20 A30 A40 A50 Requirement † Cystine 0.22 0.49 0.46 0.42 0.44 0.41 0.40 0.15 Methionine 0.39 0.80 0.77 0.76 0.71 0.66 0.60 0.75 Valine 1.49 1.83 1.74 1.73 1.79 1.74 1.81 0.78 Isoleucine 1.24 1.42 1.35 1.36 1.43 1.39 1.46 0.87 Leucine 2.12 2.70 2.54 2.55 2.66 2.51 2.64 0.95 Tyrosine 0.87 0.85 0.76 0.78 0.91 0.96 0.97 0.50 Phenylalanine 1.68 1.89 1.72 1.82 1.86 2.05 2.07 1.05 Histidine 0.57 0.86 0.78 0.79 0.81 0.83 0.85 0.48 Lysine 1.31 1.69 1.63 1.58 1.56 1.51 1.46 1.43 Arginine 1.51 2.82 2.53 2.54 2.50 2.64 2.74 1.18 Threonine 1.34 1.36 1.24 1.25 1.33 1.39 1.48 1.05 Tryptophan 0.41 0.32 0.34 0.32 0.36 0.34 0.38 0.28
2229
Table 3: Fatty acid composition (% total fatty acids) of A. filiculoides and ingredients used in the experimental diets.
Fatty acid Azolla meal Fish meal Maize bran Cotton cake Brewery draff 14:0 5.1 14.2 0.4 1.0 0.7 16:0 45.7 35.7 10.8 24.7 22.9 18:0 2.2 6.5 3.6 2.9 3.6 16:1n-7 4.5 13.0 0.5 0.6 0.6 18:1n-9 16.1 11.1 33.6 18.0 16.0 18:1n-7 2.3 3.6 - 0.9 - 18:2n-6 18.2 3.7 50.4 45.8 48.9 18:3n-3 - 4.2 0.8 0.4 3.3 20:4n-6 5.9 3.2 - 4.8 4.0 20:5n-3 - 2.1 - 0.2 - 22:5n-3 - 1.5 - 0.2 - 22:6n-3 - 1.2 - 0.5 -
Table 4: Percentages of fatty acids (% of total fatty acids) in diets containing gradual level of Azolla fed to Nile tilapia reared for 90 days in concrete tanks.
Diet A0 A10 A20 A30 A40 A50 SFA 14:0 6.9 6.6 5.0 4.6 2.9 2.2 16:0 29.1 28.7 28.4 28.6 29.3 27.3 18:0 10.1 11.4 12.4 10.8 11.5 11.2 Total SFA 46.1 46.6 45.8 44.1 43.7 40.7 MUFA 16:1n-7 4.4 4.1 3.7 2.9 2.5 2.0 18:1n-9 16.4 16.8 17.4 18.4 18.4 20.4 18:1n-7 1.9 1.7 1.3 1.8 1.8 1.0 Total MUFA 22.6 22.6 22.4 23.1 22.7 23.4 PUFA 18:2n-6 24.9 24.3 24.8 26.1 27.0 29.9 18:3n-3 2.4 2.4 2.1 1.5 1.5 1.0 20:4n-6 1.4 1.8 3.1 3.5 3.9 4.1 20:5n-3 1.5 1.3 0.9 1.0 0.8 0.6 22:5n-3 0.6 0.6 0.6 0.3 0.1 0.2 22:6n-3 0.4 0.4 0.3 0.3 0.2 0.1 Total PUFA 31.2 30.7 31.7 32.8 33.6 35.9
Table 5: Growth, feed performance and body composition (% fresh matter basis) of Nile tilapia fed in concrete tanks with diets containing increasing level of Azolla filiculoides for 90 days. Data are mean ± S.D. of three replicates. A0 to A50: diet with 0% to 50% Azolla.
Diets A0 A10 A20 A30 A40 A50
Initial mean weight (g) 16.4 ± 0.0 16.4 ± 0.0 16.4 ± 0.0 16.4 ± 0.0 16.4 ± 0.0 16.4 ± 0.0
Final mean weight (g) 88.3 ± 2.0a 84.8 ± 3.5a 78.4 ± 1.8b 68.2 ± 2.1c 60.2 ± 1.3d 51.0 ± 2.4e
Weight gain (%) 438.3 ± 12.0a 416.8 ± 21.4a 378.2 ± 11.1 b 316.0 ± 12.7c 267.2 ± 7.8d 210.8± 14.7e
SGR (%day-1) 1.87 ± 0.02a 1.82 ± 0.05a 1.74 ± 0.03b 1.58 ± 0.03c 1.44 ± 0.02d 1.26 ± 0.05e
Survival rate (%) 91.1 ± 1.9 89.4 ± 2.6 91.7 ± 4.4 90.6 ± 4.2 91.7 ± 1.7 93.3 ± 3.3
FCR 1.44 ± 0.03d 1.49 ± 0.03d 1.56 ± 0.06d 1.79 ± 0.10c 1.98 ± 0.05b 2.35 ± 0.14a
Protein efficiency ratio 2.42 ± 0.06a 2.37 ± 0.04ab 2.25 ± 0.05b 1.99 ± 0.08c 1.79 ± 0.03d 1.52 ± 0.09e
Apparent net protein utilization 30.5 ± 2.8a 29.4 ± 1.2a 28.3 ± 2.4a 24.4 ± 0.4b 22.6 ± 1.8b 19.3 ± 1.1c
Body composition (% fresh matter)
Dry matter (%) 22.4 ± 0.6 22.2 ± 0.5 22.3 ± 1.0 22.2 ± 0.4 22.1 ± 1.0 21.5 ± 1.6
Crude protein (%) 12.3 ± 0.9 12.2 ± 0.3 12.3 ± 0.7 12.0 ± 0.5 12.2 ± 0.6 12.1 ± 0.9
Crude lipid (%) 5.31 ± 0.01a 5.27 ± 0.11a 5.14 ± 0.67ab 4.72 ± 0.15bc 4.54 ± 0.12c 4.43 ± 0.05c
Crude ash (%) 4.80 ± 0.81 4.73 ± 0.22 4.80 ± 0.82 5.46 ± 0.17 5.28 ± 0.30 4.80 ± 1.38
Table 6: Means ± S.D. (% of total fatty acid) of fatty acid levels in the whole body of Nile tilapia O. niloticus fed in tanks with diets
containing gradual level of Azolla filiculoides. A0 to A50: diet with 0% to 50% Azolla. Diets A0 A10 A20 A30 A40 A50 Fatty acid* SFA 14:0 4.14 ± 0.42a 3.85 ± 0.09a 3.59 ± 0.67a 3.62 ± 1.00a 3.48 ± 0.13a 2.53 ± 0.20b 16:0 28.2 ± 0.9 28.8 ± 0.4 29.2 ± 0.9 29.8 ± 1.4 29.8 ± 0.4 30.5 ± 2.3 18:0 9.71 ± 1.58 10.7 ± 0.7 9.59 ± 1.81 11.2 ± 3.9 9.94 ± 0.37 11.9 ± 1.2 Total SFA 42.1 ± 1.9 43.4 ± 1.2 42.4 ± 1.9 44.6 ± 4.5 43.2 ± 0.6 44.9 ± 3.7 MUFA 16:1n-7 4.43 ± 0.53a 4.17 ± 0.06ab 4.53 ± 0.42a 3.56 ± 0.72bc 3.15 ± 0.08cd 2.69 ± 0.29d 18:1n-9 18.4 ± 1.6 17.5 ± 1.7 18.2 ± 1.3 17.4 ± 2.9 18.2 ± 0.6 15.4 ± 2.8 18:1n-7 3.61 ± 0.35a 3.21 ± 0.02ab 2.69 ± 0.59b 3.07 ± 0.12ab 2.48 ± 0.57b 2.71 ± 0.34b Total MUFA 26.5 ± 1.9a 24.9 ± 1.8ab 25.4 ± 1.2a 24.1 ± 3.8ab 23.8 ± 0.9ab 20.8 ± 3.1b PUFA 18:2n-6 (LA) 22.6 ± 2.7a 22.2 ± 0.9ab 23.5 ± 2.5a 21.3 ± 4.0abc 17.8 ± 0.2bc 17.5 ± 2.5c 18:3n-3 (LLA) 1.55 ± 0.51a 1.23 ± 0.28ab 1.11 ± 0.20ab 0.95 ± 0.07b 0.81 ± 0.13b 0.25 ± 0.04c 20:4n-6 (ARA) 4.32 ± 1.45a 5.28 ± 1.01a 4.45 ± 2.00a 6.25 ± 2.95a 12.1 ± 0.4b 14.2 ± 0.9b 20:5n-3 (EPA) 0.53 ± 0.05d 0.91 ± 0.09ab 1.18 ± 0.30a 0.79 ± 0.20bc 0.71 ± 0.03bcd 0.56 ± 0.13cd 22:5n-3 1.24 ± 0.21a 0.92 ± 0.08ab 1.13 ± 0.31ab 0.96 ± 0.20ab 0.77 ± 0.16b 1.08 ± 0.12ab 22:6n-3 (DHA) 1.22 ± 0.39a 1.21 ± 0.07a 0.91 ± 0.30ab 1.03 ± 0.03ab 0.72 ± 0.05b 0.72 ± 0.05b Total PUFA 31.4 ± 0.5b 32.8 ± 0.8b 32.3 ± 1.0b 31.3 ± 0.8b 32.9 ± 0.3ab 34.3 ± 1.7a ∑n-3 PUFA 4.53 ± 1.11a 4.27 ± 0.40a 4.33 ± 0.48a 3.73 ± 0.29ab 3.02 ± 0.19bc 2.61 ± 0.20c ∑n-6 PUFA 26.9 ± 1.3c 27.5 ± 0.8c 27.9 ± 0.7bc 27.6 ± 1.0c 29.9 ± 0.5ab 31.7 ± 1.9a ∑n-3 / ∑n-6 0.17 ± 0.05a 0.16 ± 0.02a 0.15 ± 0.02a 0.14 ± 0.02a 0.10 ± 0.01b 0.08 ± 0.01b
*Values are means of three replicates
SFA, saturated fatty acid; MUFA, mono-unsaturated fatty acid; PUFA, polyunsaturated fatty acid; LA, linoleic acid; LLA, linolenic acid; ARA, arachidonic acid; EPA, eicosapentaenoic acid; DHA, docosahexaenoic acid.
2232 DISCUSSION
The present study showed that the level of AM in diets affects the growth and feed utilization efficiency of Nile tilapia. High level of AM in diets resulted in lower growth. These trends of observed growth variation and FCR followed the results reported by Fasakin et al. (2001) and Fiogbé et al. (2004). The results were also comparable to those reported in several studies with the same purpose of replacing FM by plant protein in Nile tilapia feeding (Hossain et al., 2002; Olvera-Novoa et al., 2002). According to Cole and Van
Lunen (1994), inadequate levels of
indispensable amino acids could result in depression of food intake and growth. Deficiencies of one or more amino acids are known to limit the synthesis of protein, growth, or both (Cole and Van Lunen, 1994). The limiting EAA in A. filiculoides is methionine, with a requirement for optimal growth in tilapia set at 0.75% (NRC, 1993). In the present study, increasing AM level in diets resulted obviously in lower dietary methionine supply. However, due to sparing action of cystine whose values in experimental diets were higher than that the required in tilapia diets, the lower methionine could not be a major reason for lowered growth in fish fed diets A20 to A50.
The proof was given by the observed lowered growth with fish A20 that was fed
with sufficient methionine in their diet. Therefore, the main explanation to the lower growth performance in high AM-fed fish could be the lower nutrient digestibility in the fern. Indeed, Micha and Leonard (2001-2) found that only 64.6% of dry matter of A.
filiculoides is digestible in O. niloticus, in
which only 71.3% of protein is digestible, lower than the rate of about 90-92% generally reported for FM in that species (Watanabe et al., 1996; Sklan et al., 2004). As the fern increased in the diets, the nutrients become progressively unavailable to experimental fish and could leads to a lower growth performance.
In the present study, no negative effects were found in moisture and crude protein of all experimental fish carcasses. Similar findings had been reported in Nile tilapia by Schneider et al. (2004). Conversely, lipid deposition in fish decreased significantly
in fish fed diets containing more than 20% of AM. These results were in agreement with those reported by Hossain et al. (2002) and
Siddhuraju and Becker (2003) who
successfully used Sesbania and Mucuna seed meal, respectively, in diets for O. niloticus. The possible explanations for these variations could be the reduction of FM in diet and the lower contribution by plant protein that contained a high amount of non-digestible cuticles (Afuang et al., 2003).
The percentages of myristic acid, stearic acid, palmitoleic acid, vaccenic acid, LLA, EPA, clupanodonic acid and DHA in diets decreased with decreasing FM, certainly because of the high levels of these fatty acids in FM, compared to AM. The increasing trends of LA and ARA levels in experimental diets are also probably due to the increase of AM, which reaches a higher level of that fatty acid compared to FM (Table 3). As far as we know, this is the first reported study on the effects of replacement of FM by AM on fatty acid composition of Nile tilapia, a tropical omnivorous fish. Data showed that the relative composition of fatty acids in the whole body of fish was in accordance with the profiles of the main dietary items. Similar results had been reported in many studies in which sunflower cake and meat meal was used as FM substitutes (Maina et al., 2003; Williams et al., 2003). These results have also been confirmed in studies linking dietary lipid from several sources to fatty acid profile of fish, mainly Atlantic salmon Salmo salar L. (Bell et al., 2002), Rainbow trout Onchorhynchus
mykiss Walbaum (Caballero et al., 2002) and
Murray cod Maccullochella peelii peelii (Francis et al., 2006). Similar findings were also obtained with O. niloticus fed with sunflower cake and corn oil in replacement of FM (Maina et al., 2003) and with red hybrid Tilapia Oreochromis sp. receiving palm oil-based diets (Bahurmiz and Ng, 2007). The decrease observed in the levels of 14:0 and 16:1n-7 fatty acids in fish were probably due to the decrease of the level of FM in diets, which has a higher content of both fatty acids than are present in AM. Total saturated fatty acids were deposited in fish at a relatively uniform concentration of 42.1 ± 1.9 to 44.9 ± 2.7%, confirming the observations of Bell et al. (2002) and Bahurmiz and Ng (2007) that
2233 fish might maintain a constant level of saturated fatty acids.
In contrast, the level of ARA, clupanodonic acid and DHA in fish are higher than those determined in experimental diets. According to several reports, fatty acid profiles in cultured fish are influenced by the dietary contribution and the ability of experimental fish to de novo synthesize other fatty acids. In a particular case, it was shown that tilapia species possess enzymes that desaturate and elongate the dietary fatty acids of the (n-6) and (n-3) series after they are absorbed. The high values for ARA in fish compared to their levels in diets may be the result of the bioconversion of LA, as Maina et al. (2003) also found in O. niloticus. However, data obtained here showed that this conversion is more pronounced in fish fed with high AM in their diets. This situation is either because of the high content of LA in
AM-based-diets or probably due to
antagonistic effects in high (n-3) fatty acid diets (FM-based). Indeed, Kucska et al. (2006) stated that because of the common enzymes in the metabolic pathways of both 3) and (n-6) series of fatty acids, the (n-3) fatty acids like LLA, EPA and DHA may inhibit the desaturation and elongation process of LA in fish fed with FM-based-diets. On the other hand, it is well established that many freshwater fish (Anderson and Arthington, 1992), salmonids (Dosanjh et al., 1998) and rainbow trout (Mourente and Tocher, 1998) can readily convert LLA to EPA and DHA using metabolic pathways similar to those occurring in higher vertebrates. According to Maina et al. (2003) quoting Olsen et al. (1990) and Takeuchi et al. (1991), Tilapia possesses desaturation and elongation enzymes that efficiently convert C18 PUFAs to longer chain PUFAs. It is plausible and our findings suggest this fact, that LLA was converted to clupanodonic acid and DHA. Despite this bioconversion, the levels of the latter fatty acids decreased in fish when increasing the amounts of AM fed, closely reflecting the
tendency in the distributed diets.
Consequently, the sum of (n-3) fatty acid levels is significantly lower in fish fed diets A40 and A50 while the sum of (n-6) fatty acid
levels was higher in those fish. As result, the values of n-3/n-6 ratios is lower in fish fed A40
and A50, suggesting similar nutritional quality
of the fish until 30% of AM in diets. Conclusion
From this study, high level of AM in diets for Nile tilapia affects growth performances and feed utilization due to lower nutrient digestibility in the fern. In fish fed diets containing AM in gradual replacement of FM, significantly higher deposition of ARA and lower (n-3) fatty acids in fish was resulted. Levels of these fatty acids in fish were influenced by their levels in diets, and the ability of Nile tilapia to bio-convert C18 PUFAs to HUFAs. The findings suggest the feasibility of the replacement of FM with AM up to 30% in the diet, without affecting significantly the nutritional quality of Nile Tilapia. However, feeding that fish in ponds or reaching alternative additional sources of lipids that is rich in n-3 fatty acids could be useful to improve growth and nutritional quality of Nile tilapia fed Azolla-based-diets. REFERENCES
Abou Y, Fiogbé ED, Micha J-C. 2007. A preliminary assessment of growth and production of Nile tilapia, Oreochromis
niloticus L., fed Azolla-based-diets in
earthen ponds. Journal of Applied
Aquaculture, 19(4): 55-69.
Afuang W, Siddhuraju P, Becker K. 2003. Comparative nutritional evaluation of raw, methanol extracted residues and methanol extracts of moringa (Moringa
oleifera Lam.) leaves on growth performance and feed utilization in Nile tilapia (Oreochromis niloticus L.).
Aquaculture Research, 34:1147-1159.
Anderson AJ, Arthington AH. 1992. Influence of diet on the biosynthesis of lipid classes and fatty acids in silver perch, Bidyanus
bidyanus. In Proceeding of Aquaculture Nutrition workshop (ed. By G.L. Allan &
W. Dall), pp.41-45. Salamander Bay, NSW, Australia.
AOAC. 1990. Official Methods of Analysis (15th edn). Association of Official Analytical Chemists: Arlington, VA, USA.
Arts MT, Ackman RG, Holub BJ. 2001. Essential Fatty Acids’ in Aquatic Ecosystems: A Crucial Link between Diet
2234 and Human Health and Evolution.
Canadian Journal of Fisheries and Aquatic Sciences, 58 (1): 122-137.
Bahurmiz OM, Ng W-K. 2007. Effects of dietary palm oil source on growth, tissue fatty acid composition and nutrient digestibility of red hybrid tilapia,
Oreochromis sp., raised from stocking to
marketable size. Aquaculture, 262: 382-392.
Bell JG, Henderson RJ, Tocher DR, McGhee F, Dick JR, Porter A, Smullen RP, Sargent JR. 2002. Substituting fish oil with crude palm oil in the diet of Atlantic salmon (Salmo salar) affects muscle fatty acid composition and hepatic fatty acid metabolism. Journal of Nutrition, 132: 222-230.
Caballero MJ, Obach A, Rosenlund G, Montero D, Gisvold M, Izquierdo MS. 2002. Impact of different dietary lipid sources on growth, lipid digestibility, tissue fatty acid composition and
histology of rainbow trout,
Onchorhynchus mykiss. Aquaculture, 214: 53-271.
Christie WW. 1982. Lipid Analysis.
Pergamon : Oxford ; 207p.
Cole DJA, Van Lunen TA. 1994. Ideal amino acid patterns. In Amino Acid in Farm
Animal Nutrition. D’Mello JPI (ed.). The
Scottish Agricultural College: Edinburgh, UK; 99-112.
Dosanjh BS, Higgs DA, McKenzie DJ, randall DJ, Eales JG, Rowshandili M, Deacon G. 1998. Influence of dietary blends of menhaden oil and canola oil on growth, muscle lipid composition, and thyroidal status of Atlantic salmon (Salmo salar) in
sea water. Fish Physiology and
Biochemistry, 19: 123-134.
Duncan DB. 1955. Multiple range and multiple F-tests. Biometrics, 11: 1-42. FAO. 2006. The State of the World Fisheries
and Aquaculture. FAO: Rome, Italy;
134p.
Fasakin EA, Balogun AM, Fagbenro OA. 2001. Evaluation of Sun-Dried water fern, Azolla africana, and Duckweed,
Spirodela polyrrhiza, in practical diets for
Nile Tilapia, Oreochromis niloticus,
Fingerlings. Journal of Applied
Aquaculture, 11(4): 83-92.
Fiogbé ED, Micha J-C, Van Hove C. 2004. Use of a natural aquatic fern, Azolla
microphylla, as a main component in
food for
Omnivorous-phytoplank-tonophagous tilapia, Oreochromis
niloticus L. Journal of Applied Ichthyology, 20: 517-520.
Folch J, Lees M, Sloane-Stanley GHS. 1957. A simple method for the isolation and purification of total lipids from animal tissues. Journal of Chemistry, 226: 497-509.
Francis DS, Turchini GM, Jones PL, De Silva SS. 2006. Effects of dietary oil source on growth and fillet fatty acid composition of Murray cod, Maccullochella peelii
peelii. Aquaculture, 253: 547-556.
Gross A, Boyd CE. 1998. A digestion
procedure for the simultaneous
determination of total nitrogen and total phosphorus in pond water. Journal of the
World Aquaculture Society, 29: 300-303.
Hartley HO. 1959. Smallest composite designs for quadratic response surface.
Biometrics, 15: 611-624.
Hossain MA, Focken U, Becker K. 2002. Nutritional evaluation of dhaincha (Sesbania aculeata) seeds as dietary protein source for tilapia Oreochromis
niloticus. Aquac. Res., 33: 653-662.
Kucska B, Pál L, Müller T, Bódis M, Bartos Á, Wágner L, Husvéth F, Bercsényi M. 2006. Changing of fat content and fatty acid profile of reared pike (Esox lucius) fed two different diets. Aquaculture
Research, 37: 96-101.
Lamarck in two species of tilapia: The
phytoplanktonophagous Oreochromis
niloticus (L.) and the macrophytophagous Tilapia rendalli (Boulenger). Bulletin des Séances de l’Académie Royale des Sciences d’Outre-Mer, 47: 147-157.
Leonard V, Breyne C, Micha J-C. 1998. Digestibility and transit time of Azolla
filiculoides Lamarck in Oreochromis aureus (Steindachner). Aquaculture Research, 29: 159-165.
Leonard V. 1997. Use of an aquatic fern (Azolla filiculoides) in two species of tropical fish (Oreochromis niloticus and
Tilapia rendalli). Doctoral dissertation,
Catholic University of Louvain, Louvain-la-Neuve, Belgium, 276 p.
2235 Maina JG, Beames RM, Mbugua PN, Iwama
G, Kisia SM. 2003. Partial replacement of fishmeal with sunflower cake and corn oil in diets for tilapia Oreochromis niloticus (Linn): effect on whole body fatty acids.
Aquaculture Research, 34: 595-608.
Mélard Ch. 1986. Bases biologiques de l’élevage intensif du Tilapia du Nil O.
niloticus. Cahiers d’Ethologie Appliquée, 5(3): 1-224.
Micha J-C, Leonard V. 2001-2. Digestibility of the aquatic fern Azolla filiculoides Lamarck in two species of tilapia: the
phytoplanktonophagous Oreochromis
niloticus (L.) and the macrophytophagous Tilapia rendalli (Boulenger. Bulletin des Séances de l’Académie Royale des Sciences d’Outre-Mer, 47: 147-157.
Mourente G, Tocher DR. 1998. The invo incorporation and metabolism of (1-14C) linoleate (18:3n-3) in liver, brain and eyes
of juveniles of rainbow trout
Onchorhynchus mykiss L. and gilthead
sea bream Sparua auratus L. Fish
Physiology and Biochemistry, 18:
149-165.
NRC (National Research Council). 1993.
Nutrient Requirements for Fish. National
Academy Press: Washington, D.C. Olsen RE, Henderson RJ, McAndrew BJ.
1990. The conversion of linoleic acid and
linolenic acid to longer chain
polyunsaturated fatty acids by Tilapia (Oreochromis niloticus) in vivo. Fish
Physiology and Biochemistry, 8: 261-270.
Schneider O, Amirkolaie AK, Vera-Cartas J, Eding EpH, Schrama JW, Verreth, JAJ. 2004. Digestibility, faeces recovery, and related carbon, nitrogen and phosphorus balances of five feed ingredients evaluated as fishmeal alternatives in Nile
tilapia, Oreochromis niloticus L.
Aquaculture Research, 35: 1370-1379.
Siddhuraju P, Becker K. 2003. Comparative nutritional evaluation of differentially
processed mucuna seeds [Mucuna
pruriens (L.) DC. Var. utilis (wall ex
Wight) Baker ex Burck)] on growth performance, feed utilization and body composition in Nile tilapia (Oreochromis
niloticus L.). Aquaculture Research, 34:
487-500.
Shearer KD. 2001. The Effect of Diet Composition and Feeding Regime on the
Proximate Composition of Farmed
Fishes. In Farmed Fish Quality, Kestin SC, Warriss PD (eds). Fishing News Books, Blackwell Science: London; 31-41.
Sklan D, Prag T, Lupatsch I. 2004. Apparent digestibility coefficients of feed ingredients and their prediction in diets for tilapia Oreochromis niloticus x
Oreochromis aureus (Teleostei,
Cichlidae). Aquaculture Research, 35:
358-364.
Steffens W. 1997. Effects of Variation in Essential Fatty Acids in Fish Feeds on Nutritive Value of Freshwater Fish for Humans. Aquaculture, 151: 97-119. Tacon AGJ. 1990. Standard Methods for the
Nutrition and Feeding of Farmed Fish and Shrimp. Argent Laboratories Press:
Washington, DC, USA.
Takeuchi T, Watanabe K, Yong WY, Watanabe K. 1991. Essential fatty acids of grass carp (Ctenopharyngodon idella).
Bulletin of the Japanese Society of Scientific Fisheries, 57: 467-473.
Van Hove C. 1989. Azolla and its multiples uses with emphasis on Africa. FAO Document, 53.
Watanabe T, Takeuchi T, Satoh S, Kiron V. 1996. Digestible crude protein contents of various feedstuffs determined with four freshwater fish species. Fisheries Science, 62: 278-282.
Williams KC, Paterson BD, Barlow CG, Ford A, Roberts R. 2003. Potential of meat meal to replace fish meal in extruded dry diets for barramundi, Lates calcarifer (Bloch). II. Organoleptic characteristics and fatty acid composition. Aquaculture