Sclerostin concentration is not predictive of mortality in hemodialysis patients
Pierre Delanaye, MD, PhD1, Jean-Marie Krzesinski, MD, PhD1, Xavier Warling, MD2, Martial Moonen, MD2, Nicole Smelten, MD3, Laurent Médart, MD4, Hans Pottel, PhD5, Etienne Cavalier, EuSpLM, PhD6.
1. Nephrology-Dialysis-Transplantation, University of Liège, CHU Sart Tilman, Liège, Belgium
2. Nephrology-Dialysis, Centre Hospitalier Régional « La Citadelle », Liège, Belgium 3. Nephrology-Dialysis, Centre Hospitalier « Bois de l’Abbaye », Seraing, Belgium
4. Radiology, Centre Hospitalier Régional « La Citadelle », Liège, Belgium
5. Department of Public Health and Primary Care @ Kulak, University of Leuven, Kulak,
Kortrijk, Belgium
6. Clinical Chemistry, University of Liège, CHU Sart Tilman, Liège, Belgium
Sclerostin, produced by the SOST gene, is an osteocyte-specific glycoprotein and is presented as a potent inhibitor of bone formation. Dialysis patients are prone to bone abnormalities. In this context, the measurement of sclerostin could be of interest and first studies have
demonstrated a potential role of sclerostin in the diagnosis of bone turnover, the prediction of vascular calcification and the mortality. In the present work, we studied the potential role of sclerostin in the prediction of mortality.
Prevalent hemodialysis patients from three independent centers in Liège and surrounding areas, Belgium, were included in this study (Centre Hospitalier Universitaire du Sart Tilman, Centre Hospitalier Régional de La Citadelle, Centre Hospitalier Bois de l’Abbaye de Seraing). The patients were followed after sclerostin measurement and data about global mortality are available at 2 years. Sclerostin was measured with the TECO ELISA (TECO medical, Sissach, CH). Intra- and interassay CV for sclerostin was <10%. We performed a Kaplan-Meier univariate survival analysis. The effect of covariates, including the sclerostin tertile subgroups, on survival was investigated with Cox Proportional Hazards Regression. In our HD patients (n=164), the concentration of sclerostin was 1375 [963; 1830] pg/mL. These concentrations are higher than the median concentration observed in an healthy population 565 [443; 660] pg/mL (p<0.0001) (Figure 1). In Table 1, we showed the clinical and biological data of the HD population. After two years, we observed a mortality rate of 37.2%, i.e. 61 patients. Survivors were significantly younger (71 [57; 79] versus 78 [71; 85] years, p<0.0001) and had the following characteristics: higher albumin levels (39 [37; 41] versus 37 [35; 40] g/L, p=0.0069), lower CRP levels (4.4 [1.8; 10.5] versus 8.3 [4.3; 18.5] mg/L, p=0.0092), lower troponin T levels (0.03 [0.02; 0.05]) versus 0.05 [0.03; 0.08] µg/L, p<0.0001). Sclerostin concentration was not different in survivors and non-survivors after two years of follow-up. Considering tertiles of sclerostin, we did not observe any difference between patients in the low tertile of sclerostin (mortality rate of 31.5%) compared to patients in the combined two highest tertiles (40%) (p=0.3079, Fisher’s Exact test). When the lowest tertile is compared to merged intermediate and highest tertile, comparison of the survival curves results in a non-significant p-value of 0.4549 (log-rank test).
In conclusion, we confirmed a higher concentration of sclerostin in HD patients. We did not find any role for sclerostin to predict mortality.
Tables
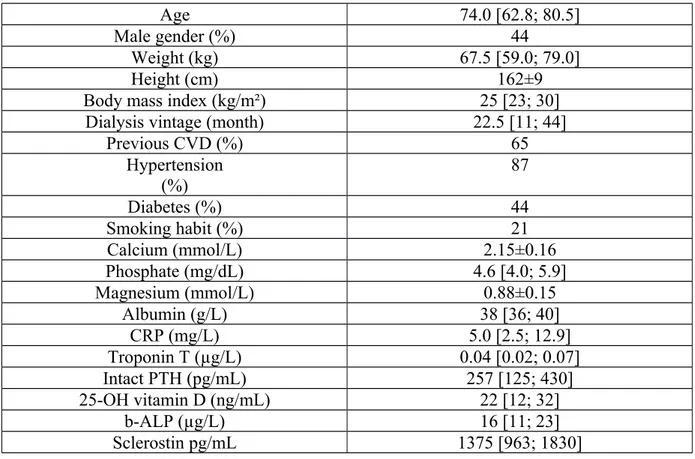
Table 1: Main clinical characteristics and biological data of the population (n=164).
Age 74.0 [62.8; 80.5]
Male gender (%) 44
Weight (kg) 67.5 [59.0; 79.0]
Height (cm) 162±9
Body mass index (kg/m²) 25 [23; 30]
Dialysis vintage (month) 22.5 [11; 44]
Previous CVD (%) 65 Hypertension (%) 87 Diabetes (%) 44 Smoking habit (%) 21 Calcium (mmol/L) 2.15±0.16 Phosphate (mg/dL) 4.6 [4.0; 5.9] Magnesium (mmol/L) 0.88±0.15 Albumin (g/L) 38 [36; 40] CRP (mg/L) 5.0 [2.5; 12.9] Troponin T (µg/L) 0.04 [0.02; 0.07] Intact PTH (pg/mL) 257 [125; 430] 25-OH vitamin D (ng/mL) 22 [12; 32] b-ALP (µg/L) 16 [11; 23] Sclerostin pg/mL 1375 [963; 1830] 2