Spatial OnLine Analytical Processing Applied to Cities Security with
Raster Data
A Case Study on Emergency Services of Brussels Agglomeration
Jean-Paul Kasprzyk [email protected] Guénaël Devillet [email protected] University of Liege SEGEFA 1. IntroductionPublic institutions in charge of cities security are confronted to always more complex and voluminous data. In particular, georeferenced data can be extracted from many sources: mobile phones, social media, cars, security camera, satellite images, crowdsourcing, geography portals, etc. Uses of these data are various. For instance, it is very precious to firefighters in order to fairly distribute their resources (equipment and men) on the territory. These large spatial data sets (“Big Data”) require powerful tools for their extraction and their analysis. For this purpose, an original Spatial OnLine Analytical Processing (SOLAP) model is developed for emergency services. A case study involving firefighters and medical aids of Brussels is presented.
2. State of the art: Spatial OnLine Analytical Processing and raster data
The “Big Data” problem has been the centre of many researches in informatics and geomatics for the last decade: cloud computing, data mining, business intelligence (Chee et al, 2009), etc. Amongst them, SOLAP (Bédard, 2014) allows decision makers to easily and quickly analyse heterogeneous and large spatial data sets. SOLAP tools are all based on a typical architecture including the two following components:
A data warehouse to gather and archive input data with a multidimensional structure (data hypercubes);
A SOLAP server which allows users to freely manipulate data hypercubes through interactive tables, charts and maps.
Data hypercubes are models of pre-aggregated data depending on several dimensions. These dimensions can be time (hours, days, month, years, etc.), space (geographical entities like countries, districts, roads, etc.) or any specific attribute like incident types. Typical SOLAP operations are “Slice” and “Roll Up”. For instance, starting from a map showing firefighters interventions aggregated by districts for the month January 2016, a user can decide to slice the data hypercube on a specific type of intervention (indoor fires, for instance). Then a new map is quickly generated. After that, the user could decide to apply a “Roll Up” operation on time to see a more general level of aggregation on this dimension (for instance, the entire year 2016 instead of January 2016). “Slices” and “Roll Up” can be applied on all dimensions, including the geographical ones. Maps are efficient to represent geographical dimensions but the analysis gets richer when it is combined to tables and charts representing the other dimensions (time, incident type, etc.).
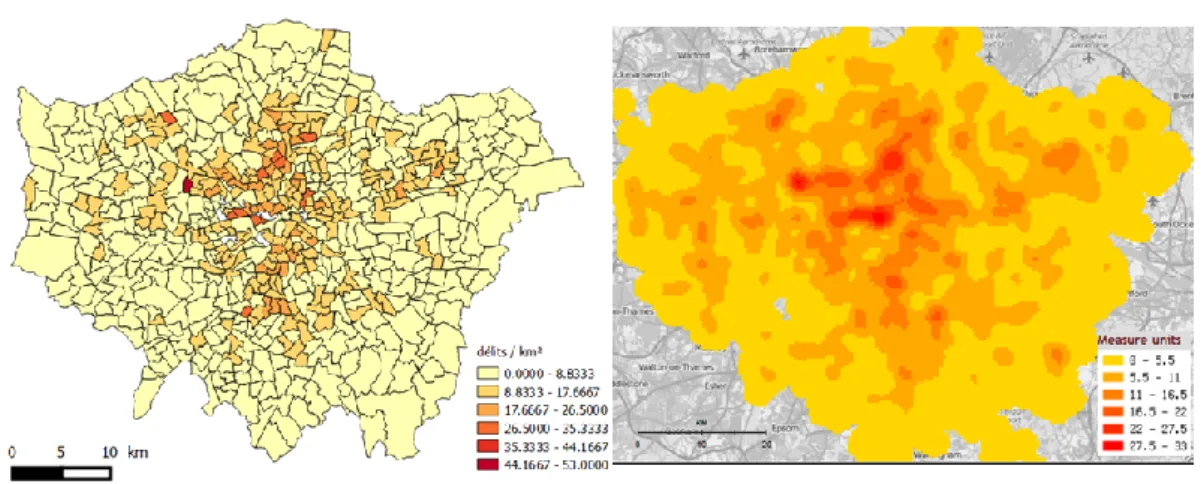
In Geographic Information Systems (GIS), spatial data can be modelled in two ways: vector and raster. Vector uses points, lines and polygons to model geographical entities. It is adapted to a discrete representation of space like data aggregated on districts. On the other hand, raster uses georeferenced arrays of pixels which are more adapted to a continuous representation of space. It is useful to model continuous phenomena like temperature or relief but also to represent densities of points in a continuous space. This particular method uses Kernel Density Estimation (Di Salvo et al, 2005) to transform clouds of points into fields (“heat maps”). For instance, it is often used by police to delimitate hotspots of crimes for prevention purpose (Chainey et al, 2008). Compared to spatially discrete aggregations, heat maps do not suffer too much from the well-known Modifiable Area Unit Problem (Openshaw, 1983). Indeed, aggregations are not based on artificial boundaries which are independent from the original data. Figure 1 shows a comparison between an aggregation in a discrete space (a) and an aggregation in a continuous space (b). Both maps represent burglaries densities in London (Kasprzyk and Donnay, 2016).
Figure 1. Spatial aggregation in a discrete space (a) and in a continuous space (b) (Kasprzyk and Donnay, 2016)
Most of SOLAP tools are only compatible with the vector model and therefore limited to spatially discrete aggregations. Nevertheless, recent researches considered the raster model in SOLAP (McHugh, 2008; Kasprzyk, 2015). Kasprzyk and Donnay (2016) used an original raster SOLAP able to compute heat maps for crime prevention. In this paper, this raster SOLAP is adapted to the needs of firefighters and medical aids. This was implemented for the emergency services of Brussels agglomeration.
3. Risk analysis for emergency services
In order to quickly reach incident locations, emergency services have to fairly distribute their resources on the territory. These resources include fire stations and departure of ambulances with the amount of present men and equipment. In addition to a time constraint (incidents reached in less than x minutes), the overflowing of resources must be avoided. Therefore, their distribution depends on a complex risk model involving various data (Chevalier et al, 2012). In this study, the risk model considers three main aspects:
Recurring risk: the probability of incidents which can be estimated from historical interventions;
Sporadic risk: specific places that would require important resources from emergency services in the event of an incident (schools, prisons, commercial areas, dangerous industries, tunnels and hospitals);
Accessibility: an index which considers the quickest travel time values from resources to every point of the road network.
The raster SOLAP model (Kasprzyk and Donnay, 2016) is adapted to this risk model and implemented for the emergency services of Brussels agglomeration.
4. Raster SOLAP for emergency services of Brussels Agglomeration
The raster SOLAP uses a vector data warehouse gathering the following data:
fire stations and departures of ambulances georeferenced as points;
past interventions from 2012 to 2016 georeferenced as points (around 350 000 incidents);
around 80 school buildings with more than 1000 students;
4 dangerous industrial sites (UE Seveso directive);
2 prisons;
around 80 hospitals;
around 100 main shopping areas (Brussels-Capital Region, 2011);
around 200 tunnels with a length superior to 400m;
the Brussels road network (Open Street Map, 2017).
The SOLAP server allows users to manipulate three data hypercubes depending on the three aspects of the risk analysis: recurring risk, sporadic risk and accessibility. These data hypercubes each have an aggregating measure depending on a specific multidimensional structure.
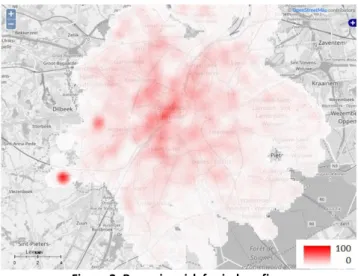
With the “recurring risk” hypercube, users can generate heat maps showing the probability of incidents depending on incident type (indoor fires, outdoor fires, medical aids, etc.), day of week and hour of the day. It is based on the historical past data. As previously said, these maps are continuous in space and do not depend on artificial boundaries. An example is shown in Figure 2 (incident type “indoor fires” for all days of weeks and for all hours of day).
Figure 2. Recurring risk for indoor fires
With the “sporadic risk” hypercube, users can generate maps showing a risk index depending on a “source of risk” dimension. For each source, the risk value depends on the following attributes and finally ranges from 0 to 100:
schools: number of students;
commercial areas: 1 for secondary poles, 2 for primary poles and shopping centres, 3 for “rue Neuve” (a very populated shopping street in Brussels);
industrial sites: 1 for “low risk” industries and 2 for “high risk” industries in the Seveso description;
prisons: 1 for all;
tunnels: 1 for all.
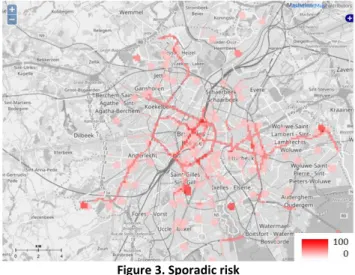
When sources of sporadic risk are aggregated together, their respective values are summed with specific weights that have been set with firefighters of Brussels. These weights reflect the relative importance of source of risk between each other (for instance, hospitals are more important than commercial areas). An example of map for sporadic risk is shown in Figure 3 (including all sources of risk).
Figure 3. Sporadic risk
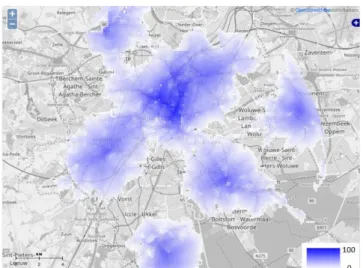
With the “accessibility” hypercube, users can generate maps showing an accessibility index depending on a “resource” dimension (which can be a fire station or a departure of ambulance). For each resource, the accessibility index grows when it gets closer to the resource and ranges from 0 to 100. Its calculation is based on the results of a routing algorithm which calculated the quickest time travel value from a specific resource to every pixel of a raster covering the Brussels territory (depending on the Brussels road network). When users manipulate this hypercube, they first have set a threshold time value (7 minutes, for instance). Beyond this value, the accessibility index is equal to 0. On the resource location, the accessibility is equal to 100. When the resources are aggregated together, the final accessibility index value is calculated by a weighted sum with weights depending on the amount of present men and equipment. These weights can be set on the fly by the user during the analysis. Users can also easily add or remove new resource locations in order to perform simulations on their resources distribution. Note that like the recurring risk maps, the accessibility maps are continuous in space. An example is shown in Figure 4 (including all fire stations with equal weights for a time threshold of 7 minutes).
Figure 4. Accessibility of fire stations with a time threshold of 7 minutes
5. Conclusion
This paper showed the application of an original raster SOLAP model to the problematic of risk analysis for emergency services of Brussels agglomeration. A data warehouse archives all the data needed for the analysis. Based on this data warehouse, two data hypercubes are built to allow users to freely generate different risk maps in a continuous space. These maps can depend on several dimensions (like time, source of risk, incident type, etc.) and can easily be compared to accessibility maps provided by a third data hypercube. With the accessibility hypercube, it is possible to perform simulations about resource distributions (locations of fire stations, locations of departures of ambulances and amount of present men/equipment). These simulations allow emergency services of Brussels to fairly distribute their resources on the territory in order to be able to quickly reach incidents locations.
Bibliography
Y. Bédard, “Beyond GIS: Spatial Online Analytical Processing and Big Data”, The 2014 Dangermond Lecture, Santa-Barbara, 2014.
Brussels-Capital Region. Retail Observatory 2011, available at <http://urbanisme.irisnet.be/pdf/observatoire-du-commerce-2011>, retrieved [January, 2017].
S. P. Chainey, L. Tompson, and S. Uhlig, “The utility of hotspot mapping for predicting spatial patterns of crime”, Security Journal, vol. 21, 2008, pp. 4-28.
T. Chee et al., “Business Intelligence systems: state-of-the-art review and contemporary applications, Symposium on Progress in Information and Communication Technology”, Kuala Lumpur, 2009, pp. 96-101.
P. Chevalier et al, Locating fire stations: An integrated approach for Belgium, Socio-Economic Planning Sciences, Vol. 46(2), 2012, pp. 173–182.
M. Di Salvo, M. Gadais, and G. Roche-Woillez, The kernel density estimation : methods and tools (L’estimation de la densité par la méthode du noyau: méthodes et outils), Lyon : Certu, 2005.
J. P. Kasprzyk, Integration of spatial continuity in the multi-dimensional structure of a data warehouse – raster SOLAP (Intégration de la continuité spatiale dans la structure multidimensionnelle d’un entrepôt de données – SOLAP raster), PhD, Université de Liège, 2015, Available at <http://hdl.handle.net/2268/182360>.
J. P. Kasprzyk and J. P. Donnay, A raster SOLAP for Visualization of crime data fields. GEOProcessing 2016 : The Eighth International Conference on Advanced Geographic Information Systems, Applications, and Services, Venice, 24-28 april 2016, pp. 109-117.
R. McHugh, Integration of the matrix structure in spatial cubes (Intégration de la structure matricielle dans les cubes spatiaux), Master thesis. Université Laval, Québec, 2008.
S. Openshaw, The modifiable areal unit problem. Norwick (Norfolk), Geo Books, 1983.