Searching for behavior relating to grey matter volume in a-priori defined right dorsal premotor regions: lessons learned.
Sarah Genon*1,4,8, Tobias Wensing*1,2,3, Andrew Reid9, Felix Hoffstaedter1, Svenja Caspers1,5, Christian Grefkes6,7, Thomas Nickl-Jockschat2,3, Simon B. Eickhoff1,8
1Institute of Neuroscience and Medicine, INM-1, Research Centre Jülich, Germany
2Department of Psychiatry, Psychotherapy and Psychosomatics, Medical Faculty, RWTH Aachen,
Germany
3JARA - Translational Brain Medicine, Aachen
4GIGA-CRC In Vivo Imaging, University of Liege, Belgium
5C. u. O. Vogt-Institute for Brain Research, Heinrich-Heine-University Düsseldorf, Germany
6Department of Neurology, University of Cologne, Germany 7Institute of Neuroscience and Medicine, INM-3, Research Centre Jülich, Germany 8Institute of Systems Neuroscience, Medical Faculty, Heinrich-Heine University Düsseldorf, Germany
9Department of Artificial Intelligence, Donders Centre for Cognition, Radboud University Nijmegen, The Netherlands.
* These authors contributed equally to the study
Corresponding author: Sarah Genon, Institut für Neurowissenschaften und Medizin (INM-1), Forschungszentrum Jülich GmbH, D-52425 Jülich, Germany. E-mail: s.genon@fz-juelich.de.
Abstract (max 250 words)
Recently, we showed that the functional heterogeneity of the right dorsal premotor (PMd) cortex could be better understood by dividing it into five subregions that showed different behavioral associations according to task-based activations studies. The present study investigated whether the revealed behavioral profile could be corroborated and complemented by a structural brain behavior correlation approach in two healthy adults cohorts.
Grey matter volume within the five volumes of interest (VOI-GM) was computed using voxel-based morphometry. Associations between the inter-individual differences in VOI-GM and performance across a range of neuropsychological tests were assessed in the two cohorts with and without correction for demographical variables. Additional analyses were performed in random smaller subsamples drawn from each of the two cohorts.
In both cohorts, correlation coefficients were low; only few were significant and a considerable number of correlations were counterintuitive in their directions (i.e., higher performance related to lower GMV). Furthermore, correlation patterns were inconsistent between the two cohorts. Subsampling revealed that correlation patterns could vary widely across small samples and that negative correlations were as likely as positive correlations.
Thus, the structural brain/behavior approach did not corroborate the functional profiles of the PMd subregions inferred from activation studies, suggesting that local recruitment by fMRI studies does not necessarily imply covariance of local structure with behavioral performance in healthy adults. We discuss the limitations of such studies and related recommendations for future studies.
Key words: structural brain behavior, functional characterization, voxel-based morphometry, replication, type S error.
I. Introduction
Understanding the relationship between brain and behavior is the essence of cognitive neuroscience. Within the brain mapping perspective, brain-behavior relationships are addressed by behavioral characterization of brain regions, i.e., by assigning behavioral functions to brain specific grey matter units. A challenging region in this respect is the dorsal premotor cortex (PMd). Representing an interface between prefrontal and motor regions, it showed rostro-caudal organization as well as functional inferior-superior differentiation and a diverse profile of associated behavioral functions (e.g. (Picard and Strick 2001; Hanakawa 2011)). Recently, we identified five functional subregions within the right dorsal PM (PMd) by multi-modal connectivity-based parcellation (CBP) based on co-activations of right PMd voxels during thousands of activation (task-based fMRI and PET) studies. In order to characterize the delineated functional parcels of the right PMd in terms of associated behavioral functions, we examined hundreds of activation studies reporting activation peaks in the right PMd parcels using quantitative forward and reverse inferences based on the BrainMap (Laird et al. 2011) database (Genon et al. 2016a). As illustrated in Figure 1, this approach revealed a clear cognitive-motor gradient in terms of recruitment by fMRI tasks along the rostro-caudal axis. The rostral PMd was mainly activated by higher order cognitive functions, such as working memory and attention, the caudal PMd mainly by motor tasks, while the central PMd showed a mixed profile, i.e., was activated by both “higher cognitive” and “basic motor” paradigms. The ventral subregion was mainly recruited by tasks related to eye movements, such as visual attention, suggesting premotor eye field properties, whereas the dorsal subregion was mainly activated by paradigms using finger movement and sequence/rhythm aspects.
As noted, the behavioral characterization of the right PMd parcels was based on a quantitative assessment of activation studies recruiting the respective clusters. Nevertheless, such an approach provides a pattern that is inherently limited to the task-based fMRI and PET studies. Behavioral tasks used in fMRI and PET experiments, in turn, may have limited ecological validity. Furthermore, the performance is frequently constrained within a predefined range due to behavioral design parameters (such as limited reaction-time) or to subsequent analysis parameters (for example, contrast between task success and failure in an event-related design requires a sufficient number of events in both conditions). In addition, the collection of studies can be biased towards the most popular behavioral domain or paradigm classes in cognitive neurosciences. In a related issue, our quantitative approach of activation studies is based on reported activation peaks from published studies. That is, only studies that have been published are taken into account, rendering the results potentially susceptible to publication bias (Rothstein et al. 2006). Therefore, there is a strong need for corroborating and complementing this behavioral characterization from task-activation data by alternative information from a large-scale analysis based on complementary cerebral data.
During the past decade, there has been an increased number and prominence of structural brain-behavior correlations either to explore the morphometric correlates of inter-individual variations in specific behavioral aspects (e.g. (Smolker et al. 2015), or confirm the conceptual relationship between a given brain region and a behavioral function (e.g. (Wolk et al. 2011)). In a review paper, Kanai and Rees (2011) collected evidence that interindividual variability in behavior/cognition can be related to interindividual variability in brain structural features, such as grey matter volume (GMV), cortical thickness (CT) or white matter (WM)-derived measures. Importantly, the relationships between brain and behavior highlighted in previous structural brain behavior studies include a wide range of behavioral aspects or phenotypes. These range from basic
perceptual abilities (e.g. (Kanai et al. 2011)), to action related processes (e.g. (van Gaal et al. 2011)), higher cognitive functions (e.g. (Taki et al. 2011; Genon et al. 2014; Genon et al. in press)) and complex phenotypes captured by interviews and questionnaires (e.g. (Nostro et al. 2016)). Given the wide range of behavioral aspects whose variability correlates with inter-individual variability of brain structure, structural brain-behavior correlation appears as a promising approach for examining brain-behavior relationship. Therefore, we assumed that the heterogeneous profile of behavioral associations of the right PMd parcels revealed by task-based functional data could be corroborated and complemented by using a structural brain behavior correlation approach.
One measure for examining grey matter brain structure is grey matter volume (GMV) as computed with voxel-based morphometry (VBM). During the past decade, VBM has stood as the most widely used method for such purpose. It has been demonstrated that GMV yielded by VBM does convey relevant neurobiological aspects of brain structure, as whole brain GMV pattern extracted by VBM can be accurately related to biological variables such as age (Luders et al. 2016) and can capture meaningful structural changes in aging and neurodegenerative pathology (e.g.(Draganski et al. 2013; Gee et al. 2017)), as well as structural neuroplasticity related to training (Draganski et al. 2004). Of note, some authors have pointed out the uncertainty of the biological interpretation of VBM-based findings considering that VBM outcomes reflect changes in several structural aspects including cortical thickness, cortical volume and cortical folding, and thus suggested that surface-based measures could be additionally used to specifically examine one aspect or another (Palaniyappan and Liddle 2012; Kong et al. 2015). However, VBM and surface-based approach as provided by Freesurfer (Dale et al. 1999) differ in several technical regards. Consequently, if divergent findings between VBM and cortical thickness based on surface are observed, the differences are challenging to interpret, as the divergence could be attributed either to the different biological aspects captured by the two approaches or to the methodology (Hutton et al. 2009). One
alternative approach to surface-based cortical thickness is voxel-based cortical thickness (VBCT). Nevertheless, a recent study has shown that while GMV showed a consistent pattern of association with cognitive score, CT as computed with VBCT in the same sample showed poor sensitivity in correlation with behavior (Manard et al. 2016). Thus, GMV as computed with VBM appeared as a neurobiologically meaningful measure likely to correlate with behavioral performance and thus that has the potential to reveal specific relationship between brain regions and behavior.
The present study examined behavioral characterization of the right PMd functional parcels revealed by a structural brain behavior correlation approach between GMV and a range of behavioral measures. Importantly, for the last few years, cognitive neurosciences have been facing a replication crisis (e.g. (Ioannidis 2005; Pashler and Wagenmakers 2012; Eklund et al. 2016)) that has incited collection of big data samples and replication studies. More recently, the replication issue has concerned studies assigning brain regions to behavioral functions through structural brain behavior correlation, questioning the replication of the findings of those studies in healthy young subjects (Boekel et al. 2015). The same concerns should hold true for the reverse purpose, that is, assigning behavioral functions to brain modules using structural brain-behavior correlation. Acknowledging these concerns, characterizing the right PMd parcels with a structural brain behavior correlation approach should thus be performed on data samples of substantial size. Therefore, in the current study, we investigated the relationship between grey matter volume (GMV) of the five PMd parcels and behavioral performance in two large samples of healthy adults. We additionally examined how stable the correlations were across smaller subsamples covering different sample sizes including smaller size commonly used in structural brain-behavior correlation studies. We expected the pattern of correlation to mirror the behavioral preferences of the parcels revealed by activation studies and to be positive in nature, i.e., better performance should correspond to higher local GMV across subjects, nevertheless, we did not constrain our
correlation analyses to any specific behavioral measures or any correlation direction, thus considering all patterns revealed by the data.
II. Methods
II.1. Subjects
Structural brain behavior correlations were based on data acquired at the Research Centre Jülich (FZJ), Germany, and at the Nathan S. Klein Institute (NKI), New York, USA (Nooner et al. 2012). Both cohorts data collection received ethics agreements from local institutional committees and all subjects gave informed written consent prior to any testing. Subjects were free of any recent neurological or psychiatric disorders as verified by structured interviews and questionnaires including the Beck Depression Inventory (BDI-II; (Hautzinger et al. 2006)). Hand preference was assessed using the Edinburgh Handedness Inventory (EHI; (Oldfield 1971)). Subjects exceeding the cut-off score for mild depression (BDI > 14) and those with left or ambidextrous hand preference (EHI < 48; cf. (Oldfield 1971)) were excluded from further analysis. Both cohorts were globally matched for age and gender, resulting in a total of 222 healthy subjects (FZJ = 87, NKI = 135; Table 1).
Table 1. Sample Characteristics
FZJ NKI t-/Χ2-statistic p-value
N 87 135 Age (± SD) 44.25 (14.03) 47.45 (15.20) -1.58 .116 Age Range 21-71 20-75 Gender (% female) 54.02 61.48 1.21 .329 BDI (± SD) 2.79 (3.27) 2.79 (2.48) -.09 .931 EHI (± SD) 85.47 (15.37) 84.67 (13.80) .41 .686 Education (Years) 14.76 (4.13) 15.47 (2.29) -1.66 .098
Note: SD = Standard Deviation, BDI = Beck Depression Inventory, EHI = Edinburgh Handedness Inventory, t = Student’s t-test statistic, Χ2 = Chi-square test statistic, significant p-value threshold set at p < .05.
II.2. Behavioral measures
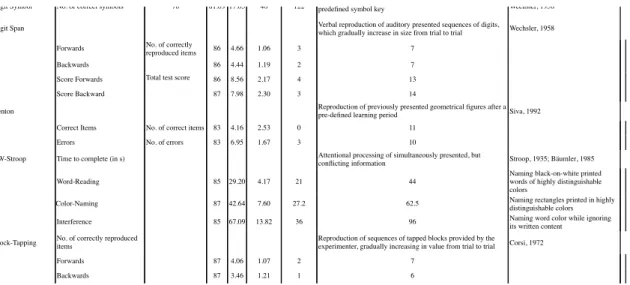
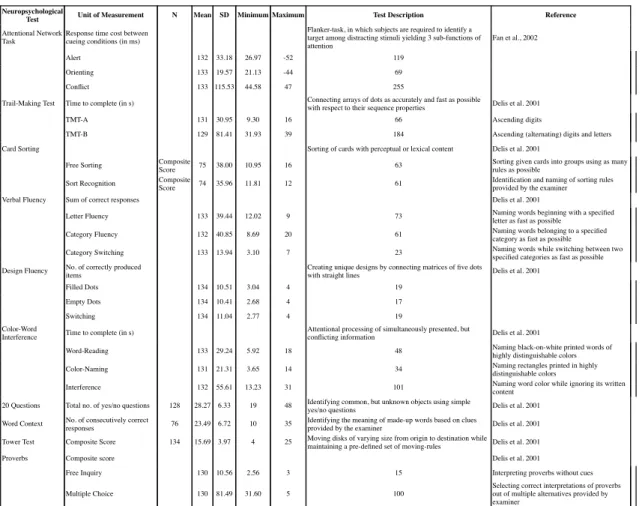
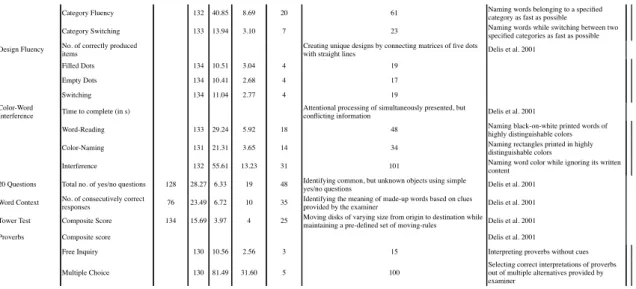
All subjects performed batteries of standard neuropsychological tests assessing cognitive functions, such as attention, executive functions, working memory, verbal fluency, as well as tests on basic motor performance detailed in supplementary tables S2 & S3. Some behavioral paradigms were similar in both cohorts, such as the Trail Making Test (TMT) and Stroop test/Color Word Interference Test. However, basic motor performance was only assessed in FZJ, while abstraction/fluid intelligence abilities were only assessed in NKI. Subjects with outlier scores in one of the neuropsychological tests (scores of ± 3 standard deviations (SD) from the mean) were excluded in a case-wise fashion (of note, the number of outliers removed for each test was < 10).
II.3. Image acquisition, preprocessing and GM extraction
Structural T1 weighted MR scans for both samples were acquired on Siemens 3 Tesla whole-body scanners (FZJ: TR = 2.25 s, TE = 3.03 ms, flip angle = 9°, resolution = 1 mm isotropic; NKI: TR = 2.5 s, TE = 3.5 ms, flip angle = 8°, resolution = 1 mm isotropic). T1 images were processed using the VBM8 toolbox (http://dbm.neuro.uni-jena.de/vbm.html) implemented in SPM8 (http://www.fil.ion.ucl.ac.uk/spm) using standard settings. Images were corrected for bias-field inhomogeneities, segmented into gray matter (GM), white matter (WM) and cerebrospinal fluid (CSF) and adjusted for partial volume effect (with a simplified mixed model of at most two tissue types: GM-WM and GM-CSF). This procedure results in an estimation of the amount (or fraction) of each tissue type present in every voxel. Normalization was performed to the Montreal Neurological Institute (MNI) stereotaxic space and included non-linear modulation of the
segmented images in which the value of each voxel is modulated by the Jacobian of the warp field (i.e. Jacobian determinants from the spatial normalization; (Good et al. 2001)).
Regional gray matter volumes (GMV) were then computed by the sum of the modulated voxel-wise values within each of the five right PMd VOIs. i.e., caudal (784 voxels), central (1049 voxels), rostral (1035 voxels) ventral (685 voxels) and dorsal (590 voxels). The GMV values within the VOIs (VOI-GM) were corrected for total brain volume (TBV, i.e., GM + WM) to account for individual differences in brain size as it has been suggested that the use of the standard modulation in combination with intracranial volume as covariate gives more reliable results (Malone et al. 2015).
Thus, in sum, this procedure yielded a value of GM for each parcel (rostral GM, central VOI-GM, caudal VOI-VOI-GM, ventral VOI-GM and dorsal VOI-GM) in each individual subject.
II.4. Correlation analysis
In order to identify demographic variables accounting for variations in both behavioral measures and VOI-GM, we first performed Pearson’s product-moment correlations between demographic factors (age, gender and education) and both sets of variables. In both cohorts, this preliminary analysis revealed associations of the demographic covariates with subjects neuropsychological test performance and some VOI-GM (see Supplementary Material). Age, gender and education may hence influence the covariance between behavioral measures of interest and VOI-GM. Therefore, the relationship between VOI-GM and neuropsychological measures was examined by partial correlation (as implemented in SPSS: https://statistics.laerd.com/spss-tutorials/partial-correlation-using-spss-statistics.php) accounting for the confounding effect of these covariates. Nevertheless, recent replication studies have brought confusion regarding the effect of correction for confounding covariates by suggesting that correction for nuisance variables can actually increase effect size (Boekel et al. 2016; Muhlert and Ridgway 2016). Furthermore, for sake of
parsimony, adjustment was performed by assuming an (only) linear relationship between age and our variables of interest (VOI-GM and behavioral scores) and by assuming that time spent in formal education is an accurate measure of cognitive/intellectual training, while these assumptions may not be fully met. In order to investigate such potential detrimental effect of confound-adjustment on the correlation patterns (be it by increasing effect size or, reversely, obscuring true association), we additionally performed full (crude) Pearson correlation analyses between VOI-GM and neuropsychological measures without accounting for demographic covariates.
In addition to the aforementioned concerns about adjustment for demographic covariates, there is an ongoing debate about the influence of sample size and power in structural brain behavior correlation and neuroimaging in general (e.g. (Friston 2012; Button et al. 2013; Friston 2013; Ingre 2013; Carter et al. 2016)). While it is generally admitted that larger sample sizes provide more accurate account of the studied effects, recent studies have demonstrated low-powered experiments may actually yield stronger evidence than high-powered ones (Wagenmakers et al. 2015a; Wagenmakers et al. 2015b). In order to explore to which extent the relationship between neuropsychological measures and VOI-GM revealed in the two large samples can be evidenced in sample sizes used in standard structural brain behavior correlation studies, we performed partial correlations in 1000 random subsamples of i) 15 subjects ii) 30 subjects from each cohort (i.e. FZJ and NKI, separately), as well as iii) 60 subjects in NKI.
For all correlation analyses, statistical significance was set at p < .05 (without correction for multiple comparisons to balance the analysis towards sensitivity rather than specificity).
II. 5. Sanity check
check was performed at several stages and for both structural data and behavioral data.
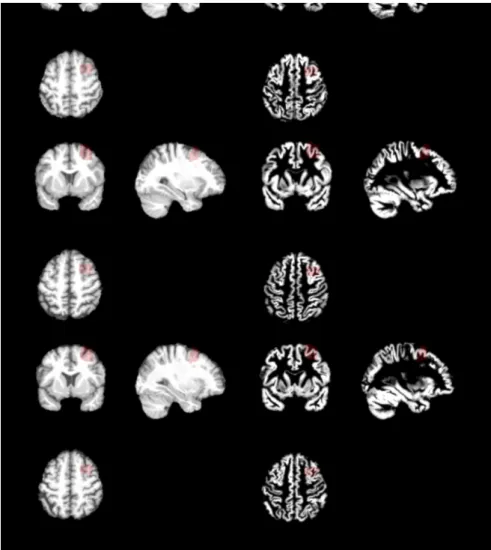
Raw structural images in native space, as well as derived normalized GM images were manually checked for major artifacts, deformations, displacements, structural abnormalities or tissues segmentation errors. In order to illustrate the data quality and in particular accurate segmentation, the anatomical images normalized to standard space and the resulting normalized modulated GM segment image of three random subjects from each cohorts (with the rostral VOI highlighted in red for helping visual comparison) are illustrated in the Supplementary Material. Furthermore, we performed data quality measurements with the CAT toolbox implemented in SPM12 (http://www.neuro.uni-jena.de/cat/) for each sample, which computes the covariance of each non-linearly modulated gray matter segment over the respective sample. Checking sample homogeneity thereby revealed that one subject in FZJ (Figure S2A) cohort showed a covariance score of less than two standard deviations of the mean, while seven subjects were such outliers in the NKI sampled (Figure S2B). Careful visual inspection of these subjects nevertheless did not reveal any global artifact or deformation (Figure S3). It seemed that local pattern of deviation related either to local atrophy made these images less similar than their relative samples. Thus, this additional quality checking confirmed that the structural data has been accurately preprocessed and ensured data quality in the region of interest (PMd).
Furthermore, in both cohorts, total brain volume (TBV) showed significant negative correlation with age. In addition, global covariance between behavioral performance and age was explored in both cohorts. In FZJ, all neuropsychological tests showed correlation between at least one of its derived index and age (except hand-arm movement task in which only a marginally significant correlation was observed between right hand-arm movement and age, p = .051). In NKI, TMT, Card Sorting and Design Fluency showed significant correlation with age, but ANT, CWI, Word context test, Tower of London, Proverbs and Verbal Fluency tests did not show significant correlations with age.
In order to further ensure that a structural brain behavior correlation approach was valid in our data, we performed whole brain correlation structural brain behavior with basic motor performance. The median score at Hand-Arm movement task was introduced in a SPM General Linear Model (GLM) when adjusting for demographical variables (age, gender and education). In line with our VOI correlation analysis, we searched for a significant correlation without controlling for multiple testing (i.e. at p uncorrected for multiple comparison in SPM). Nevertheless, only cluster of minimum 10 voxels were considered. The anatomical localizations of the significant clusters were labeled according to cytoarchitecture maps with the SPM Anatomy toolbox (Eickhoff et al. 2005). We found a significant correlation between basic motor performance and GMV in the right (MNI coordinates: 12 -31 72; 82 voxels) and left (MNI coordinates: -18 -28 69, 29 voxels) primary motor cortex (Area 4), as well as in the right supramarginal gyrus (MNI coordinates: 64 -44 42, 34 voxels). Thus, sanity check showed that the quality of the brain structural data (such as images normalization) and the quality of behavioral data allowed structural brain behavior correlation analyses.
III. Results
Correlation analyses controlling for the influence of demographic covariates (i.e., age, gender and education) on right PMd VOI-GM and neuropsychological test performance revealed only few significant correlations (Figure 2). For reader’s convenience, we flipped the direction of the correlations for timing-based and errors-based behavioral measures such that positive correlations indicate that higher GMV was associated with better performance. Conversely, all negative correlations reflect a rather counterintuitive relationship between VOI-GM and behavioral performance in which higher GMV is associated with lower performance.
III.1. Partial correlation analyses FZJ.
In the FZJ cohort, significant positive correlations were only found between rostral VOI-GM and performance at Benton Test (correct items, r = .23, p < .05), between caudal VOI-GM and performance at Hand-Arm Movement test (right, r = -.26, p < .05; left, r = -.23, p < .05, median, r = -.23, p < .05, please note that direction of correlation has been flipped such that the negative correlation reflects higher GMV to be associated with lower performance), and between the dorsal VOI-GM and performance at Benton Test (errors, r = .22, p < .05). In addition, we found that caudal VOI-GM showed significant positive and negative correlations with the Benton Test (correct items, r = - .22, p < .05; errors, r = .22, p < .05, please note that direction of correlation has been flipped such that the positive correlation reflects higher GMV to be associated with higher performance, i.e., fewer errors). Other negative significant correlation was found between ventral VOI-GM and Hand-Arm Movement test (left, r = .24, p < .05). In summary, our analysis hence revealed only a limited number of associations of which some conformed to our expectations (rostral PMd volume is associated with cognitive performance, caudal PMd volume with motor performance), but others were highly counter-intuitive.
NKI.
In the NKI cohort, the only significant positive correlation was found between rostral VOI-GM and performance at TMT-A, this result was highly significant (r = .32, p < .01). In contrast, negative correlations (indicating that higher GMV was associated with worse performance) were only found for the dorsal VOI-GM with the Card Sorting Test (r = - .23, p < .05), Word Context test (r = - .24, p < .05) and the Proverbs Test (Free Inquiry, r = - .28, p < .05).
[Figure 2 about here]
III.2. Full correlation analyses
Since correction for confounding variables can have unexpected detrimental effects on the correlations, we also examined correlation without correction for confounding effects of age, gender and education. The results of this full correlation approach are illustrated in Figure 3.
FZJ.
Significant positive correlations between ventral VOI-GM and Hand-Arm Movement median performance, as well as negative correlation between caudal VOI-GM and Hand-Arm Movement performance (left harm score: r = -.22, p < .05; median score: r = -.22, p < .05) were replicated with the full Pearson Correlation approach. In contrast, the other positive and negative correlations that were found to be significant with the Partial Correlation approach did not remain significant with the Full Correlation Approach.
In turn, several associations not found previously were observed in the full correlation approach. These related the rostral VOI-GM to performance at Block Tapping Test (Forwards, r = .26, p < .05), the central VOI-GM to performance at Block-Tapping test (forwards: r = .29, p < .01;
backwards: r = .22, p < .05) and median number of Finger-Tapping (r = .23, p < .05), as well as the ventral VOI-GM to forward Digit Span scores (Score: r = .26, p < .05, Span: r = .21, p < .05) and Block-Tapping performance (Forwards; r = .25, p < .05).
NKI.
The significant positive correlation between rostral VOI-GM and performance at TMT-A was replicated with the Full Correlation approach (TMT-A; r = .26, p < .01). In addition, the negative correlations between dorsal VOI-GM and Card Sorting (Sort Recognition: r = -.24, p < .05), as well as Word Context test (r = -.26, p < .05) remained significant with the Full Correlation approach. In contrast, the positive correlation between dorsal VOI-GM and performance at Benton Test did not remain significant with the Full Correlation Approach.
In turn, several significant positive correlations were revealed only by the Full Correlation approach. These comprised caudal VOI-GM with Conflict-dimension of the Attention Network Task (ANT; r = .18, p < .05) as well as ventral VOI-GM with Alert-Dimension of the ANT (r = .18, p < .05) and performance at TMT-A (r = .20, p < .05). Somewhat surprisingly, we also observed many additional negative correlations indicating better performance being associated with lower GMV (that were not evidenced with the Partial Correlation approach). These were found for rostral VOI-GM with performance at the Switching condition of the Design Fluency test (r = .18, p < .05), central VOIGM with performance at the Design Fluency test (Filled Dots: r = -.19, p < .05; Empty Dots: r = -.21, p < .05), ventral VOI-GM with performance at Design Fluency test (Empty Dots; r = -.25, p < .01; Switching: r = -.18, p < .05), dorsal VOI-GM with Free Sorting in Card Sorting Task (r = .27, p < .01), the Filled Dots condition of the Design Fluency test (r = -.18, p < .05) and Verbal Fluency (Category, r = -.19, Category Switching, r = -.23; p < .05).
To sum up, our results revealed relatively few significant associations between behavioral performance in individual volumes of the PMd parcels, in particular when considering that we focused the analysis on sensitivity by not correcting for multiple comparisons. In addition, only two findings that indicate a positive relationship between local GMV and behavioral performance were consistent across both approaches (partial correlations adjusting for demographic factors and full correlations). In the FZJ cohort, we found significant negative correlations between caudal and ventral parcel GMV and performance in a motor task (Hand-Arm Movement). In turn, in the NKI cohort, we found consistent positive correlations between rostral VOI-GM and visuo-motor speed (TMT-A). Unexpectedly, we also found a negative correlation between dorsal VOI-GM and inferential reasoning (Card Sorting and Word Context Test) in NKI cohort that was stable across both approaches.
In turn, there was little convergence between the findings from the two samples. Evidently, we would have expected, that we would be able to obtain conceptual replications between the tests in either sample that tap into the same mental functions (such as Stroop-like tasks). Even more interestingly, though, we found that for the same test (TMT-A) a correlation with GMV of the rostral PMd was found in the NKI but not FZJ sample. As illustrated in Figure 4, the variance in rostral VOI-GM values appeared similar in both cohorts, while the range of TMT-A completion times was more concentrated to faster reaction times in the FZJ cohort.
[Figure 4 about here]
II.3. Random Sampling
We first examined whether the direction of observed correlations was stable across many independently drawn small samples from our cohorts. When considering that the probability of
observing a positive/negative correlation by chance given no systematic effect in the underlying population is 50%, it appeared that the proportion of positive/negative correlations in the smaller subsamples was close to chance level for many behavioral measures and VOI-GM, and even more especially when n = 15. This pattern is illustrated for rostral VOI-GM in Figure 5. For this particular VOI, the highest rate of convergence across subsampling was prevalent for negative correlations with 80-85% in FZJ when n = 30 and 93-94% in NKI when n = 15. In FZJ, this highest rate was observed for negative correlation with performance in the Stroop test (naming and interference performance). In the NKI subsamples, this highest rate was reached for the negative correlations between rostral VOI-GM and performance in Card Sorting, as well as Word Context.
[Figure 5 about here]
Examination of the percentage of actually (nominally) significant correlation coefficients across subsamples revealed that it was generally low. As illustrated in Figure 6, for rostral VOI-GM, it closely resembled the rate of expected false positive results at p < .05 under Gaussian assumptions. In particular, the rates were mostly below 5% in very small samples (i.e. n = 15) and almost only bigger subsamples (i.e. n = 30) outperformed the rate of 5%. Importantly, the highest percentage of significant correlation for rostral VOI-GM was reached by performance in the Stroop test, which was also one of the most stable correlations in its direction (though a negative one). In contrast, the positive association between rostral VOI-GM and performance at TMT-A in the NKI data, which appeared as one of the most robust finding in the whole NKI cohort, and one of the most stable in its direction across subsamples barely reached 5% (4.9%) of significance in these small samples.
[Figure 6 about here]
Relating behavior to premotor functional parcels with structural brain behavior correlation: uninformative results
The present study aimed to corroborate functional characterization by task-activation data as compiled in the BrainMap database using structural brain-behavior correlations, providing an alternative approach to describe what a given brain region is doing. In particular, we examined the association between inter-individual variations in GMV computed for five right PMd parcels and a broad range of neuropsychological measures in healthy adults, in order to test the hypothesis that preferential activation in task-based studies is mirrored by relationships to individual behavioral performance. The analyses were performed in two independent samples using both partial correlations adjusting for effects of age, gender and education, as well as full correlations. For both samples, our results revealed only few significant associations between VOI-GM and test performance, whose correlation coefficients (i.e., effect sizes) were generally low and often not robust to adjusting for confound effects. Importantly, one of the strongest individual effects (correlation between TMT-A and rostral PMd GMV in the NKI sample) was not replicated in the FZJ cohort and was significant in less than 10% of subsampling, even when n = 60, and even reversed in direction in ~20% to 40% of all subsamples. Thus, our analysis did not allow corroborating or extending the findings from functional decoding based on fMRI activations. Importantly, sanity check of structural data, behavioral data, and their relationship had ensured that our data met standard quality for structural brain behavior correlation approaches. Therefore, we consider several issues below that may account for the low brain-behavioral inferential power of the used approach.
Structural brain behavior correlations in healthy adults: positive, and equally likely, negative correlations
One striking finding in our analyses was the relatively high rate of negative correlations (i.e., higher VOI-GM related to lower performance). Somewhat surprisingly, the high prevalence of such associations going against the common conception that higher GMV should be associated with better behavioral performance was found across both cohorts. Accordingly, examination of the proportions across small samples revealed that negative correlations were equally as likely as positive correlations. Nevertheless, negative correlations are rarely reported in published studies using structural brain-behavior correlations. One reason may be that most of the studies only examined the more intuitive positive relationships (i.e., higher GMV is associated with higher performance), following the hypothesis that “the bigger the better” (cf., (Yuan and Raz 2014)). In their recent structural brain behavior replication study, Boekel et al. (2015) focused on the direction of the structural brain behavior correlations reported in the original articles resulting in one-sided as opposed to two-sided hypothesis tests. Therefore, to the best of our knowledge, the present study is the first to examine potential negative correlations between VOI-GM and a range of behavioral measures. However, in a recent study, Smolker et al. (2015) reported negative correlations in whole-brain structural brain behavior correlation studies examining brain regions in which GMV correlated with performance in tests of executive functions in a cohort of 68 healthy subjects. The convergent finding of negative correlation between our VOI-GM structural brain behavior correlation study and an independent whole brain structural brain behavior correlation study suggests that negative correlation is not an artifact of our VOI-GM approach. Nevertheless, probably due to the lack of substantial evidence of negative correlation in the scientific literature, a convincing methodological explanation (or neurobiological theory) accounting for this phenomenon is still lacking. One potential explanation for negative correlation could be related to opposite effects of age on some behavioral performance and grey matter. That is, aging could be
related to both performance improvement (due to higher expertise in higher age, (Craik and Bialystok 2006)), and grey matter decrease (Raz 2000), resulting in a spurious negative relationship between higher performance and decreased GMV. Nevertheless, this hypothesis holds true only for negative correlation following the full correlation approach, not adjusted for confounding effects of age. Hence, negative correlations were also observed when controlling for confounding effects of age on the relationship between behavioral performance and GMV. One can not exclude the hypothesis that optimal neurobiological development across adult age would imply some kind of synaptic pruning or apoptosis resulting in higher cognitive performance but lower grey matter volume as estimated by the VBM approach. However, there is currently no well-supported neurobiological theory accounting for negative structural brain behavior correlations, thus these hypotheses remain speculative. Accumulating evidence of negative correlation would help either to identify a methodological explanation or build a well-supported neurobiological theory of the phenomenon. Therefore, future structural brain behavior correlation studies should systematically examine and report both, positive and negative, correlations.
Limitations of the VOI approach
While most of the structural brain behavior correlation studies examined the neural correlates of a particular behavioral aspect across the whole brain (Genon et al. 2014; Müller et al. 2015; Smolker et al. 2015; Genon et al. 2016b), in the present study, we examined the behavioral correlates of GMV in some specific VOIs. In other words, while many structural brain behavior correlation studies searched for a significant correlation between a priori defined behavioral measures and brain GMV with a voxel-wise approach, we searched for significant correlations between GMV in some a-priori defined VOIs and a wide range of behavioral measures. However, when compared to whole brain structural brain behavior analyses, the VOI-GM approach may underestimate
structural brain behavior correlations for two main reasons: the statistical approach and the VOI definition method.
In our VOI-GM approach, for each subject, each VOI-GM is a summary estimate of voxel intensity. Correlation analyses between these summary VOI-GM values and behavioral scores were then performed either when controlling for variance related to confounding variables age, gender and education or with full variance range. In contrast, most of the whole brain structural brain behavior studies have used the General Linear Model (GLM) as implemented voxel-wise in SPM (Friston et al. 1994). Searching for structural brain-behavior correlation with this approach is often performed by introducing several regressors (or predictors) in addition to the behavioral measure of interest (X) in the design matrix, such as age, gender, TBV, and a behavioral measure of general cognitive functioning (e.g. (Takeuchi et al. 2010, 2013; Genon et al. 2014)). Consequently, each voxel intensity (V) is modelled as a function of explanatory or confounding variables (e.g., V = ß1X + ß2age + ß3gender + ß4TBV + ß5 general cognitive functioning + ε). Therefore, within such a linear setting, the inclusion of extraneous determinants of the outcome (i.e., predictors of GMV) may potentially result in greater efficiency for the estimation of the association of interest due to better fit of the prediction model to the data. On the other hand, searching across all brain voxels or all voxels within one brain lobe (such as frontal lobe) for voxels fitting a prediction (be it complex or simple, such as V = ß1X + ε) could result in false positives. Nevertheless, many previous voxel-wise VBM studies were performed on a great number of voxels without correction for multiple comparisons as correction is frequently too conservative in standard setting (Smith and Nichols 2009). In sum, either the VOI approach might lack sensitivity due to summarizing all voxels pattern to one value, or the voxel-wise GLM approach might be too lenient thus overestimating the relationship between GMV variations and behavioral performance.
Another potential limitation of the VOI-GM approach is related to the issue of VOI definition as already suggested by Kanai (2016). This author schematically demonstrated how the spatial uncertainty in the VOI definition could influence the estimation of the correlation with a slight shift in the (true) peak (or center of gravity) resulting in smaller correlations. In our opinion, Kanai raised an important issue. In the framework of relating task-related brain activation to behavioral phenotype, the VOI definition issue has already been empirically addressed showing that VOI estimates should be defined at the subject-level by the most-activated voxels within each subject’s statistical map (e.g., (Tong et al. 2016)). In contrast, the VOI definition question still lacks empirical examination in the framework of structural brain behavior correlation analyses. In the present study, our VOIs were defined based on a meta-analytic approach of activation studies from a previous parcellation study (Genon et al. 2016a). Importantly, cerebral topographical organization (i.e., location of brain functional modules) can be complicated by interindividual variability (e.g., (Geyer et al. 1996)). Hence, a meta-analytically-defined VOI by essence reflects average at the group level. Thus, the definition of a given brain subregion based on a meta-analytic approach can be slightly shifted from the exact location of the target brain modules in some subjects. In such cases, the estimation of the correlation would be underestimated as suggested by Kanai. For these reasons, the VOIs definition in structural brain behavior correlation studies should be addressed in future studies. From the methodological perspective, future studies should address how different VOI definitions influence the correlation estimations. In a more conceptual view, future studies could address whether a structural brain behavior correlation approach can confirm a brain-behavior relationship evidenced by an fMRI activation study when VOIs are defined at the subject level by the subject-specific cluster of activation.
Significant structural brain behavior correlation and the need of variations
By definition, a correlation reflects a ratio between the covariance of the two variables and the product of their standard deviations (i.e., their respective range of variations). Significant and powerful structural brain behavior correlations can be observed when the variations in behavioral measures associated with neurobiological substrates (be it cortical thickness, grey matter volume or white matter) are higher than variations in behavioral measures that are driven by putative confounding factors such as mood, arousal state, personality or motivation. In other words, the between-subjects behavioral differences should be primarily driven by between-subjects cortical morphological differences. However, most of the neuropsychological measures have been originally developed to identify behavioral perturbations in clinical populations and, therefore, should not be primarily sensitive to variations in the healthy young and middle-age adult population. For example, the Delis Kaplan Executive Function System (D-KEFS; (Delis et al. 2001)) has been designed to assess brain damages in clinical settings. Thus, the neurobiological origins of between-subject variations in behavioral performance at standard neuropsychological tests in the healthy young and middle-age adult population could be questioned.
In the present study, we found evidence that correlation crucially depends on the variations in the selected sample. For example, we found a highly significant positive correlation between performance at TMT-A and VOI-GM in one cohort (NKI) but not in another cohort (FZJ). Examination of the scatter plot for the correlation between rostral VOI-GM and TMT-A suggested that slightly more scattered TMT-A performance in NKI cohort has allowed significant correlation in NKI, but not in FZJ. Thus, our results support the hypothesis that evidence of a correlation crucially depends on the variance in the selected sample. In line with this hypothesis, Yuan and Raz (2014) have previously shown that effect in structural brain behavior studies of executive functions are greater for behavioral measures and samples with greater variations of age, thus
suggesting that variations in behavioral measures that related to neurobiological substrates are more likely to be observed in an older population.
Therefore, we suggest that, in order to identify a significant relationship between a given behavioral measure (e.g., visuo-motor coordination performance) and a given brain structural aspect (e.g., grey matter volume), a study should one the one hand promote sensitive behavioral measures and on the other hand capitalize on populations showing variations in both brain structural data and behavioral measurements. Such conditions, underlying significant structural brain behavior correlations, are more likely to be met in populations that have encountered neurocognitive changes or deviations such as older and clinical populations.
Low effect sizes in noisy data possibly reflect spurious findings
The lack of relevant variations in the selected data discussed in the previous section raised a related issue: the noise in the data and its plausible relation to statistical significance’s fallacy. While our data have been extensively checked for major and global deviations from quality standard, they can contain a large noise component. First, collection of behavioral data in human cohorts is often performed by several experimenters, which can result in uncontrolled variations in test administration (such as variations in instructions, variations in attitude to participant and variations of administration rules). Despite such bias can be partly reduced with computerized assessment, one can assume that uncontrolled variations (due to the participant’s attitude, e.g. (Weber et al. 2002)) cannot be completely ruled out. Second, as discussed in the previous section, behavioral measurements in cohort datasets (and big data) have usually not been calibrated for the specific purpose of the subsequent brain-behavior studies, which can possibly result in a lack of sensitivity and/or validity. Furthermore, despite the computed GMV data conveys neurobiologically meaningful information, they are likely to contain significant levels of noise due
for example to field inhomogeneities, local deformations, or movement artifacts. We can therefore consider that correlation analyses are often performed between GMV and behavioral variables in data that contain a non-negligible noise component. In this context, we observed a low effect size (or r) and unreliable direction (correlation sign). Such a pattern is actually in line with the recent statistical work and discussion of Gelman and collaborators. These authors have shown that statistically significant results in a noisy setting (i.e. noisy measurements) are highly likely to be in the wrong direction (Type S error) and overestimate the actual effect sizes ((Type M error; (Gelman and Carlin 2014; Loken and Gelman 2017)). In light of this empirical consideration, our own findings of poor reliability might be considered as reflecting spurious results that can arise when VOI-based structural brain behavior correlations are performed in healthy adult cohorts with possibly noisy measurements. Thus, together and in line with the recent replication crisis (Boekel et al. 2015; Gelman and Geurts 2017), the present study emphasizes that low effect size in noisy brain-behavior correlation should be taken with caution rather than indicative of a robust feature of brain-behavior relationship.
Conclusions and perspectives
In the present study we demonstrated that the functional differentiation of the right PMd as evidenced by task-based activation profiles could not be corroborated by the analysis structural brain behavior correlations, questioning the hypothesized complementary convergence between approaches for functional characterization. The present study thus suggests that, within the right PMd, functional specialization as observed in fMRI studies does not reliably entail a significant covariance of individual structure with behavioral performance in healthy adults. Based on the current results and recent findings from others (Boekel et al. 2015; Boekel et al. 2016; Kanai 2016; Muhlert and Ridgway 2016), we outlined a few potential limitations and related recommendations for future studies. Namely, future studies should more systematically examine, report and discuss
negative correlations, address the influence of the VOI definition on null results, and consider low effect size in data with possibly a large noise components as likely reflecting spurious findings.
Acknowledgments
This study was supported by the Deutsche Forschungsgemeinschaft (DFG, EI 816/4-1, LA 3071/3-1, GE 2835/1-1), the National Institute of Mental Health (R01-MH074457), the Helmholtz Portfolio Theme “Supercomputing and Modelling for the Human Brain” and the European Union Seventh Framework Program (FP7/2007-2013) under grant agreement no. 604102.
Figure captions:
Figure 1. The five right PMd parcels and their behavioral functional characterization across the Brainmap database (Genon et al. 2016a).
Figure 2. Partial correlations between right PMd VOI-GM and behavioral performance in the FZJ and NKI cohorts; color coding: blue = negative, red = positive; significant correlation coefficients (p ≤ .05, uncorrected for multiple testing) are highlighted with a bold font and square frame; TMT: Trail-Making Test, CWI: Color Word Interference, ANT: Attention Network Test.
Figure 3. Pearson’s correlations between right PMd VOI-GM and behavioral performance in the FZJ and NKI cohorts; color coding: blue = negative, red = positive; significant correlation coefficients (p ≤ .05, uncorrected for multiple testing) are highlighted with a bold font and square frame. TMT: Trail-Making Test, CWI: Color Word Interference, ANT: Attention Network Test.
Figure 4. Scatter plot of rostral VOI-GM and raw TMT-A performance in FZJ and NKI cohorts.
Figure 5. Percentage ratio of positive (red) and negative (blue) correlation coefficients in the rostral VOI-GM parcel for the FZJ (A) and NKI (B) cohorts, irrespective of level of significance. TMT: Trail-Making Test, CWI: Color Word Interference, ANT: Attention Network Test.
Figure 6. Percentage of significant correlations across 1000 random subsampling of different sizes (n = 15, yellow; n = 30, orange; n = 60, red) with replacements in FZJ cohort (A) and in NKI cohort (B).
References
Boekel W, Forstmann BU, Wagenmakers E-J. 2016. Challenges in replicating brain-behavior correlations: Rejoinder to Kanai (2015) and Muhlert and Ridgway (2015). Cortex; a journal devoted to the study of the nervous system and behavior 74:348-352.
Boekel W, Wagenmakers E-J, Belay L, Verhagen J, Brown S, Forstmann BU. 2015. A purely confirmatory replication study of structural brain-behavior correlations. Cortex; a journal devoted to the study of the nervous system and behavior 66:115-133.
Button KS, Ioannidis JP, Mokrysz C, Nosek BA, Flint J, Robinson ES, Munafò MR. 2013. Power failure: why small sample size undermines the reliability of neuroscience. Nature Reviews Neuroscience 14:365-376.
Carter CS, Lesh TA, Barch DM. 2016. Thresholds, Power, and Sample Sizes in Clinical Neuroimaging. Biological Psychiatry: Cognitive Neuroscience and Neuroimaging 1:99-100. Craik FI, Bialystok E. 2006. Cognition through the lifespan: mechanisms of change. Trends in cognitive sciences 10:131-138.
Dale AM, Fischl B, Sereno MI. 1999. Cortical surface-based analysis: I. Segmentation and surface reconstruction. NeuroImage 9:179-194.
Delis DC, Kaplan E, Kramer JH. 2001. Delis-Kaplan executive function system (D-KEFS): Psychological Corporation.
Draganski B, Gaser C, Busch V, Schuierer G, Bogdahn U, May A. 2004. Neuroplasticity: changes in grey matter induced by training. Nature 427:311-312.
Draganski B, Lutti A, Kherif F. 2013. Impact of brain aging and neurodegeneration on cognition: evidence from MRI. Current opinion in neurology 26:640-645.
Eickhoff SB, Stephan KE, Mohlberg H, Grefkes C, Fink GR, Amunts K, Zilles K. 2005. A new SPM toolbox for combining probabilistic cytoarchitectonic maps and functional imaging data. NeuroImage 25:1325-1335.
Eklund A, Nichols TE, Knutsson H. 2016. Cluster failure: Why fMRI inferences for spatial extent have inflated false-positive rates. Proceedings of the National Academy of Sciences:201602413. Friston K. 2012. Ten ironic rules for non-statistical reviewers. NeuroImage 61:1300-1310. Friston K. 2013. Sample size and the fallacies of classical inference. NeuroImage 81:503-504. Friston KJ, Holmes AP, Worsley KJ, Poline JP, Frith CD, Frackowiak RS. 1994. Statistical parametric maps in functional imaging: a general linear approach. Human brain mapping 2:189-210.
Gee M, Dukart J, Draganski B, Wayne Martin WR, Emery D, Camicioli R. 2017. Regional volumetric change in Parkinson's disease with cognitive decline. Journal of the neurological sciences 373:88-94.
Gelman A, Carlin J. 2014. Beyond power calculations assessing type S (sign) and type M (magnitude) errors. Perspectives on Psychological Science 9:641-651.
Gelman A, Geurts HM. 2017. The statistical crisis in science: how is it relevant to clinical neuropsychology? The Clinical neuropsychologist:1-15.
Genon S, Bahri MA, Collette F, Angel L, d'Argembeau A, Clarys D, Kalenzaga S, Salmon E, Bastin C. 2014. Cognitive and neuroimaging evidence of impaired interaction between self and memory in Alzheimer's disease. Cortex; a journal devoted to the study of the nervous system and behavior 51:11-24.
Genon S, Li H, Fan L, Muller VI, Cieslik EC, Hoffstaedter F, Reid AT, Langner R, Grefkes C, Fox PT, Moebus S, Caspers S, Amunts K, Jiang T, Eickhoff SB. 2016a. The Right Dorsal Premotor Mosaic: Organization, Functions, and Connectivity. Cereb Cortex.
Genon S, Simon J, Bahri MA, Collette F, Souchay C, Jaspar M, Bastin C, Salmon E. 2016b. Relating pessimistic memory predictions to Alzheimer's disease brain structure. Cortex; a journal devoted to the study of the nervous system and behavior 85:151-164.
Genon S, Simon J, Bahri MA, Collette F, Souchay C, Jaspar M, Bastin C, Salmon E. in press. Relating pessimistic memory predictions to Alzheimer’s disease brain structure. Cortex; a journal devoted to the study of the nervous system and behavior.
Geyer S, Ledberg A, Schleicher A, Kinomura S, Schormann T, Burgel U, Klingberg T, Larsson J, Zilles K, Roland PE. 1996. Two different areas within the primary motor cortex of man. Nature 382:805-807.
Good CD, Johnsrude IS, Ashburner J, Henson RNA, Friston KJ, Frackowiak RSJ. 2001. A Voxel-Based Morphometric Study of Ageing in 465 Normal Adult Human Brains. NeuroImage 14:21-36. Hanakawa T. 2011. Rostral premotor cortex as a gateway between motor and cognitive networks. Neuroscience research 70:144-154.
Hautzinger M, Keller F, Kühner C. 2006. Beck depressions-inventar (BDI-II): Harcourt Test Services Frankfurt.
Hutton C, Draganski B, Ashburner J, Weiskopf N. 2009. A comparison between voxel-based cortical thickness and voxel-based morphometry in normal aging. NeuroImage 48:371-380. Ingre M. 2013. Why small low-powered studies are worse than large high-powered studies and how to protect against “trivial” findings in research: Comment on Friston (2012). NeuroImage 81:496-498.
Ioannidis JP. 2005. Why most published research findings are false. PLoS Med 2:e124. Kanai R. 2016. Open questions in conducting confirmatory replication studies: Commentary on Boekel et al., 2015. Cortex; a journal devoted to the study of the nervous system and behavior 74:343.
Kanai R, Carmel D, Bahrami B, Rees G. 2011. Structural and functional fractionation of right superior parietal cortex in bistable perception. Current biology 21:R106-R107.
Kanai R, Rees G. 2011. The structural basis of inter-individual differences in human behaviour and cognition. Nature Reviews Neuroscience 12:231-242.
Kong L, Herold CJ, Zöllner F, Salat DH, Lässer MM, Schmid LA, Fellhauer I, Thomann PA, Essig M, Schad LR. 2015. Comparison of grey matter volume and thickness for analysing cortical changes in chronic schizophrenia: a matter of surface area, grey/white matter intensity contrast, and curvature. Psychiatry Research: Neuroimaging 231:176-183.
Laird AR, Eickhoff SB, Fox PM, Uecker AM, Ray KL, Saenz JJ, Jr., McKay DR, Bzdok D, Laird RW, Robinson JL, Turner JA, Turkeltaub PE, Lancaster JL, Fox PT. 2011. The BrainMap strategy for standardization, sharing, and meta-analysis of neuroimaging data. BMC research notes 4:349. Loken E, Gelman A. 2017. Measurement error and the replication crisis. Science 355:584-585. Luders E, Cherbuin N, Gaser C. 2016. Estimating brain age using high-resolution pattern recognition: Younger brains in long-term meditation practitioners. NeuroImage 134:508-513. Malone IB, Leung KK, Clegg S, Barnes J, Whitwell JL, Ashburner J, Fox NC, Ridgway GR. 2015. Accurate automatic estimation of total intracranial volume: a nuisance variable with less nuisance. NeuroImage 104:366-372.
Manard M, Bahri MA, Salmon E, Collette F. 2016. Relationship between grey matter integrity and executive abilities in aging. Brain research 1642:562-580.
Muhlert N, Ridgway GR. 2016. Failed replications, contributing factors and careful
interpretations: Commentary on Boekel et al., 2015. Cortex; a journal devoted to the study of the nervous system and behavior 74:338.
Müller VI, Langner R, Cieslik EC, Rottschy C, Eickhoff SB. 2015. Interindividual differences in cognitive flexibility: influence of gray matter volume, functional connectivity and trait
impulsivity. Brain Structure and Function 220:2401-2414.
Nooner KB, Colcombe SJ, Tobe RH, Mennes M, Benedict MM, Moreno AL, Panek LJ, Brown S, Zavitz ST, Li Q, Sikka S, Gutman D, Bangaru S, Schlachter RT, Kamiel SM, Anwar AR, Hinz CM, Kaplan MS, Rachlin AB, Adelsberg S, Cheung B, Khanuja R, Yan C, Craddock CC, Calhoun V, Courtney W, King M, Wood D, Cox CL, Kelly AM, Di Martino A, Petkova E, Reiss PT, Duan N, Thomsen D, Biswal B, Coffey B, Hoptman MJ, Javitt DC, Pomara N, Sidtis JJ, Koplewicz HS, Castellanos FX, Leventhal BL, Milham MP. 2012. The NKI-Rockland Sample: A Model for Accelerating the Pace of Discovery Science in Psychiatry. Front Neurosci 6:152.
Nostro AD, Muller VI, Reid AT, Eickhoff SB. 2016. Correlations Between Personality and Brain Structure: A Crucial Role of Gender. Cereb Cortex.
Oldfield RC. 1971. The Assessment and Analysis of Handedness: The Edinburgh Inventory. Neuropsychologia 9:97-113.
Palaniyappan L, Liddle PF. 2012. Differential effects of surface area, gyrification and cortical thickness on voxel based morphometric deficits in schizophrenia. NeuroImage 60:693-699. Pashler H, Wagenmakers EJ. 2012. Editors’ introduction to the special section on replicability in psychological science a crisis of confidence? Perspectives on Psychological Science 7:528-530.
Picard N, Strick PL. 2001. Imaging the premotor areas. Current opinion in neurobiology 11:663-672.
Raz N. 2000. Aging of the brain and its impact on cognitive performance : Integration of structural and functional findings. In: Craik FIM, Salthouse TA, editors. The handbook of aging and
cognition Mahwah, NJ: Lawrence Erlbaum Associates p 1-90.
Rothstein HR, Sutton AJ, Borenstein M. 2006. Publication Bias in Meta-Analysis. In. Publication Bias in Meta-Analysis John Wiley & Sons, Ltd p 1-7.
Smith SM, Nichols TE. 2009. Threshold-free cluster enhancement: addressing problems of smoothing, threshold dependence and localisation in cluster inference. NeuroImage 44:83-98. Smolker H, Depue B, Reineberg A, Orr J, Banich M. 2015. Individual differences in regional prefrontal gray matter morphometry and fractional anisotropy are associated with different constructs of executive function. Brain Structure and Function 220:1291-1306.
Takeuchi H, Taki Y, Sassa Y, Hashizume H, Sekiguchi A, Fukushima A, Kawashima R. 2010. Regional gray matter volume of dopaminergic system associate with creativity: evidence from voxel-based morphometry. NeuroImage 51:578-585.
Takeuchi H, Taki Y, Sassa Y, Hashizume H, Sekiguchi A, Fukushima A, Kawashima R. 2013. Brain structures associated with executive functions during everyday events in a non-clinical sample. Brain Structure and Function 218:1017-1032.
Taki Y, Kinomura S, Sato K, Goto R, Wu K, Kawashima R, Fukuda H. 2011. Correlation between gray/white matter volume and cognition in healthy elderly people. Brain Cogn 75:170-176. Tong Y, Chen Q, Nichols TE, Rasetti R, Callicott JH, Berman KF, Weinberger DR, Mattay VS. 2016. Seeking Optimal Region-Of-Interest (ROI) Single-Value Summary Measures for fMRI Studies in Imaging Genetics. PloS one 11:e0151391.
van Gaal S, Scholte HS, Lamme VA, Fahrenfort JJ, Ridderinkhof KR. 2011. Pre-SMA gray-matter density predicts individual differences in action selection in the face of conscious and unconscious response conflict. Journal of cognitive neuroscience 23:382-390.
Wagenmakers E-J, Verhagen J, Ly A. 2015a. How to quantify the evidence for the absence of a correlation. Behavior research methods:1-14.
Wagenmakers E-J, Verhagen J, Ly A, Bakker M, Lee MD, Matzke D, Rouder JN, Morey RD. 2015b. A power fallacy. Behavior Research Methods 47:913-917.
Weber B, Fritze J, Schneider B, Kuhner T, Maurer K. 2002. Bias in computerized neuropsychological assessment of depressive disorders caused by computer attitude. Acta psychiatrica Scandinavica 105:126-130.
Wolk DA, Dickerson BC, Alzheimer's Disease Neuroimaging I. 2011. Fractionating verbal episodic memory in Alzheimer's disease. NeuroImage 54:1530-1539.
Yuan P, Raz N. 2014. Prefrontal cortex and executive functions in healthy adults: a meta-analysis of structural neuroimaging studies. Neuroscience & Biobehavioral Reviews 42:180-192.
Rostral_PMd Caudal_PMd Central_PMd Ventral_PMd Dorsal_PMd
FZJ
Finger Tapping (Right) 0.05 -0.08 0.05 0.08 0.01 Finger Tapping (Le^) 0.03 -0.01 0.02 0.12 0.06 Finger Tapping (Median) 0.05 -0.07 0.08 0.14 0.01 Hand-Arm Movements (Right) 0.05 -0.26 0.05 0.12 0.08 Hand-Arm Movements (Le^) 0.00 -0.23 -0.12 0.24 -0.05 Hand-Arm Movements (Median) 0.13 -0.23 0.04 0.24 0.03 TMT-A -0.20 -0.11 -0.05 -0.03 -0.03 TMT-B -0.09 -0.12 -0.05 -0.12 0.08 Digit-Symbol Test 0.01 -0.10 -0.06 0.12 0.06 Digit Span Score (Forwards) -0.07 -0.19 -0.16 0.00 -0.08 Digit Span Score (Backwards) -0.02 -0.07 0.05 -0.01 0.04 Digit Span (Forwards) -0.01 -0.18 -0.13 -0.07 -0.13 Digit Span (Backwards) 0.23 -0.22 0.13 0.13 0.01 Benton Test (Correct Items) 0.12 0.22 0.04 0.15 0.22 Benton Test (Errors) 0.21 0.03 0.09 0.13 0.02 Stroop Task (Reading) -0.17 0.01 -0.03 -0.02 -0.02 Stroop Task (Naming) -0.05 0.12 0.11 0.14 -0.11 Stroop Task (Color-Word Interference) 0.12 0.10 0.20 0.07 -0.02 Block Tapping (Forwards) 0.11 -0.09 0.17 0.10 -0.03NKI
ANT (Alert) 0.04 0.05 0.01 0.18 0.13 ANT (Orien2ng) -0.02 0.16 0.00 -0.09 -0.11 ANT (Conflict) -0.08 -0.04 -0.17 -0.14 0.07 TMT-A 0.32 -0.07 0.12 0.19 -0.05 TMT-B -0.06 -0.23 -0.20 -0.08 -0.17 Card Sor2ng (Free Sor2ng) 0.16 0.00 0.06 0.05 -0.22 Card Sor2ng (Sort Recogni2on) 0.12 -0.05 0.10 0.03 -0.23 Verbal Fluency (LeIer) 0.06 -0.08 -0.09 -0.08 -0.11 Verbal Fluency (Category) 0.04 0.07 -0.06 -0.03 -0.08 Verbal Fluency (Category Switching) 0.01 -0.02 -0.02 -0.03 -0.19 Design Fluency (Filled Dots) 0.10 -0.02 0.00 -0.01 -0.06 Design Fluency (Empty Dots) -0.03 -0.07 -0.13 -0.16 -0.09 Design Fluency (Switching) -0.07 -0.04 0.03 -0.15 -0.03 CWI (Color-Naming) 0.17 -0.15 -0.03 -0.04 -0.09 CWI (Word-Reading) 0.18 0.18 0.12 0.22 -0.10 CWI (Inhibi2on/Switching) 0.06 -0.09 -0.04 -0.08 0.02 20 Ques2ons -0.03 -0.05 -0.02 0.09 -0.11 Word Context -0.08 -0.17 -0.12 -0.07 -0.24 Tower of London 0.01 -0.20 -0.14 -0.12 -0.01 Proverbs (Free Inquiry) 0.04 -0.11 0.00 0.05 -0.28NKI
ANT (Alert) 0.03 0.00 0.05 0.18 0.01 ANT (Orien2ng) 0.02 0.13 0.01 -0.03 -0.05 ANT (Conflict) 0.03 0.18 0.00 -0.06 0.13 TMT-A 0.26 0.09 0.16 0.20 0.03 TMT-B 0.12 0.03 0.01 0.03 -0.08 Card Sor2ng (Free Sor2ng) 0.10 -0.12 -0.10 -0.13 -0.27 Card Sor2ng (Sort Recogni2on) 0.09 -0.09 -0.01 -0.09 -0.24 Verbal Fluency (LeIer) 0.01 -0.09 -0.11 -0.03 -0.15 Verbal Fluency (Category) 0.08 0.01 -0.12 0.04 -0.19 Verbal Fluency (Category Switching) 0.04 0.00 0.02 0.02 -0.23 Design Fluency (Filled Dots) -0.10 -0.15 -0.19 -0.16 -0.18 Design Fluency (Empty Dots) -0.15 -0.07 -0.22 -0.25 -0.11 Design Fluency (Switching) -0.18 -0.12 -0.14 -0.18 -0.15 CWI (Color-Naming) 0.03 -0.13 -0.08 -0.03 -0.13 CWI (Word-Reading) 0.05 0.01 0.00 0.12 -0.09 CWI (Inhibi2on/Switching) 0.02 0.01 0.07 0.02 -0.01 20 Ques2ons 0.05 0.18 0.12 0.00 -0.02 Word Context -0.09 -0.03 -0.03 -0.11 -0.26Rostral_PMd Caudal_PMd Central_PMd Ventral_PMd Dorsal_PMd
FZJ
Finger Tapping (Right) 0.10 -0.07 0.19 0.13 -0.15 Finger Tapping (Le^) 0.05 -0.06 0.21 0.19 -0.14 Finger Tapping (Median) 0.08 -0.08 0.23 0.18 -0.16 Hand-Arm Movements (Right) 0.01 -0.21 0.11 0.22 0.05 Hand-Arm Movements (Le^) -0.07 -0.22 0.00 0.20 -0.05 Hand-Arm Movements (Median) 0.03 -0.22 0.09 0.26 0.01 TMT-A 0.00 0.04 0.06 0.15 0.01 TMT-B 0.10 0.03 0.11 0.18 0.04 Digit-Symbol Test 0.15 0.20 0.10 0.17 0.02 Digit Span Score (Forwards) 0.06 -0.02 0.14 0.26 0.06 Digit Span Score (Backwards) 0.09 -0.08 -0.01 0.18 -0.09 Digit Span (Forwards) 0.06 -0.03 0.20 0.21 0.09 Digit Span (Backwards) 0.12 -0.09 0.01 0.19 -0.10 Benton Test (Correct Items) 0.06 -0.17 -0.01 -0.03 0.10 Benton Test (Errors) 0.05 -0.19 -0.03 -0.06 0.10 Stroop Task (Reading) 0.19 0.17 0.21 0.17 0.08 Stroop Task (Naming) -0.10 0.06 -0.01 0.05 -0.01 Stroop Task (Color-Word Interference) 0.02 0.15 0.14 0.21 -0.11 Block Tapping (Forwards) 0.26 0.20 0.29 0.25 -0.02 Block Tapping (Backwards) 0.20 -0.02 0.22 0.20 -0.06Neuropsychological
Test Unit of Measurement N Mean SD Minimum Maximum Test Description Reference
Finger-Tapping No. of taps within 10 s Continuous tapping movements with either the right or left
index finger
-Right Index Finger 83 56.23 7.98 36 72
Left Index Finger 82 48.72 7.41 30 66
Median (Left/Right) 83 52.64 7.30 33 72
Hand-Arm Movements (10x30)
Time to perform 10 consecutive movements (in s)
Movement of either hand between two points separated by a
distance of 30 cm Defer et al., 1999
Right Hand 83 7.28 1.74 4 12
Left Hand 83 7.44 1.76 4 13
Median (Left/Right) 82 7.31 1.65 4 12
Trail-Making Test Time to complete (in s) Connecting arrays of dots as accurately and fast as possible with respect to their sequence properties AITB, 1944
TMT-A 86 20.87 7.60 9 45 Ascending digits
TMT-B 86 39.58 19.76 16 95 Ascending (alternating) digits and
letters Digit Symbol No. of correct symbols 78 81.09 17.05 46 122 Assign symbols to digits, ranging from 1 to 9, given apredefined symbol key Wechsler, 1958
Digit Span Verbal reproduction of auditory presented sequences of digits,
which gradually increase in size from trial to trial Wechsler, 1958 Forwards No. of correctly
reproduced items 86 4.66 1.06 3 7
Backwards 86 4.44 1.19 2 7
Score Forwards Total test score 86 8.56 2.17 4 13
Score Backward 87 7.98 2.30 3 14
Benton Reproduction of previously presented geometrical figures after apre-defined learning period Siva, 1992
Correct Items No. of correct items 83 4.16 2.53 0 11
Errors No. of errors 83 6.95 1.67 3 10
CW-Stroop Time to complete (in s) Attentional processing of simultaneously presented, but
conflicting information Stroop, 1935; Bäumler, 1985
Word-Reading 85 29.20 4.17 21 44
Naming black-on-white printed words of highly distinguishable colors
Color-Naming 87 42.64 7.60 27.2 62.5 Naming rectangles printed in highly
distinguishable colors
Interference 85 67.09 13.82 36 96 Naming word color while ignoring
its written content Block-Tapping No. of correctly reproduceditems Reproduction of sequences of tapped blocks provided by theexperimenter, gradually increasing in value from trial to trial Corsi, 1972
Forwards 87 4.06 1.07 2 7
Backwards 87 3.46 1.21 1 6