large samples: Application to permanent
magnets and bulk superconductors
Cite as: Rev. Sci. Instrum. 90, 085101 (2019); https://doi.org/10.1063/1.5111399 Submitted: 25 May 2019 . Accepted: 14 July 2019 . Published Online: 02 August 2019 S. Brialmont , J. F. Fagnard , and P. Vanderbemden
A simple torque magnetometer for magnetic
moment measurement of large samples:
Application to permanent magnets and bulk
superconductors
Cite as: Rev. Sci. Instrum. 90, 085101 (2019);doi: 10.1063/1.5111399
Submitted: 25 May 2019 • Accepted: 14 July 2019 • Published Online: 2 August 2019
S. Brialmont, J. F. Fagnard, and P. Vanderbemden
AFFILIATIONS
SUPRATECS and Department of Electrical Engineering and Computer Science (B28), University of Liège, Sart-Tilman, B-4000, Belgium
ABSTRACT
The development of large size magnetic materials requires nondestructive measurement techniques to characterize their magnetic moment. In this work, we report the design and construction of a torque magnetometer able to accommodate sizable magnetic samples (>1 cm3) both at room temperature and cryogenic temperature. This device has an intermediate sensitivity between miniature torque magnetometers designed to work at cryogenic temperature and industrial torquemeters poorly adapted to extreme conditions. We show that torque sensing in the range 10−3–100 Nm can be achieved with piezoresistive metallic strain gages cemented on a cylindrical aluminum shaft with exter-nal temperature control. An absolute calibration of the device, carried out with a coil fed by a DC current, shows that magnetic moments down to 5 × 10⁻³A m2can be measured by this technique. The magnetometer is used to characterize a Nd–Fe–B permanent magnet and a permanently magnetized bulk, large grain superconductor at liquid nitrogen temperature (77 K). Results are in excellent agreement with data obtained with a flux extraction magnetometer for large samples. The device is able to measure magnetic moments in excess of 1.5 A m2, i.e., two orders of magnitude above the maximum magnetic moment of commercial magnetometers. The sample can be inserted in the air-gap of an electromagnet to measure the decrease in magnetic moment in the presence of a transverse applied field. The device was used to characterize the magnetic moment of “quasibulk” superconductors made of stacked coated conductor tapes (12 mm width) in such “crossed field” conditions.
Published under license by AIP Publishing.https://doi.org/10.1063/1.5111399., s
I. INTRODUCTION
High temperature superconductors manufactured as bulk pel-lets are able to trap a significant magnetic flux density and can act as powerful permanent magnets able to generate several teslas.1,2This property makes them very attractive for various engineering appli-cations where the best classic permanent magnets (Nd–Fe–B) are strongly limited by their saturation field. In particular, bulk super-conductors are used in applications involving rotating machines, portable magnets, and magnetic bearings.3The typical size of a bulk superconductor is a disk of 10–50 mm in diameter and 10–20 mm in height3,4 and can sometimes extend up to 100 mm in diame-ter.5 In this context, the design of measurement systems devoted to the nondestructive magnetic characterization of such large-size superconducting samples is quite challenging. Well-established
characterization methods consist in measuring the local magnetic flux distribution above the top surface of the sample using a minia-ture Hall probe6 or magneto-optic imaging.7 Such techniques can provide insights into their intrinsic physical characteristics like the critical current density but primarily in a small region located in the vicinity of the sample surface. In order to access properties that are representative of the whole volume of the sample, the determina-tion of the magnetic moment is the most appropriate measurement because it is linked unambiguously to the critical current density.8 Since magnetometers usually accommodate samples of small size (<1 cm3), however, the standard procedure to obtain useful infor-mation on the magnetic properties of macroscopic samples con-sists in cutting the bulk single domain superconductors into small specimens and to characterize their magnetic properties as a func-tion of temperature individually using AC susceptometry or DC
magnetometry. This procedure is time-consuming and destruc-tive which is particularly inconvenient. Examples of well known magnetometry techniques include Vibrating Sample Magnetome-try (VSM),9–11 Alternating Gradient Magnetometry (AGM),12 or Superconducting QUantum Interference Device (SQUID).13Several efforts were made to develop AC susceptometers14,15or DC magne-tometers16suited to large-size magnetic materials. These include a recent magnetometer based on a flux extraction device to measure the magnetic moment of large samples (a few cm3) in a nondestruc-tive way.17In order to ensure that the electromagnetic force across the sensing coils is sensitive to the magnetic moment, however, these sensing coils should be dimensioned carefully and, in general, should be much larger than (at least twice) the sample size,17,18which becomes problematic for large geometric dimensions.
In this paper, we design a torque magnetometer system work-ing both at room temperature and low temperature (typically at the liquid nitrogen temperature, i.e., 77 K) to measure the magnetic moment of large magnetic samples. Torque magnetometry has been widely used to characterize magnetic properties of various materi-als and has the key advantage that it does not require sensing coils. The working principle of torque magnetometers is rather straight-forward: when an external magnetic field is applied along a non-parallel direction with respect to the magnetization direction, the sample will experience a torque. This torque (called the magnetic torque) is given by τ = m × μ0H, where m is the magnetic moment
and H is the applied external magnetic field. A nonzero torque can be measured only for hysteretic or anisotropic samples.19 Typ-ical examples include magnetic thin films, permanent magnets, or superconducting materials previously magnetized under their criti-cal temperature. It is worth mentioning that for a superconductor, the magnetization can either be already present within the material or it can be generated by the external magnetic field itself.20 Sev-eral types of sensitive torque magnetometers were developed over the last decades to measure magnetic moments of metallic multilay-ers, high-temperature superconductors (in bulk or thin film form), and several classes of magnetic materials.21The first torque magne-tometers that have been proposed are capacitive torque magnetome-ters22–26in which the magnetic torque produces the displacement of a moving part which is detected through a capacitance measure-ment. Capacitive torque magnetometers were successfully designed to measure the de Haas-van Alphen effect,22anisotropic magnetic properties,23,24or the magnetic torque of very small superconduct-ing samples (<10 μg) with a noise level of approximately 10−12Nm.25 Several torque magnetometers using piezoresistive cantilevers were also designed to measure the magnetic moment of ultra low weight samples (≤1 μg)27–31achieving a sensitivity as small as 10−14A m2. This method can be applied at very high field (up to 36 T)32–35 and can be used to characterize the anisotropy of superconducting crystals.36Other torque magnetometers based on different torque sensing systems have been proposed including a commercial vis-cosimeter,37an integrated force transducer,38or optoelectronic sen-sors.39–41Optical detection systems present the advantage of excel-lent immunity against any unwanted electromagnetic interference signals. Let us mention that the early concept of torque magnetom-etry based on a torsion wire37,40,42–44 is still a relevant technique. Usually this technique is based on capacitive or optical readout of the twist angle on a thin wire. An actuation system is then designed to deliver an opposite torque in order to fully compensate the twist
angle. Finally, very recently, Takahashiet al.45demonstrated a new method for torque magnetometry based on a commercially avail-able membrane-type surface stress sensor, while Blankenhornet al.46 constructed a torque magnetometer using an ultrathin silicon nitride (SiN) membrane.
Together with commercial torque magnetometers,47 the devices mentioned above are designed to accommodate samples of typically a few mm3, giving rise to magnetic moments typically <10−7 A m2 and magnetic torques <10−5 Nm. In theory, torque
magnetometers based on a torsion wire could possibly accommo-date sizable samples.42However, in practice, such devices have only been proposed for measurements of very small samples or magnetic thin films37,40,43,44and the measurement of torques exceeding 10−5 Nm has not been demonstrated yet. In this work, we show that com-mercial metallic strain gages can be used to design a robust and easy-to-use torque magnetometer system aiming at measuring torques up to ∼1 Nm and magnetic moment (0.005 <m < 1.5 A m2) of several sizable magnetic samples, both at room temperature and cryogenic temperature. The targeted materials include permanent magnets or superconducting samples. In a magnetic torque measurement, the magnetic moment is often determined under the so-called “crossed” magnetic fields regime, i.e., the sample is subjected to magnetic fields that have been applied along two orthogonal directions.48The mag-netic torque generated by a superconducting sample under crossed fields can give important information on the applicability of such materials in rotating machines application, e.g., when a magnetized superconductor is placed in the rotor of a synchronous motor and subjected to the rotating field produced by the three-phase stator. In addition to providing a nondestructive characterization technique that nicely complements transport methods,49–51determining the volume magnetic properties using a torque magnetometer is there-fore helpful in assessing the applicability of large size magnets for various engineering applications.
II. DESCRIPTION OF THE EXPERIMENTAL SETUP The torque sensing system consists of metallic strain gages (1-VY43-3/350 type from HBM) cemented on a mechanical transmis-sion system that will be strained. The strain gages are mounted in a full Wheatstone bridge configuration in order to achieve high sensi-tivity, good intrinsic linearity, as well as optimal temperature com-pensation. To measure a torque with the best accuracy, the mechan-ical transmission system should be designed with great care so that the torque is transmitted at best from the sample to the gage system. Unlike what is usually done in the miniature torquemeters men-tioned in the Introduction, the chosen geometry is not a cantilever based system but a torque transmission system based on a cylindrical shaft on which the gages are placed. A schematic illustration of the mechanical part is shown in the top part ofFig. 1. The cross-shaped top part of the shaft is designed to be clamped in an external frame (not shown inFig. 1), allowing the sample to be possibly placed in four orthogonal positions. The bottom part consists of the sample holder subjected to the magnetic torque to be measured. The sample holder is placed in the homogeneous field zone of a water-cooled electromagnet with poles of 180 mm diameter and an air-gap of 46 mm between the poles. In the present design, the sample holder can accommodate samples up to 17 mm × 18 mm × 8 mm, a size
FIG. 1. Schematic representation of the torque transmission system and a picture
of the full bridge mounted piezoresistive strain gages (upper part) as well as the electrical connections of the measurement system (bottom part). (a) Cylindrical shaft, (b) strain gages mounted in a full bridge, (c) electrical heater and Pt100 temperature sensor, (d) sample holder, and (e) magnetic sample.
which is currently limited by the available air gap and the wall thick-ness of the cryostat when low temperature measurements are carried out. By using a magnet with a larger bore or air gap, the extension to larger samples is straightforward, if needed.
Because the measurement of the torque is provided by the tor-sional strain of the shaft, an important point when designing the structure is to achieve the largest possible strain at the surface of the cylinder in order to obtain a measurable electric signal. For a given torsional moment, the deformation of the cylinder is inversely pro-portional to the shaft diameter. As a result, the diameter of the cylin-drical shaft should be chosen as small as possible while ensuring that the gages can be attached without any difficulty. Typically, a reason-able diameter is 10 mm and is used in this work. The structure must be made of a nonferromagnetic material with a sufficiently low stiff-ness. Moreover, a good temperature matching with the strain gages is required. For cryogenic full gage bridges, the commercially avail-able configurations are temperature compensated for steel or alu-minum. In the present system, aluminum (6082 AlMgSi1) is found to be well suited due to its relatively low stiffness compared to com-mon steel, as well as the weak magnetic properties. Aluminum is paramagnetic with a room temperature magnetic susceptibility χ ≈ 2 × 10⁻⁵(-)52which is expected to have little effect on the magnetic
properties of the ferromagnetic or superconducting materials to be investigated. The gage bridge used in this work is made of a constan-tan foil with an approximately 5 μm-thickness. The carrier material is polyimide with a thickness of 45 ± 10 μm, and the covering agent is also polyimide with a thickness of 25 ± 12 μm. The gages are already mounted on a full bridge configuration, and their nominal resistance at room temperature is 350 Ω. Gages are attached to the test material using a cold curing two components methyl metacrylate superglue, which is preferred to the usually recommended cyanoacrylate type glue due to its better mechanical behavior at low temperatures. For a full bridge placed on a cylindrical shaft at 45○
from the longitudinal axis for torsion measurement, the torsional moment τ is related to the deformation of the gages through the following relation:53
τ = 2εGSp, (1)
where ε is the relative strain, G is the shear modulus, and Spis the
polar surface modulus which depends on the cross sectional shape. For a cylindrical shaft of diameterd, one has Sp= πd3/16. The strain
gage bridge used has an operating temperature range above −70○C.
For measurement of the magnetic torque of samples at cryogenic temperature, the sample holder is immersed in a small container filled with liquid nitrogen. A HK5295 electrical thermofoil heater from MINCO and a Pt100 surface temperature sensor are both anchored thermally to the aluminum shaft and placed 13 mm below strain gage bridge (Fig. 1) so that it is maintained at a temperature of 241.6 ± 0.4 K. The temperature control of the bridge is achieved through the proportional integral derivative (PID) feedback loop of a Model 325 LakeShore Cryotronics temperature controller. The system could possibly accommodate magnetic torque measurements at lower temperature (liquid helium temperature, for instance). In this case, however, the cooling system should be modified. For instance, Patelet al.54used a sealed insert filled with helium gas. Then, the insert could be cooled directly with liquid helium. Strain gage bridges adapted to extreme temperature conditions should be used instead of the current gage bridge. Specific epoxy resin adhe-sives working down to −270○C are also commercially available and
could be used.
In order to increase the signal-to-noise ratio, the gage Wheat-stone bridge circuit is excited by an AC voltage at a fixed frequency of 63 Hz. The bridge unbalance voltage is measured using a DSP lock-in amplifier (LIA) Model 7260 from EG&G Instruments. The bridge output signal is therefore almost unaffected by slowly varying ther-moelectric voltages occurring in the measurement circuit. The latter is reduced by thermally anchoring all junctions to the aluminum shaft and minimizing thermal gradients. The reference signal of the LIA is taken as the source signal of the Wheatstone bridge. The LIA is set in theX − Y mode, where X and Y are the in-phase and the out-of-phase components of the output signal with respect to the reference. Since the voltage to be measured is related to the resis-tances of the circuit, the relevant signal is the in-phase signal (X) and all out-of-phase contributions (Y) should be ideally 0. In order to avoid ground loops, a 1:1 general radio audio transformer is used as a galvanic isolation between the AC output voltage of the bridge and the lock-in amplifier. The electrical connections are illustrated in the bottom part ofFig. 1.
Once the full strain gage bridge is attached on the shaft and fed with an AC voltage (6.08 V RMS) without any applied torque, there is an unavoidable offset voltage of the order of ∼1 mV. This offset
voltage results either from an initial mismatch between the piezore-sistances of the bridge or from a small mechanical stress caused by the cementing process. In the present case, further balancing of the bridge is achieved by connecting a precision resistor general radio decade box, at room temperature, in parallel with one of the bridge legs. This procedure allows the zero-torque offset voltage to be decreased below 1 μV and is performed prior to any measurement sequence.
III. CALIBRATION
In this section, we first investigate the typical sensitivity that can be reached by the electrical measurement system and then carry out an absolute calibration both at room temperature and low tempera-ture. In order to determine experimentally the sensitivity of the elec-trical measurement system, we first balance the strain gage bridge using the procedure described above. Then, we simulate a mechan-ical solicitation of the gages by connecting a variable general radio precision resistor (R∗
) in parallel with one of the piezoresistive legs. In so doing, the resulting output voltageV of the bridge fed with a voltageVacis given by V Vac ≈ 1 4 ΔReq Req , (2)
where Req is the equivalent resistance resulting from the parallel
connection of the external resistorR∗ and one of the
piezoresis-tive gages. ChangingR∗by small incremental amounts allowsR eq
to be varied in a well-defined manner.Figure 2shows the variation of the output voltage measured by the lock-in amplifier when one of the resistances of the bridgeReqvaries, for three consecutive
mea-surement runs. The theoretical result given by Eq.(2)is plotted for comparison (blue line). As can be seen inFig. 2(b), the electrical cir-cuit is sensitive to a relative change of one resistance of the bridge down to 10−7, which corresponds to detecting a (V/Vac) ratio of the
order of ∼2 × 10⁻⁸.
Absolute calibration of the torque measurement system can be performed using a small coil with well-defined characteristics and
fed by a known current. In practice, we use a two-layered coil so that the magnetic moment can easily be computed and compared with experimental results. The reference magnetic moment of the coil is directly given by
mref= πI[R2intn1+ (Rint+d)2n2], (3)
whereI is the DC current injected in the coil, Rint= 6 mm is the
radius of coil holder,d = 0.3 mm is the diameter of the copper wire, andn1= 18 andn2= 17 are, respectively, the number of turns of the
first and the second layers. The coil is tested both at 300 K and at 77 K under an external magnetic field of 657 mT and inserted in the sample space. The orientation of the coil is such that the coil axis, and hence the direction of the magnetic moment, is perpendicular to the external magnetic field within 0.5○uncertainty. The resulting torque
is given by τ = mrefB, where mrefis the magnitude of the reference
magnetic moment. The output voltage of the bridge is related to the magnetic moment through the following relation:
V Vac = 8k π B Gd3m (4)
and should therefore be a linear function of the injected current. Whereas Eq.(3)gives the reference magnetic moment directly cal-culated from the dimensions of the coil, Eq.(4)provides the value of the measured magnetic moment. Calibration is carried out by inject-ing increasinject-ing pulses of current of increasinject-ing amplitude, up to 2.5 A at 300 K and up to 8 A at 77 K, using a HP 6030A current source. Each pulse has a duration of 40 s, with a 20 s time interval between two pulses. The maximum current amplitude is chosen to minimize the risk of damaging the coil due to self-heating effect. A pulse dura-tion of 40 s is used for two reasons. The first is that one has to let the bridge output voltage stabilize for 20 s considering the time constant of the lock-in amplifierTC = 2 s. The second reason is the offset sig-nal that may change slightly over time. The offset sigsig-nal, therefore, is recorded between two measurements and systematically subtracted from the bridge output voltage. The process of current injection and
FIG. 2. (a) Unbalance voltage (X) as
a function of the relative change of equivalent resistance. (b) Zoom for small change of equivalent resistance. Three consecutive runs are shown with black, blue, and red circles. The solid line is the theoretical value given by Eq.(2).
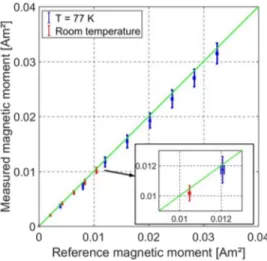
measurement recording is carried out automatically using the Lab-VIEW software from National Instruments. A comparison between the reference magnetic moment calculated by Eq.(3)and the mea-sured magnetic moment deduced directly from Eq.(4)is plotted in
Fig. 3. The vertical error bars represent the uncertainty on the mea-sured magnetic moment where the main uncertainty sources come from the measured output voltage, the knowledge of the shear mod-ulusG, and the applied transverse field. The horizontal error bars represent the uncertainty on the reference magnetic moment which results primarily from the uncertainty on the geometrical dimen-sions of the coil. Experimental data at room temperature are only showed up to 0.01 A m2inFig. 3corresponding the injected cur-rent of 2.5 A mentioned previously. Let us mention that, in principle, the torque measurements could be slightly affected by the liquid vis-cosity and bubbling of liquid nitrogen. Nevertheless, this effect is extremely small compared to the other uncertainty sources and will be neglected in this work. A remarkably close agreement is found between the magnetic moment determined through Eq.(4)and the reference magnetic moment although Eq.(4)relies on the average shear modulusG determined from literature data. The data plotted inFig. 3show that the bridge output voltage is weakly influenced by the temperature at which calibration measurement points are taken. Possible errors that can arise from temperature variations are estimated as follows: A given temperature change affects the nom-inal resistances of the piezoresistors, the gage factork, and the dif-ferential thermal expansion with respect to the test material, these effects being combined in the so-called “thermal output” of the gage bridge. For the aluminum matched gage bridge used in this work, the thermal output is zero at 293 K and of the order of 35 μm/m at 241 K (the stabilized temperature of the bridge when the sample holder is immersed in liquid nitrogen). Furthermore, the tempera-ture itself has an impact on the output voltage for a given torque via the temperature dependence of the shear modulusG. This tempera-ture dependence is typically <0.2%/○C for most annealed Al alloys.55
FIG. 3. Measured magnetic moment using the torque measurement system vs
reference magnetic moment for each current step. The applied transverse field is 657 mT. The green line is the ideal relation. The uncertainty on the reference magnetic moment is represented by the horizontal error bars. The uncertainty on the measured magnetic moment is represented by the vertical error bars.
From the calibration results shown inFig. 3, it can be concluded that the measurement system is suitable to measure reliably mag-netic moments down to 5 × 10⁻³A m2, both at room temperature and at liquid nitrogen temperature. This corresponds to magnetic torques and relative strain in the range of τ ∼ 10−3Nm and ε ∼ 10−7, respectively. A linear fit of the calibration data shown inFig. 3can be used for determining the calibration constantK of the torquemeter described in this work, without relying on the estimation of the shear modulusG literature data. This process yields to (V/Vac) =Kτ, with
K = (1.96 ± 0.04) × 10−4(Nm)−1. This calibration value is then used for the measurements described in Sec.IV. From this estimation, one can deduce the value of the shear modulusG of the aluminum rod. From Eq.(4)and the knowledge of the calibration constant, we obtainG = 26.37 ± 0.79 MPa.
IV. RESULTS AND DISCUSSION
The torque magnetometer is used to determine the magnetic moment of three different materials: (i) a permanent magnet, (ii) a bulk superconductor, and (iii) a composite “quasibulk” supercon-ductor made of stacked superconducting tapes.
First, the experimental system is tested on a cylindrical Nd–Fe– B permanent magnet of 15 mm in diameter and 8 mm in height. The experimental tests are carried out at room temperature and in liquid nitrogen. The sample is oriented such that its magnetization axis is perpendicular to the applied magnetic field. The experimental data can therefore be used (i) to estimate the sample initial magne-tization by extrapolating the magnetic moment to zero field and (ii) to investigate how the magnetic moment is affected by the applica-tion of a transverse magnetic field, i.e., in “crossed-field” condiapplica-tions. The sample is submitted to increasing pulses of magnetic fields of approximately 40 s with 20 s between each pulses, as described in Sec.III.Figure 4shows the dipolar magnetic moment of the Nd– Fe–B magnet as a function of the applied magnetic field. A first observation is the fact that the magnetic moment is systematically higher at T = 77 K than at room temperature. These data can be compared to the magnetic moment of the same magnet, measured at zero applied field using a flux extraction magnetometer developed for large samples up to 17 mm in diameter:17m = (1.40 ± 0.01) A m2 at 300 K andm = (1.47 ± 0.01) A m2at 77 K. The magnetic moments
FIG. 4. Dipolar magnetic moment of the permanent magnet as a function of
the applied transverse magnetic induction. The results at room temperature are compared with those at 77 K.
obtained with the flux extraction magnetometer are therefore fully consistent with the results displayed inFig. 4and confirm the ∼5% increase in the magnetic moment between 300 K and 77 K. This slight increase is in agreement with recent observations and ele-ments of explanation about the evolution of the remnant field at low temperature in Nd2Fe14B permanent magnets that were studied by
Dies-Jimenezet al.56Starting from 300 K, the remnant magnetiza-tion first increases with decreasing temperature. Under a given tem-perature, the material experiences spin-reorientation transition and the magnetization then decreases with decreasing temperature. The spin-orientation transition is related to the fact that the easy magne-tization direction, i.e., the direction which is the most energetically favorable for the magnetic moment, strongly depends on the tem-perature and thus, the magnetic moment can deviate from its initial orientation (up to 30○
at 4 K). Nevertheless, the magnetic moment is always found to be higher at 77 K than it is at 300 K, in agree-ment with the results plotted inFig. 4. Another direct observation from the measurement results obtained with the torque magnetome-ter is the overall decrease in the magnetic moment as the transverse field increases. Again, several phenomena may be responsible for the behavior of a permanent magnet under an applied transverse mag-netic field. Demagnetization can happen due to a misalignment of microscopic domains when the material is submitted to a magnetic field. Because of its high coercive field, however, it is not possible to demagnetize permanently the magnet at the magnetic induction lev-els involved in this work. Experimental data of permanent magnets in crossed fields are rather scarce. As an example, Katter57showed that in a direction perpendicular to the magnetic moment of the sample, a demagnetizing field higher than 2 T should be applied to observe irreversible demagnetization. The conclusions to be drawn from the data plotted inFig. 4are that (i) the torque measurement system is able to measure reliably the magnetic torque exceeding 1 A m2, which is much higher than magnetization of the coil used in the calibration phase, (ii) the magnetization data are in agree-ment with those obtained using a flux extraction technique, and (iii) the demagnetization effects can be studied directly. At the same time, the necessity of applying a transverse magnetic field to mea-sure the magnetic moment of the permanent magnet is the main limitation of the technique because of the slight demagnetization observed.
In a second experiment, the crossed-field torque measurements are carried out on a bulk, large grain GdBa2Cu3O7(Gd–Ba–Cu–
O) superconductor from Nippon Steel Corporation. The sample is a small cylinder of 9 mm in diameter and 5.16 mm in thickness. The torque magnetometer is used to evaluate the magnetic moment of the superconducting sample previously magnetized in a field cooled (FC) process. The sample is first placed with its easy magnetization direction (c-axis) parallel to the field direction (0.67 T) and cooled down to 77 K (T/Tc≈ 0.85)58so that a permanent magnetic moment
is trapped. The holder is then rotated by 90○such that the magnetic
moment is perpendicular to the applied field and can be measured by the magnetometer.
First, the magnetic moment is measured under increasing transverse magnetic field pulses. The magnetic moment as a function of the applied transverse magnetic induction is shown inFig. 5(a). One can see a significant decrease in the magnetic moment when the applied transverse field increases. From the data plotted inFig. 5(a), one can estimate the magnetic moment at zero applied transverse
FIG. 5. Magnetic moment of the superconducting sample previously magnetized
under 670 mT (FC) as a function of (a) the applied transverse magnetic field and (b) the number of field sweeps of 300 mT (6 mT/s) and 100 mT (2 mT/s). The field sweeps are illustrated in (c). The measurements are obtained 1020 s after the magnetization process.
field by linear extrapolation from the three points measured at the lowest applied field. This procedure gives a magnetic moment at zero applied field equal to 0.092 A m2. This value is in very close agree-ment with the magnetic moagree-ment of the same sample determined using the flux extraction magnetometer developed by Eganet al.,17 i.e.,m = (0.089 ± 0.01) A m2. Knowing the magnetic moment of the whole sample, the Bean model can be used to estimate the crit-ical current densityJcif the sample is fully magnetized.8,59,60As a
reminder, this model ignores the flux creep and assumes a homo-geneous, field-independent current density. Under these assump-tions, the magnetic momentm of a cylindrical superconductor is given by60
m =2π 3 Jca
3
b, (5)
where 2a and 2b denote the diameter and the height of the cylinder, respectively.
This procedure gives an average critical current density ofJc
≈ 2 × 10⁴A/cm2which is representative of the volume of the
sam-ple. Because the model does not take the flux creep into account and because the flux creep (in the absence of applied field) can-not be measured with a torque magnetometry technique, the ini-tial magnetic moment, i.e., the moment just after the magnetiza-tion process, cannot be recovered in the scope of this work. As a result, the critical current density is likely to be underestimated. When submitted to crossed magnetic fields (i.e., magnetic fields in theab plane after it has been magnetized in the c direction), the superconducting Gd–Ba–Cu–O sample is found to exhibit demag-netization effects. This is physically due to the creation of induced current density by the transverse field which cancels the existing cur-rent density flowing in theab plane (induced by the magnetizing field). This results in a decrease in the current density previously induced by the magnetization process and thus a decrease in the magnetization.60
The torque magnetometer developed in this work is also suited to test the crossed-field effects when the sample is submitted to tri-angular cycles of transverse magnetic field of larger amplitude (100 mT and 300 mT) in both bipolar and unipolar configurations. In this kind of experiment, the sample is subjected to linear increasing and decreasing variations of the applied transverse field. The mea-surements are then taken at each positive peak value of the applied field.Figure 5(b)displays the magnetic moment as a function of the number of field sweeps for the two amplitudes considered. The extrapolated value for zero applied field is also shown in this graph.
Figure 5(c)illustrates the applied transverse field as a function of time. As expected, the demagnetization effect is more pronounced for an amplitude of 300 mT than for an amplitude of 100 mT. Fur-thermore,Fig. 5(b)shows that the demagnetization is amplified by bipolar cycles. These results outline one of the key advantages of the torque magnetometer over magnetometers involving sensing coils: during the measurement, the sample can be inserted in the rela-tively narrow air-gap of the electromagnet, with the possibility of generating a transverse field of much higher amplitude than that (∼25 mT) attainable in the flux extraction magnetometer with sens-ing coils.60
In a third set of experiments, the magnetic torque measurement system is tested on stacked second generation (2G) YBa2Cu3O7
(YBCO) superconducting tapes from SuperPower
®
. The sample consists of a stack of 42 superconducting tapes (12 mm × 12 mm) maintained together in an aluminum holder, as shown in the inset ofFig. 6(a). The tapes include a 50 μm Hastelloy®
substrate and a 1 μm (RE)BCO superconducting layer deposited by metal-organic chemical vapor deposition (MOCVD). Such stack of tapes forms therefore a “quasibulk” superconductor with the ability of trapping, at low temperature, high flux densities that are comparable to those of plain, bulk materials.61,62As shown by recent work demonstrating the suitability of using stacked tapes in high power density electric motors, e.g., in the next generation of electric aircrafts, understand-ing their behavior under crossed fields is needed to assess their long time stability and the reliability of the device.63FIG. 6. Magnetic moment of the stacked tapes after a magnetization under 670 mT
(FC) as a function of (a) the applied transverse magnetic field and (b) the number of field sweeps up to 300 mT (6 mT/s). The measurements are obtained 1080 s after the magnetization process. Pictures and schematic illustration of the stack are shown in the inset of (a).
The stack of tapes is first magnetized permanently under 670 mT in a field cooling procedure, and the magnetic moment is measured when this stack is submitted to increasing transverse fields (parallel to theirab plane) up to 300 mT. The measured magnetic moment as a function of the applied transverse field is shown in
Fig. 6(a). A linear extrapolation based on the measurements at the three lowest applied fields (the dashed line) is used to find the value of the magnetic moment at zero applied field, i.e.,m ≈ 0.022 A m2. Following a similar procedure than for the bulk Gd–B–C–O sample, it is possible to estimate the engineering critical current density, i.e., considering the whole stack of tapes including the substrates as one bulk superconductor. In the limit of the Bean model, the engineering critical current density estimation givesJc≈ 212 A/cm2. This quite
low value compared to the critical current density of the Gd–B–C–O sample can be explained by the fact that the superconducting layer in each tape is very thin compared to the substrate. The torqueme-ter system is an efficient technique for engineering current density estimation as it gives a good estimation of the average current den-sity on the sample volume. Using trapped field measurements could also give an estimation of the engineering current density, but it would require some assumptions on the homogeneity of the sample. It would also depend on the distance between the sample and the
active surface area of the Hall probe used to perform such measure-ments. The results obtained for both the Gd–B–C–O bulk sample [cf.Fig. 5(a)] and the stacked tapes show that the demagnetization is significantly reduced for the latter. In order to visualize this reduc-tion in the demagnetizing factor, several unipolar and bipolar cycles of transverse fields are applied to the stack of tapes after a magne-tization under 670 mT. Figure 6(b)shows the magnetic moment normalized with respect to the value measured for the first peak of transverse magnetic field. Once again, results show a significant reduction in the demagnetization effect when working with stacked tapes. This result is in qualitative agreement with previous experi-mental data obtained by measuring the trapped flux density by one or several Hall probes attached to the surface of the sample.63,64 In this latter case, however, the signal is strongly dependent of the exact distance between the Hall sensor and the surface of the stacked tape. This issue disappears for the magnetic moment obtained with the torque magnetometer in the present work since no Hall sensor is used and the useful signal depends on the average properties of the whole, quasibulk sample. The characterization of stacked tapes structures by the torque magnetometer could be extended directly to much larger samples (e.g., tapes of width >40 mm, once they will become commercially available) with no substantial modification of the current design.
V. CONCLUSION
An experimental magnetic torque measurement system for the nondestructive measurement of the magnetic moment of sizable samples (up to 17 mm in diameter and 8 mm in thickness) has been designed, constructed, and calibrated. The system was shown to work at both room and cryogenic (77 K) temperatures. The torque measurement system was used to measure the magnetic torque of various permanently magnetized samples under “crossed field” con-figuration. The device consists of an aluminum cylindrical shaft 10 mm in diameter which transmits the torque acting on the sample from the sample holder to the strain gages attached on the cylin-der. In order to achieve a good sensitivity, linearity, and temperature compensation, the strain gages are mounted in a full Wheatstone bridge configuration and supplied with an AC voltage at 63 Hz. It is worth mentioning that the sensing system based on piezoresistive gages is much easier to implement compared to an optical or a capac-itive detection system, the latter requiring an appropriate electro-static shield. The system has been shown to be perfectly able to detect relative changes of resistance down to 10−7and to measure magnetic moment down to 5 × 10⁻³A m2, corresponding to magnetic torques in the range of ∼10−3Nm and relative strain of ∼10−7. The device was experimentally shown to be able to probe magnetic moments exceeding 1.5 A m2(1500 emu) and magnetic torques in the range of ∼1 Nm. Such magnetic moments are two orders of magnitude above the maximum magnetic moment of commercial magnetome-ters. The method is ultimately limited by the maximum strain of the metallic strain gages (∼10−2) corresponding to torques of ∼102Nm and magnetic moments of a few ∼102A m2. One characteristic of the system is the ability to record the magnetic moment of permanently magnetized samples when applying simultaneously a transverse field of several hundreds of militesla which is necessary to characterize their demagnetization effect. The magnetic moment of a Nd–Fe–B magnet and a bulk superconducting GdBa2Cu3O7(GdBCO) sample
were successfully measured. The results were shown to be in excel-lent agreement with experimental data obtained with a flux extrac-tion magnetometer. Another advantage of the technique described in this work is that there is no requirement on the size of the sample and no limitation on the sample volume, provided it can be inserted in the bore or air-gap of the magnet. Finally, this system allowed, for the first time, measurements of the decrease in the magnetic moment of stacked second generation (2G) YBCO superconducting tapes.
ACKNOWLEDGMENTS
The authors greatly acknowledge Nippon Steel for providing bulk large grain GdBa2Cu3O7(GdBCO) samples.
REFERENCES
1
M. Tomita and M. Murakami,Nature421, 517 (2003).
2
J. H. Durrell, A. R. Dennis, J. Jaroszynski, M. D. Ainslie, K. G. B. Palmer, Y. H. Shi, A. M. Campbell, J. Hull, M. Strasik, E. E. Hellstrom, and D. A. Cardwell, Supercond. Sci. Technol.27, 082001 (2014).
3
J. H. Durrell, M. D. Ainslie, and D. Zhou,Supercond. Sci. Technol.31, 103501 (2018).
4K. Berger, M. Koblischka, B. Douine, J. Noudem, P. Bernstein, T. Hauet, and
L. Lévêque,IEEE Trans. Appl. Supercond.26, 1 (2016).
5
S. Nariki, H. Teshima, and M. Morita,Supercond. Sci. Technol.29, 034002 (2016).
6A. Yamamoto, A. Ishihara, M. Tomita, and K. Kishio,Appl. Phys. Lett.
105, 032601 (2014).
7
G. Shaw, J. Brisbois, L. B. G. L. Pinheiro, J. Müller, S. B. Alvarez, T. Devillers, N. Dempsey, J. E. Scheerder, J. V. de Vondel, S. Melinte, P. Vanderbemden, M. Motta, W. A. Ortiz, K. Hasselbach, R. B. G. Kramer, and A. V. Silhanek,Appl. Phys. Lett.89, 023705 (2018).
8C. P. Bean,Rev. Mod. Phys.
36, 31 (1964).
9G. J. Bowden,J. Phys. E: Sci. Instrum.
5, 1115 (1972).
10S. Foner,Rev. Sci. Instrum.
30, 548 (1959).
11B. C. Dodrill, TechConnect Briefs 2018, Advanced Materials Vol. 1 (2018),
p. 32.
12
H. Zijlstra,Rev. Sci. Instrum.41, 1241 (1970).
13
Z. Jan˚u and F. Soukup,Rev. Sci. Instrum.88, 065104 (2017).
14
P. Laurent, J. F. Fagnard, B. Vanderheyden, N. H. Babu, D. A. Cardwell, M. Ausloos, and P. Vanderbemden,Meas. Sci. Technol.19, 085705 (2008).
15P. Vanderbemden,Cryogenics
38, 839 (1998).
16V. Lopez-Dominguez, A. Quesada, J. C. Guzmán-Mínguez, L. Moreno, M. Lere,
M. Spottorno, F. Giacomone, J. F. Fernández, A. Hernando, and M. A. García, Rev. Sci. Instrum.89, 034707 (2018).
17R. Egan, M. Philippe, L. Wera, J. F. Fagnard, B. Vanderheyden, A. Dennis, Y. Shi,
D. A. Cardwell, and P. Vanderbemden,Rev. Sci. Instrum.86, 025107 (2015).
18
A. M. Campbell, inMagnetic Susceptibility of Superconductors and Other Spin Systems, edited by R. Hein, T. Francavilla, and D. Liebenberg (Springer, USA, 1991), p. 129.
19
S. Kohout, J. Roos, and H. Keller,Rev. Sci. Instrum.78, 013903 (2007).
20
A. J. J. VanDalen, R. Griessen, and M. R. Koblischka,Physica C257, 271 (1996).
21
S. Spagna and M. B. Simmonds, U.S. patent 5,798,641 (25 August 1998).
22
R. Griessen,Cryogenics13, 375 (1973).
23
J. S. Brooks, M. J. Naughton, Y. P. Ma, P. M. Chaikin, and R. V. Chamberlin, Rev. Sci. Instrum.58, 117 (1987).
24W. Andrä, H. Danan, and R. Hergt,Phys. Status Solidi A111, 583 (1989). 25M. Qvarford, K. Heeck, J. G. Lensing, R. J. Wijngaarden, and R. Griessen,Rev.
Sci. Instrum.63, 5726 (1992).
26
27
C. Rossel, P. Bauer, D. Zech, J. Hofer, M. Willemin, and H. Keller,J. Appl. Phys. 79, 8166 (1996).
28J. Brugger, M. Despont, C. Rossel, H. Rothuizen, P. Vettiger, and M. Willemin,
Sens. Actuators73, 235 (1999).
29
M. Willemin, C. Rossel, J. Brugger, M. Despont, H. Rothuizen, P. Vettiger, J. Hoffer, and H. Keller,J. Appl. Phys.83, 1163 (1998).
30M. Löhndorf, J. Moreland, P. Kabos, and N. Rizzo,J. Appl. Phys.
87, 5995 (2000).
31
C. Rossel, M. Willemin, A. Gasser, H. Bothuizen, G. I. Meijer, and H. Keller, Rev. Sci. Instrum.69, 3199 (1998).
32M. J. Naughton, J. P. Ulmet, A. Narjis, S. Askenazi, M. V. Chaparala, and A. P.
Hope,Rev. Sci. Instrum.68, 4061 (1997).
33
M. J. Naughton, J. P. Ulmet, A. Narjis, S. Askenazi, M. V. Chaparala, and P. Richter,Physica B246-247, 125 (1998).
34E. Ohmichi and T. Osada,Rev. Sci. Instrum.
73, 3022 (2002).
35S. A. J. Wiegers, A. S. VanSteenbergen, M. E. Jeuken, M. Bravin, P. E. Wolf,
G. Remenyi, J. A. A. J. Perenboom, and J. C. Maan,Rev. Sci. Instrum.69, 2369 (1998).
36S. Weyeneth, R. Puzniak, U. Mosele, N. D. Zhigadlo, S. Katrych, Z. Bukowski,
J. Karpinski, S. Kohout, J. Roos, and H. Keller,J. Supercond. Novel Magn.22, 325 (2009).
37
M. Tejedor, A. Fernandez, and M. A. Cerdeira,Rev. Sci. Instrum.67, 851 (1996).
38
A. K. Agarwala,Rev. Sci. Instrum.59, 2265 (1988).
39
D. E. Farrell, W. K. Kwok, U. Welp, J. Frendrich, and G. W. Crabtree,Phys. Rev. B51, 9148 (1995).
40
M. R. Schaapman, P. C. M. Christianen, J. C. Maan, D. Reuter, and A. D. Wieck, Appl. Phys. Lett.81, 1041 (2002).
41M. J. Pechan, A. P. Runge, and M. E. Bait,Rev. Sci. Instrum.
64, 802 (1993).
42B. D. Cullity and C. D. Graham,Introduction to Magnetic Materials, 2nd ed.
(Wiley-IEEE Press, New Jersey, 2009).
43
F. E. Luborsky and C. R. Morelock,J. Appl. Phys.35, 2055 (1964).
44J. P. Eisenstein,Appl. Phys. Lett.
46, 695 (1985).
45H. Takahashi, K. Ishimura, T. Okamoto, E. Ohmichi, and H. Ohta,JPSJ News
Comments14, 06 (2017).
46
M. Blankenhorn, E. Heintze, M. Slota, J. VanSlageren, B. A. Moores, C. L. Degen, L. Bogani, and M. Dressel,Rev. Sci. Instrum.88, 094707 (2017).
47
Quantum Design, 11578 Sorrento Valley Road, San Diego, CA.
48
P. Vanderbemden, Z. Hong, T. A. Coombs, M. Ausloos, N. H. Babu, D. A. Cardwell, and A. M. Campbell,Supercond. Sci. Technol.20, S174 (2007).
49H. Ma, H. Liu, F. Liu, H. Zhang, L. Ci, Y. Shi, and L. Lei,Rev. Sci. Instrum.
89, 015102 (2018).
50
M. Lao, J. Hänisch, S. Kauffmann-Weiss, R. Gehring, H. Fillinger, A. Drechsler, and B. Holzapfel,Rev. Sci. Instrum.90, 015106 (2019).
51
J. G. Noudem, L. Porcar, O. Belmont, D. Bourgault, J. M. Barbut, P. Tixador, M. Barrault, and R. Tournier,Physica C282-287, 2625 (1997).
52F. T. Hedgcock and P. L. Li,Phys. Rev. B
2, 1342 (1970).
53K. Hoffmann,An Introduction to Measurements Using Strain Gages (Hottinger
Baldwin Messtechnik GmbH, Darmstadt, 1989).
54
A. Patel, K. Filar, V. I. Nizhankovskii, S. C. Hopkins, and B. A. Glowacki,Appl. Phys. Lett.102, 102601 (2013).
55E. R. Naimon, H. M. Ledbetter, and W. F. Weston,J. Mater. Sci.
10, 1309 (1975).
56E. Diez-Jimenez, J. L. Perez-Diaz, C. Ferdeghini, F. Canepa, C. Bernini,
C. Cristache, J. Sanchez-Garcia-Casarrubios, E. M. Ruis-Navas, and J. A. Martinez-Rojas,J. Magn. Magn. Mater.451, 549 (2018).
57M. Katter,IEEE Trans. Magn.
41, 3853 (2005).
58Y. Shi, N. H. Babu, K. Lida, and D. A. Cardwell,Supercond. Sci. Technol.
20, 38 (2007).
59
M. P. Philippe, J. F. Fagnard, L. Wéra, M. Morita, S. Nariki, H. Teshima, H. Caps, B. Vanderheyden, and P. Vanderbemden,J. Phys.: Conf. Ser.695, 012003 (2016).
60J. F. Fagnard, M. Morita, S. Nariki, H. Teshima, H. Caps, B. Vanderheyden, and
P. Vanderbemden,Supercond. Sci. Technol.29, 125004 (2016).
61
A. Patel, S. C. Hopkins, and B. A. Glowacki,Supercond. Sci. Technol.26, 032001 (2013).
62
A. Patel, A. Baskys, T. Mitchell-Williams, A. McCaul, W. Coniglio, J. Hänisch, M. Lao, and A. Glowacki,Supercond. Sci. Technol.31, 09LT01 (2018).
63A. Baskys, A. Patel, and B. A. Glowacki,Supercond. Sci. Technol.
31, 065011 (2018).
64