Where we look when we drive: A multidisciplinary approach.
Roland Brémond
(a)*, Jean-Michel Auberlet
(a), Viola Cavallo
(a), Lara Désiré
(b), Vérane Faure
(a), Sophie
Lemonnier
(a), Régis Lobjois
(a)and Jean-Philippe Tarel
(a)"(a) IFSTTAR, Champs sur Marne, France"
"(b) CEREMA, Saint Brieuc, France"
Abstract
This paper reviews a cluster of recent and current researches in the field of visual attention conducted at the LEPSIS Lab (IFSTTAR). Taking advantage of the multidisciplinary structure of the research team, contributions have been proposed in the fields of image processing, artificial intelligence, virtual reality, cognitive psychology and ethology. In image processing, we have contributed to predictive models of the gaze fixations in a driving task, namely, looking for road signs, proposing a computational model of top-down visual attention. In artificial intelligence, a simple computational model of visual attention was proposed and implemented in an agent-based microscopic traffic simulation model. In virtual reality, the blink frequency was proposed in order to assess the relevance of driving simulators in terms of the driver’s mental workload. In cognitive psychology, the visual conspicuity of powered two wheels was assessed on a driving simulator, leading to recommendations about their lighting system design; another contribution gave evidence that oculomotor patterns can reveal crossing decisions at crossroads. In cognitive ethology, a joint work is in progress with the CEREMA in order to study oculomotor patterns at crossroads in a field test, thanks to a dedicated vehicle.
Keywords: visual attention, saliency, eye movements, blinks.
Résumé
Cet article présente un ensemble de recherches récentes et en cours dans le domaine de l’attention visuelle, menées au laboratoire LEPSIS de l’IFSTTAR. Grâce à la structure pluridisciplinaire du laboratoire, des contributions ont été proposées dans les domaines du traitement d’images, de l’intelligence artificielle, de la réalité virtuelle, de la psychologie cognitive et de l’éthologie. En traitement d’images, nous avons proposé un modèle de calcul de la saillance visuelle des panneaux routiers, en référence à une tâche de conduite. En intelligence artificielle, nous avons implémenté un modèle d’attention visuelle pour améliorer la simulation de trafic microscopique. En réalité virtuelle, nous avons proposé d’utiliser les clignements pour mesurer la charge mentale sur simulateur de conduite. En psychologie cognitive, la saillance visuelle des deux roues motorisés a été étudiée, ce qui a permis d’aboutir à des recommandations sur le design des phares ; nous avons également montré que les patterns oculomoteurs peuvent nous informer sur la décision de traverser en carrefour. En ethologie, des travaux conjoints avec le CEREMA sont en cours pour étudier le comportement oculomoteur en carrefour, grâce à un véhicule instrumenté.
Mots-clé: attention visuelle, saillance, mouvements oculaires, clignements.
*
Corresponding author Tel.: +(33)1-8166-8534.
1. Introduction
In humans, vision is a sense that allows resolving fine detail in a scene, at close and far distance and in a fast sequence (Snowden, Thompson, and Troscianko, 2006). All these properties make it a valuable sense to gather information from such a rapid self-motion activity as driving. As such, there is no doubt that driving is a visually guided self-motion (Sivak, 1996), and twenty years ago, in an influential paper, Land and Lee (1994) addressed the question “where we look when we steer”. The issues of visual attention and gaze tracking have become, since, a major trend in transportation research, taking advantage of the fast development of eye tracker devices, together with the development of computational models of visual attention.
This paper reviews a cluster of recent and current researches in this area, conducted at the LEPSIS Lab (IFSTTAR). Taking advantage of the multidisciplinary structure of the research team, contributions have been proposed in the fields of image processing, virtual reality, artificial intelligence, cognitive psychology and ethology.
In the field of image processing, we proposed a predictive model of gaze fixations in a driving task, namely, looking for road signs, proposing a computational model of top-down visual attention (Simon, Brémond and Tarel, 2009). We have also proposed a bottom-up computational model relevant to compute the saliency in High Dynamic Range images (Petit, Brémond and Tarel, 2009). In the field of artificial intelligence, a simple computational model of visual attention was proposed and implemented in an agent-based microscopic traffic simulation model of crossroads (Ketenci, Auberlet, Brémond and Grislin, 2012). In the field of virtual reality, various oculometric indexes have been investigated in order to assess the relevance of driving simulators for specific driving tasks. For instance, it was proposed to use the blink frequency as a marker of the driver’s mental workload (Faure, Lobjois and Benguigui, 2013), allowing to compare virtual and actual driving. In the field of cognitive psychology, the visual conspicuity of powered two wheels was assessed on a driving simulator, leading to recommendations about their lighting system design (Cavallo and Pinto, 2012); another contribution gave evidence that oculomotor patterns can reveal crossing decisions at crossroads (Lemonnier, Brémond and Baccino, 2013). In the field of cognitive ethology, a joint work is in progress with the CEREMA in order to study oculomotor patterns at crossroads in a field test, thanks to a dedicated vehicle (Lemonnier, Brémond, Désiré and Baccino, 2013).
2. Visual saliency on the road
Visual saliency refers to the objects attributes which attract one’s attention. These attributes are labeled as bottom-up or top-down: bottom-up saliency is data-driven, as when a salient event pops out in the environment (for instance, a red ball among green ones). Top-down saliency is task-driven, and refers to the object’s characteristics which are relevant with respect to the ongoing task (for instance, traffic lights convey relevant information in urban traffic). On the road, these two levels of visual saliency apply, and can be considered with various approaches. We give in the following three examples of the relevance of visual saliency in road applications, in the field of Computer Vision and Experimental Psychology.
2.1. Computer Vision approach
A number of computational models for bottom-up (pop-out) saliency have been proposed in the last fifteen years. However, these algorithms are rarely applied on High Dynamic Range (HDR) images. We thus derived a variation of Itti’s classical algorithm (Itti, Koch and Niebur, 1998) which extracts salient areas in both HDR and Low Dynamic Range (LDR) images (Petit, Brémond and Tarel, 2009; 2010). From an eye tracking experiment with a HDR scene, we show that the proposed algorithm leads to a better fit between the saliency map and the ocular fixation map than using Itti’s algorithm. Such a bottom-up algorithm is useful in order to compute the saliency in High Dynamic Range road situations, such as driving at night, in tunnels, or even when car lights or traffic lights are present in the scene.
Another topic related to both image processing and visual attention is the Automatic Diagnostic of Road Signs Saliency. Road signs, the main communication media towards the drivers, play a significant role in road safety and traffic control trough drivers’ guidance, warning and information. Nevertheless, not all traffic signs are seen by all drivers, leading to accident risks. In order to manage safer roads, the estimation of road infrastructure's saliency is thus of importance for road engineers and authorities who aim at making and keeping traffic signs salient enough to attract attention regardless of driver's workload.
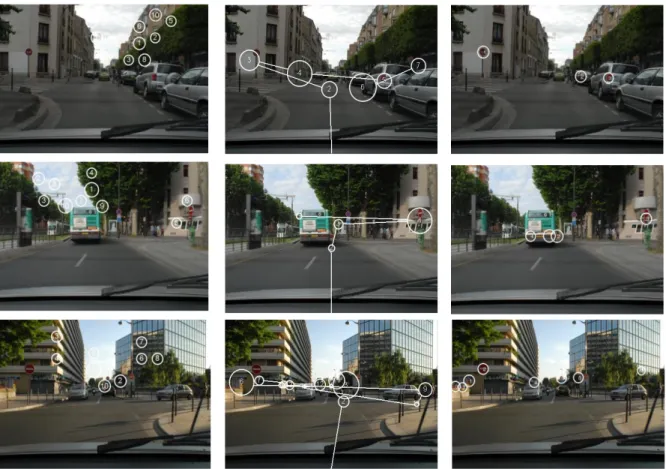
Fig. 1. Left: salient areas in 3 sample images, as computed by a bottom-up saliency algorithm. Right: salient areas computed by our top-down algorithm. Middle: scan-paths of observers asked to search for road signs.
What attracts a driver's attention is related both to psychological factors (motivations, driving task, etc.) and to the photometrical and geometrical characteristics of the road scene (colors, background, etc.). The saliency (or conspicuity) of an object is the degree to which this object attracts the driver’s visual attention, on a given background. We have seen that road signs perception depends on the two main components of visual attention: objects pop-out and visual search. The first one, also mentioned as bottom-up saliency, is not very relevant when the task is to search for a particular object, whereas one important driving task is to look for road signs. As current computational models of visual search saliency are limited to laboratory-situations, we have proposed a new model allowing computing visual search saliency in natural scenes (Simon, Tarel and Brémond, 2009; 2010). Relying on statistical learning algorithms, the proposed algorithm captures the priors a driver learns on object appearance for any given class of road signs. Fig. 1 shows salient areas computed with a classical bottom-up algorithm (Itti et al., 1998), our algorithm, and the scanpath of a subject during a road sign search task. The proposed model has been evaluated with success on a panel of subjects; see Simon et al. (2010) for more details.
The core of our system is an automatic estimation of road sign saliency along a road network, from images taken with a digital camera onboard a vehicle. This system can be used for accident analysis and prevention. It enables a fine diagnostic of the road signs saliency allowing to decide accurately on which signs the road manager must act, replacing it, or modifying its peripheral environment. This leads to improved asset management, road infrastructure maintenance and road safety.
2.2. Experimental psychology approach
The question of visual conspicuity has long been considered decisive for improving motorcyclist safety. The main safety measure in the past has been the use of Daylight Running Lamps (DRL) by motorcycles, which have become compulsory in many countries since the seventies. The efficiency of motorcycle DRLs, evidenced by many studies, is due to a double effect: they increased the motorcycle's contrast with the environment and thus improve its detectability; they also provide a consistent feature, a visual signature that makes them easy to identify. This conspicuity advantage of motorcycles as the only vehicles with DRLs is now questioned by the growing practice among car drivers of also using DRLs.
We have studied the effect of several visual factors that influence motorcycle conspicuity, linked to the characteristics of the road environment (presence or absence of car DRLs) and of the motorcycle (headlight configurations). In these experiments, participants were briefly presented with photographs of real-world traffic scenes showing complex urban environments and containing motorcyclists, cyclists and pedestrians as visual targets. The participants’ task was to say whether they had seen one of these vulnerable road users. The experimental conditions (short presentation time, complex visual environments, several kinds of targets presented at different distances and eccentricities) were chosen to favor attention conspicuity and to limit the participants' use of expectation-driven search strategies.
0 20 40 60 80 100
Motorcyclist Cyclist Pedestrian
D e te ct ion r at e ( % ) Off On 0 20 40 60 80 100
Standard Yellow Helmet Triangle
D e te ct ion r at e ( % )
Fig. 2: Detection rates. Left: for motorcyclists, cyclists and pedestrians, according to whether the car’s DRLs were off or on. Right: for motorcycles equipped with standard, yellow, helmet or triangle configurations.
The findings of the first study (Cavallo and Pinto, 2012) indicate that car DRLs create a visual noise that decreases the detection and identification of motorcycles, but also has an adverse effect on the conspicuity of cyclists and pedestrians (Fig. 2, left). The detrimental effect of car DRLs in the vicinity of motorcycles, acting as visual distractors, has been clearly demonstrated.
The second study explored ways of defining a new, unique visual signature for motorcycles that could make them easier to detect and identify in a car DRL environment. Three innovative headlight configurations were compared to the standard headlight, in conditions similar to those of the first study. Color coding (yellow motorcycle headlight) proved most effective, and an additional light on the motorcyclist's helmet also improved the motorcycle conspicuity, whereas a triangle headlight proved ineffective (Fig. 2, right). The findings indicate several ways of improving motorcycle safety through innovative headlight ergonomics (Pinto, Cavallo and Saint Pierre, in press).
3. Eye movements in driving simulation
Driving simulators are developed by research laboratory in order to study driver’s behavior and their interaction with transport systems (road signs, infrastructure and other users). They are based on virtual reality techniques, which allow the driver to interact with an artificial environment, through a variety of intuitive controls.
3.1. Driving simulators assessment
The development of driving simulators allows studying the driver’s behavior in various driving context, the same for all participants, and safely; hopefully the conclusions of these study would apply to the driving behavior on
the road (see for instance, at TRA 2014, Vienne et al.; Shahar and Brémond). Virtual reality is a fairly new research area. Standards are not ready for its development and its use. For a specific virtual reality system, such as a driving simulator, one may consider that its design should take into account the user’s needs. Conversely, each simulator has its own technical characteristics, and may be ready to use for various applications, and at various costs. Recent technological advances allow increasing the simulators’ fidelity, with respect to the “real world”, that is, driving on the road. Technical developments are intended to reduce the gap between performance in the real and virtual worlds, to assist immersion, and to improve the usability of simulators. They may also reduce simulator sickness. However, it must be pointed that progress is still needed in these fields.
Yet, the general view seems to be that technical improvements can also increase the simulator’s validity, which relies on the correspondence between the simulated and the real world in the way the human operator behaves. Malaterre and Fréchaux (2001), described two levels of validity: the ethological validity, which corresponds to the resemblance to the observed behavior, and the psychological validity, which is defined as the sameness of the psychological processes underlying the (driving) activity. In the past few years, a “user based approach” emerges to assess the validity of driving simulators. This approach involves three procedures:
(1) to take account of subjective data, such as questionnaires or interviews; (2) to collect behavioral data;
(3) to measure physiological data, such as eye movement.
The subjective approach provides information about presence, and about the difficulties that a person can feel in a virtual environment. The behavioral approach gives insights about whether a simulator induces a natural driving behavior, and about the participant’s ability to complete a specific task in a virtual environment. But these observations do not provide information about the cognitive processes involved in the task. For instance, a driver may allocate more attention to a simulated driving task, compared to real driving. Therefore, in order to assess the validity of a driving simulator, we must reach beyond the subjective and behavioral data. Our approach, based on physiological data, allows assessing the ongoing cognitive processes of the drivers. Eye movement data collection is increasingly popular in behavioral research. For instance, they are used to indicate the cognitive strategies developed to perform a specific task (see also sections 3.2 and 4). Several characteristics of eye movements, such as eye blinks, pupil dilation and saccadic peak velocity reflect the variations of attention, emotion and mental workload over time. These information seem relevant for the assessment of a driving simulator, especially in terms of psychological validity.
An observation of the eye blink frequency could also help to discriminate the source of mental workload (Faure, Lobjois and Benguigui, 2013). In a simulated driving task, we have observed a decrease in the eye blink frequency, when the level of task difficulty increases. On the other hand, we have observed an increase in the eye blink frequency in a dual task condition compared to a single task condition, while the mental workload increases because of attention switching. As a result, eye blinks seem to be a relevant indicator of the mental workload caused by the complexity of the driving task or of the driving environment, in single task condition. But an increase of the eye blink frequency may also reflect an increase of mental workload due to a dual task, such as driving while using a phone, or interacting with an In-Vehicle Information System (IVIS).
3.2. Driving behavior studies
Behavioral studies on driving simulators may also use eye movements in order to get a better understanding of the driving task. Yarbus (1967) gave evidence for a strong link between oculomotor patterns and the ongoing task. Following this idea, we have explored such a link for cognitive processes active during a driving task. We considered a decision-making task in a driving situation, using Svenson’s model of decision making (Svenson, 1992), the Differentiation and Consolidation Theory (Diff/Cons). Differentiation consists in an evaluation and produces a diagnostic: the prior decision. Then, Consolidation leads to the final decision.
In our study, the decision was to stop or not at a crossroad (NoGo/Go decision). This decision was modulated by the road sign (Stop, Priority or Give-Way) and the traffic density (no, few or many vehicles). For each condition, predictions were expressed in terms of cognitive processes, based on the Diff/Cons theory. In the Priority condition, a “Cons” process was expected. In the Stop condition, another “Cons” process was expected, but the
NoGo decision needs no interaction with others vehicles, so the risk level is lower and the process was expected to be closer to the Baseline (no decision-making task). Then, when approaching the crossroads, the driver anticipates the next decision (when to restart), with a “Diff” process. In the Give-Way (GW) condition, a “Diff” process was expected, followed by a “Cons” process with a Go decision (as the Priority condition), and a “Diff” process in the NoGo decision (as the Stop condition). In addition, the visual activity is more important in Diff than in Cons, and more important in Cons than in Baseline; moreover, when the visual activity increases, the saccade amplitudes (SA) are expected to increase and the fixation durations (FD) to decrease (Chapman and Underwood, 1998). In consequence, predictions were possible in terms of SA and FD, that is, in terms of eye movements.
Thirty-four participants took part in a driving simulation experiment; they were equipped with SMI eye tracker glasses. The experiment lasted approximately one hour (Lemonnier, Brémond and Baccino 2012; 2013). The independent variables were the Position (“Before” and “After” the prior decision in the GW condition) and the Situation (stop, priority, GW Go and NoGo). In the “Before” section, the visual activity was highest for SA and FD in the GW condition. This is congruent with the presence of a “Diff” process before the prior decision. A significant difference was found between the Stop and Priority conditions for the SA, which is congruent with the fact that the “Cons” process is closer to the Baseline in the Stop condition. In the “After” section, significant differences were found between the Stop and Priority conditions, with a higher visual activity in the Stop condition. Comparing the GW-Go and GW-NoGo conditions, no significant effect was found for the mean values. However, significant differences were found for the mean slopes, showing increasing visual activity in the GW-NoGo condition.
In short, in the “After” section, similar patterns were found in the GW-Go and in the Stop conditions, corresponding to a Diff process, which anticipates the next decision at the crossroads (when to restart). Also, similar patterns were found in the GW-Go and Priority conditions, corresponding to a “Cons” process. These results suggest that it is possible to discriminate cognitive processes from eye movement patterns in a driving situation.
4. Naturalistic studies
Snowden et al. (2006) emphasize that “Our visual system is not there to faithfully record the image outside, it is there to give us the necessary information for us to behave appropriately”. This sentence illustrates the move from a traditional approach that used to study human vision in highly controlled laboratory experiments to its study in the natural world (Hayhoe and Rothkopf, 2011). This paradigm shift is requested in the study of human cognition and behaviour in natural settings within the framework of Cognitive Ethology (Kingstone, Smilek and Eastwood, 2008).
In the context of driving, this approach is not so new but in recent years, progress in data acquisition and recording made the conduct of on-road studies easier and at lower cost (Lenné, 2013). Instrumented vehicles allow observing the driving activity in natural traffic conditions. If we want to get insights about the information used to drive these behaviors, the measurement of eye movements in natural driving conditions is appealing. Even if objects that are glanced are not always processed (“looked but did not see”) and that objects that are not fixated may have been noticed through peripheral perception, the direction of gaze is nonetheless considered to be an overt manifestation of the momentary deployment of attention in a scene (Hayhoe and Rothkopf, 2011). In recent years, the eye tracker technology improved a lot and different manufacturers developed systems aiming at fulfilling the specific needs of human factors researchers to use eye-trackers in the field. Thus, if in the past researchers conducted researches with home-made eye-tracking system (see Land (1992)), more and more studies use eye-tracker systems manufactured by eye-tracking specialized companies (Taylor et al., 2013).
Many eye-movement measures are available (Holmqvist et al., 2011) and some are easier than other to calculate. The most common eye movement events are fixation and saccade. A fixation corresponds to the period of time where the eye is nearly still and a saccade is the rapid motion of the eye from one fixation to another. Because it is considered valid that we are blind during a saccade, fixation events are especially interesting in driving studies. When we are interested in the information collected by the driver outside the vehicle (e.g. from traffic signs, signals, pavement markings), the prime measures are those that determine whether the driver is looking at a particular location or signal. Those eye-movement measures which are referred to as Area Of Interest (AOI) measures are particularly time consuming to obtain in the context of driving. Because they change with time,
their determination has to be made mostly manually. Another difficulty is that various information may be present in the same AOI at the same time. For instance, the use of AOI to understand which information is used in curve driving (tangent point versus point on the future path) may not be relevant, because the AOIs of the tangent point and future path may frequently overlap (Lappi, Pekkanen, and Itkonen, 2013).
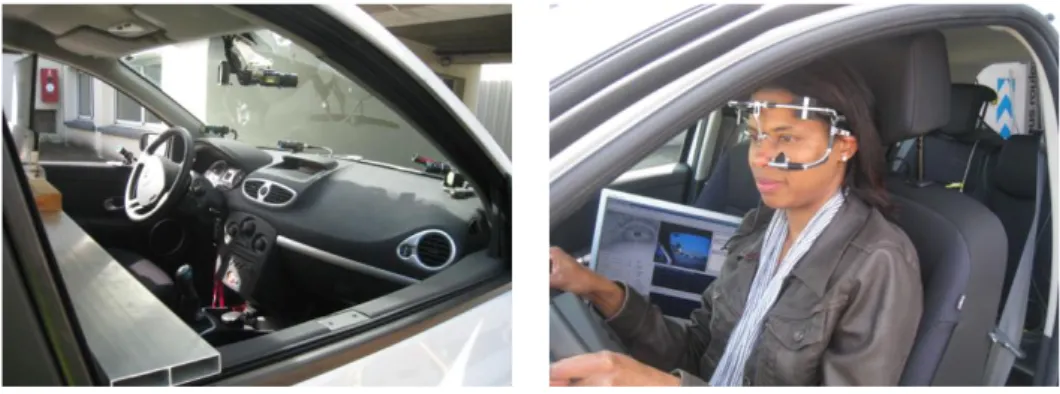
Fig. 3: Views of the CEREMA’s instrumented vehicle (and instrumented driver).
However, because visual attention is highly task-dependant, and should be studied in relation with the driver behaviors, the CEREMA (Saint Brieuc Lab) instrumented a vehicle (see Fig. 3) which can be described as a High Instrumentation Vehicle (Valero-Mora et al., 2013). The Data Acquisition Systems combines three systems:
A data-logger (DIRCO), developed at IFSTTAR, which synchronizes the data acquired from a GPS receiver, the controller area network (CAN) of the vehicle, and a gyro;
A video acquisition system (The Observer, Noldus Information Technology) which captures videos from three interior cameras (face of the driver, rear view, driver from the back) on a single frame using a video quad splitter;
An eye-tracking equipment (SmartEye Pro version 5.9): the glance monitoring system corresponds to a vehicle-mounted combination of four eye trackers and three scene cameras. The direction of the gaze is overlaid on a panoramic view of the road.
An experiment was conducted with this vehicle, to study the driver’s behavior (glance behavior and deceleration behaviors) during their approach to intersections (crossroads and T-junctions) with different traffic control signs (stop versus yield signs), see Lemonnier, Brémond, Désiré and Baccino (2013). Another configuration of the vehicle is available with a head-mounted eye-tracker (Pertech). An experiment studying the driver’s behavior in transitions between rural and urban areas is in progress.
5. Application to traffic simulation
The above examples show that the study of visual attention on the road may use theoretical frameworks from various academic fields. In this last example of the LEPSIS contributions, we show that common knowledge on visual attention may also contribute to traffic simulation, via an agent-based model.
The main goal of traffic modelling (and of the associated simulation tools) is to predict the flow and interactions of road traffic. In urban environments, previous researches manly focused on traffic flow prediction before and after crossroads. The main reason for this situation may be that in urban areas, crossroads are signalized, and thus they are considered as regulation points that need not to be simulated. Indeed, from the road engineer point of view, the main parameters at crossroads are the flow and the waiting time in the queue.
But another point may be considered. The crossroads is a complex area, where interactions are different from what they are in car following or overtaking. Today, a number of emerging issues (traffic jam, pollution, pedestrian issues) point out the need for a new definition of the public space, both in space and time. In order to assess the crossroads functions, simulation tools are useful, and their relevance depends on how they take into account the interactions, between drivers and between drivers and pedestrians. The following contribution is a tentative in this direction.
Traffic flow regulations are expected to follow some formal rules, such as the highway code, but this is not always the case, and some informal rules may also apply (Björklund and Åberg, 2005). Among these rules, an important one says that that you should not enter a crossroads, if there is no way out. This rule is very popular in driving behavior and traffic studies (gap acceptance), while one can easily see that every driver has his own understanding of this rule. True drivers actively use the physical space at the center of the crossroads, which may lead to both congestions and accidents.
We have tried to improve microscopic traffic simulations, not only when approaching the crossroads, but also inside the crossroads, including near-accidents. An agent-based model of microscopic traffic simulation was proposed, based on common knowledge in cognitive science about the limited amount of percepts that one can process at the same time (Marois, 2005). The driver selects the more salient and relevant items in his environment, with respect to the ongoing task, and only a limited subset of percepts are processed. Based on the game theory, a simulated driver can cross a crossroads (Mandiau et al., 2008), while processing only a limited amount of information (Ketenci et al., 2012 ; Ketenci, et al., in press).
6. Conclusion
It appears from these examples that our contributions address three main issues. The first one is to improve the state of the art about “where we look when we drive”, which is known to be very task- and condition-dependent. These contributions follow an important trend in the field of visual attention, addressing an ecological situation, driving, with a high social impact: thus, we participate to the growing interest in studying visual attention outside of the lab. The social impact of this field of studies is related to the varieties of potential applications. New knowledge is likely to contribute to a better design and diagnosis of road design (including road signs, road studs, etc.) and in-vehicle systems (ADAS, automotive lighting).
In addition to direct contribution to visual attention on the road, the second issue that we address is the development of computational models using the current state of the art in terms of visual attention, with applications, so far, in traffic simulation and road sign saliency diagnosis. These contributions in image processing and multi-agent systems are bio-inspired, in the sense that they implement some key components of the driver’s visual attention into quantitative models of visual perception.
Finally, based on the same state of the art, the gaze behavior is considered as a component of the driving behavior, allowing a better comparison between real and virtual driving, and thus a better estimation of driving simulators validity, possibly giving insights for new methodological approaches in virtual reality evaluation issues. The strong links between these three approaches of visual attention in driving encourage us in our multidisciplinary approach.
References
Björklund, G.M., and Åberg, L. (2005). Driver behavior in intersections: Formal and informal traffic rules. Transportation Research, Part F, 8(3):239-253.
Brémond, R., Petit, J. and Tarel, J.-P. (2010). Saliency Maps for High Dynamic Range Images, Media Retargetting workshop in Proc. ECCV 2010, Crete (Greece), September 2010.
Cavallo, V. and Pinto, M. (2012). Are car daytime running lights detrimental to motorcycle conspicuity? Accident Analysis and Prevention, 49:78-85.
Cavallo, V. and Pinto, M. (in press). Visual factors affecting motorcycle conspicuity: Effects of car daytime running lights and motorcycle headlight design. In L. Rößger, M. Lenné, & G. Underwood (Eds.), Increasing Motorcycle Conspicuity: Design and Assessment of Interventions to Enhance Rider Safety. Ashgate Publishing Ltd.: Farnham, UK
Chapman, P.R, and Underwood, G. (1998). Visual search of driving situations: Danger and experience. Perception 27:951–64.
Faure, V., Lobjois, R. and Benguigui, N. (2013). Effects of driving environment complexity and dual task on eye blink rate. European Conference on Eye Movements (poster session), Lund, Sweden, August 2013.
Hayhoe, M. M., and Rothkopf, C. A. (2011). Vision in the natural world. Wiley Interdisciplinary Reviews: Cognitive Science, 2:158–166.
Holmqvist, K., Nyström, M., Andersson, R., Dewhurst, R., Jarodzka, H., and van de Weijer, J. (2011). Eye Tracking: A comprehensive guide to methods and measures. Oxford, United-Kingdom: Oxford University Press.
Itti L., Koch C. and Niebur E. (1998), A model of saliency based visual attention for rapid scene analysis, IEEE Transactions on Pattern Analysis and Machine Intelligence, 20:1254-1259
Ketenci, U., Auberlet, J.-M., Brémond R. and Grislin, E. (2012). Improved road crossing behavior with active perception approach. In proc. Transportation Research Board Annual Meeting, Washington, January 2012.
Ketenci, U., Brémond, R., Auberlet, J.-M. and Grislin, E. (in press). Drivers with limited perception: model and application to traffic simulation Improved road crossing behavior with active perception approach. Recherche, Transports Sécurité.
Kingstone, A., Smilek, D., and Eastwood, J. D. (2008). Cognitive Ethology: A new approach for studying human cognition. British Journal of Psychology, 99(3), 317–340.
Land, M. F. (1992). Predictable eye-head coordination during driving. Nature, 359(6393):318.
Land, M. F. and Lee D. N. (1994). Where do we look when we steer. Nature, 369(6483):742-744.
Lappi, O., Pekkanen, J., and Itkonen, T. H. (2013). Pursuit eye-movements in curve driving differentiate between future path and tangent point models. PLoS ONE, 8(7):e68326.
Lemonnier, S., Brémond R. and Baccino, T. (2012). To what extent visual search depends on the task? The role of attention. GDR-Vision annual workshop (poster session), Marseille, Novembre 2012.
Lemonnier, S., Brémond, R., Désiré, L. and Baccino, T. (2013). Validation of a visual attention model in a driving field test: difficulties and benefits. IAAP School on Applied Cognitive Research (poster session), Paris, April 2013.
Lemonnier, S., Brémond, R. and Baccino, T. (2013). Visual attention in a complex task: Discrimination of decisional processes with eye movements patterns. European Conference on Eye Movements, Lund, Sweden, August 2013.
Lenné, M. G. (2013). The contribution of on-road studies of road user behaviour to improving road safety. Accident Analysis & Prevention, 58:158–161.
Malaterre, G., and Frechaux, J. (2001). Etude de la validité des simulateurs de conduite par comparaison de tâches réalisées en situation réelle et en simulation. Actes INRETS (p. 149-156). Présenté à Facteurs perceptifs dans les activités de transport. Journée spécialisée, Institut national de recherche sur les transports et leur sécurité.
Mandiau, R., Champion, A., Auberlet, J.-M., Espié, S., and Kolski, C. (2008). Behaviour based on decision matrices for a coordination between agents in a urban traffic simulation. Applied Intelligence, 28:121–138.
Marois, R., and Ivanoff, J. (2005). Capacity limits of information processing in the brain. Trends in Cognitive Sciences, 9 :296–305.
Petit, J., Brémond, R. and Tarel, J.-P. (2009). Une carte de saillance adaptée aux images HDR. Revue Française d'Informatique Graphique, vol. 3, n°2, article 1.
Pinto, M., Cavallo, V., and Saint-Pierre, G. Influence of front light configuration on the visual conspicuity of motorcycles. Accident Analysis and Prevention (in press).
Shahar, A. and Brémond, R. (2014). Toward smart active road studs for lane delineation. To appear in Proc. Transportation Research Arena, 2014, Paris (France).
Simon L., Tarel, J.-P. and Brémond, R. (2010), A Model for Automatic Diagnostic of Road Signs Saliency, in Proc. Transport Research Arena, Brussels, Belgium, June 2010.
Simon, L., Brémond, R. and Tarel, J.-P. (2009). Alerting the drivers about road signs with poor visual saliency, IEEE international Conference on Intelligent Vehicles, Xi’an, China, June 2009.
Sivak, M. (1996). The information that drivers use: Is it indeed 90% visual? Perception, 25(9):1081-1089.
Snowden, R. J., Thompson, P. and Troscianko, T. (2006). Basic vision: An introduction to visual perception. Oxford University Press.
Svenson, O. (1992). Differentiation and consolidation theory of human decision making: A frame of reference for the study of pre-and post-decision processes. Acta Psychologica 80:143–168.
Taylor, T., Pradhan, A. K., Divekar, G., Romoser, M., Muttart, J., Gomez, R., Pollatsek, A., and Fischer, D. L. (2013). The view from the road: The contribution of on-road glance-monitoring technologies to understanding driver behavior. Accident Analysis & Prevention 58:175-186
Valero-Mora, P. M., Tontsch, A., Welsh, R., Morris, A., Reed, S., Touliou, K., & Margaritis, D. (2013). Is naturalistic driving research possible with highly instrumented cars? Lessons learnt in three research centers. Accident Analysis & Prevention, 58 :187–194.
Vienne, F., Caro, S., Dumont, E., Rosey, F. and Auberlet, J.M. (2014). Driving simulator: An innovative tool to test new road infrastructures. To appear in Transportation Research Arena, 2014, Paris (France).