Compressing some sol-gel materials reduces their stiffness:
a textural analysis
C.J. Gommes, N. Job, S. Blacher and J.-P. Pirard
Université de Liège, Laboratoire de Génie Chimique B6a, B-4000 Liège, Belgium.
The mechanical behaviour of two series of silica and of resorcinol xerogels is analyzed by mercury porosimetry. The data are expressed as pressure-density curves, which enables textural information to be obtained. In particular, it is shown that some of the analyzed samples exhibit a marked lowering of their mechanical stiffness upon compression. This observation is analyzed in terms of the collapse of the sample’s porosity and of the heterogeneity of the microstructure.
1. INTRODUCTION
The general problem of textural analysis is to extract information about the microscopic structure of a material out of a macroscopic measurement. Many methods exist to characterize the microstructure of porous materials, for instance adsorption, small angle scattering, mercury porosimetry, thermoporometry, and so forth [1]. On the other hand, some measurements aim at assessing directly a useful property of the analyzed materials. This is usually the case for mechanical or electrical measurements. Textural measurements and useful property measurements can however be analyzed at once using appropriate models to link the macroscopic property to the microscopic structure.
Mechanical properties are sometimes measured to obtain textural information. For example, rheological measurements are common to gain some insight into the texture of polymer solutions and gels [2]. In principle, the same type of method could be applied to characterize the texture of dry porous materials. A convenient way to do this is to use mercury porosimetry, which is generally used to assess the pore size distribution of porous materials. However, the samples must be strong enough to withstand high mercury pressure without deforming. When it is applied to fragile materials, such as those synthesized by sol-gel process, the samples are crushed by mercury rather than intruded [3, 4]. As a consequence, the information obtained by this technique is purely mechanical. It conveys some information on the way in which the microstructure of the material resists an isostatic pressure. Although the absence of mercury intrusion renders the usual models useless for interpreting the measurements, the collected data are not devoid of textural relevance. Many models exist that relate the mechanical strength of porous materials to their microstructure [e.g. 5-7], and some have been specifically developed to analyze the compaction of porous materials in mercury porosimeters [4].
In the present study, the pressure-density curves of two series of silica and of organic xerogels, obtained by mercury porosimetry, are analyzed at the light of their microstructure. A special emphasis is given to the fact that the stiffness of some of these materials decreases significantly when the samples are compressed, which can also find a textural interpretation.
2. EXPERIMENTAL SECTION 2.1 Analyzed samples
A series of phase-separated silica xerogel samples was synthesized using tetraethoxysilane (TEOS) as main silica precursor and 3-(2-aminoethyleamino)propyltri-methoxysilane (EDAS) as additive, as described elsewhere [8]. The dilution and hydrolysis ratios were kept constant for all the samples, and only the relative amount of TEOS and EDAS was modified. After gelation, the samples were aged for one week at 60°C, and afterwards dried under vacuum. The samples are hereafter labelled ETX where X is the molar ratio EDAS/TEOS in %.
The preparation of resorcinol-formaldehyde xerogels was performed according to a previous study [9]. The resorcinol/formaldehyde ratio and the dilution ratio were fixed at 0.5 and 5.7 respectively. The pH of the starting solution was adjusted to the desired value with NaOH. After gelation and ageing at 85°C (72h) the samples were dried under vacuum. These samples are labelled RFX, where X is pH of the solution.
Typical transmission electron micrographs of fragments of the first and last samples of each series are displayed Figures 1 and 2. These micrographs were obtained by crushing the samples into a very fine powder. The global microstructure of the analyzed materials therefore corresponds to a random piling of such fragments. The overall appearance of the samples is typical of many sol-gel materials, i.e. a sponge-like structure supported by columns. Globally, the microstructure of these materials becomes denser throughout both series.
Figure 1. Typical transmission electron micrographs of fragments of samples ET2.5 (a) and of ET20 (b).
Figure 2. Typical transmission electron micrographs of fragments of samples 5.45 (a) and of RF-7.35 (b).
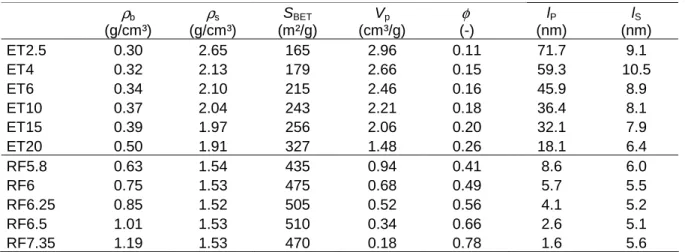
The bulk density,
ρ
b, skeletal density,ρ
s, and specific surface area, SBET, of thesesamples are reported in Table 1, and were already published elsewhere [9, 10]. The specific volume is estimated as Vp = 1/
ρ
b, and the volume density asφ
=ρ
b/ρ
s. The pore and solidchord lengths lP and lS, were estimated from these textural data as discussed previously [10].
The meaning of these two parameters is as follows. Should a random straight line be drawn across the porous material, the average length of intersection of the line with the pore or solid phase would be the corresponding chord length.
2.2 Mercury porosimetry measurements
Mercury porosimetry was performed on monolithic samples outgassed down to 0.01 Pa for at least 2 h at room temperature. The samples were transferred to a Carlo Erba Pascal 140 porosimeter on which the mercury pressure was raised from ca 0.01 MPa to 0.1 MPa, and afterwards to a Carlo Erba Pascal 240 porosimeter on which the mercury pressure is further raised to 200 MPa. A blank curve was subtracted from the raw data to correct for the compressibility of mercury.
3. RESULTS
The mercury porosimetry data are displayed in Figure 3. The curves of samples ET2.5 to ET10 exhibit a two stage phenomenon, already reported for other low density materials [11]: at low pressure the samples are compressed but not intruded by mercury, and mercury enters the remaining pores of the crushed material only above a given pressure threshold. The change of mechanism corresponds to the riser in the curves, also marked by an arrow on Figure 3. For the samples synthesized with the largest amount of EDAS and for all the RF samples, no intrusion occurs, and only the compression is observed. It can also be noted that intrusion is reversible as the riser is also observed during the decrease of pressure, but the compression is mainly irreversible.
In the present paper, we shall only focus on the compression of the samples. In this context the data are conveniently expressed as the pressure needed to compress the samples to reach a given volume density
φ
. At any given pressure, the densityφ
(P) is estimated as 1/(ρ
sV(P)), where the specific volume of the skeleton has been estimated as 1/ρ
s, and V(P) isρb (g/cm³) ρs (g/cm³) SBET (m²/g) Vp (cm³/g) φ (-) lP (nm) lS (nm) ET2.5 0.30 2.65 165 2.96 0.11 71.7 9.1 ET4 0.32 2.13 179 2.66 0.15 59.3 10.5 ET6 0.34 2.10 215 2.46 0.16 45.9 8.9 ET10 0.37 2.04 243 2.21 0.18 36.4 8.1 ET15 0.39 1.97 256 2.06 0.20 32.1 7.9 ET20 0.50 1.91 327 1.48 0.26 18.1 6.4 RF5.8 0.63 1.54 435 0.94 0.41 8.6 6.0 RF6 0.75 1.53 475 0.68 0.49 5.7 5.5 RF6.25 0.85 1.52 505 0.52 0.56 4.1 5.2 RF6.5 1.01 1.53 510 0.34 0.66 2.6 5.1 RF7.35 1.19 1.53 470 0.18 0.78 1.6 5.6
the specific volume of the material at pressure P. Since no mercury intrusion occurs, V(P) is derived from the mercury porosimetry data as V(P)=1/
ρ
b-VHg(P). The P vs.φ
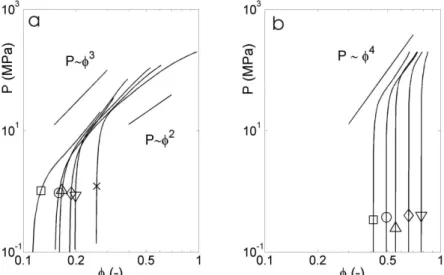
curves obtainedfrom the data of Figure 3, and from the densities of Table1, are plotted in Figure 4 in logarithmic scales. For all samples, when the pressure is initially increased, the volume fraction remains first unchanged, and compaction only begins when a given yield pressure is reached. For both series, the yield pressure increases with the initial volume fraction of the material. At pressures higher than the yield, the compaction follows a power law, which exponent can sometimes be related to the elementary deformation mechanisms of the material [5, 7].
In order to analyze in more details the behaviour of the samples near the yield pressure, it is useful to estimate their compression modulus, defined as K =
φ
dP/dφ.
This quantity is plotted in Figure 5 for all samples. For samples ET2.5 to ET6, K exhibits a plateauFigure 4. Pressure density curves of (a) on silica xerogels: ET2.5 (□); ET4 (○), ET6 (∆), ET10 (◊),
ET15 (∇), and ET20 (×), and (b) of resorcinol xerogels: RF5.8 (□); RF6 (○), RF6.25 (∆), RF6.5 (◊),
RF7.35 (∇).
Figure 3. Mercury porosimetry curves measured (a) on silica xerogels: ET2.5 (□); ET4 (○), ET6 (∆), ET10 (◊), ET15 (∇), and ET20 (×), and (b) of resorcinol xerogels: RF5.8 (□); RF6 (○), RF6.25 (∆), RF6.5 (◊), RF7.35 (∇). The full and dotted lines are the pressure increase and decrease respectively. The curves are arbitrarily shifted vertically. In Figure a, the arrows highlight the onset of mercury intrusion.
at the beginning of the compression and K increases continuously afterwards according to the same power law as P (see Figure 4). An interesting feature that is shared by all the other samples is that the beginning of compression is accompanied by a marked decrease of K, which means that these samples initially become softer upon compression.
4. DISCUSSION
A first observation that can be made from Figures 4 and 5 is that the compaction of RF xerogels and that of silica xerogels ET15 and ET20 does not resemble that of an aggregate of colloidal particles [e.g. 7, 12]. For such a structure, the mechanical strength of the links between particles is weaker than that of the particles themselves. At low pressure, the compaction of colloidal aggregates is therefore expected to occur mainly via a reorganization of the particles, with destruction of the links between particles. This mechanism can only last until the density approaches that of a dense packing (
φ
= 0.64 for monodisperse spheres). Further compaction can only occur through the destruction of the particles themselves, which should only occur at a significantly higher pressure. This would lead to a riser in the P vs.φ
curves nearφ
= 0.64. No such riser is detected for any of the studied samples (see Figure 4). In the case of ET20 for instance, P increases smoothly until very high value ofφ
are reached (Figure 4a).From TEM observations, the ET2.5 to ET6 seem to be particulate, as is also visible in Figure 1a. For these samples however, mercury intrusion does occur at high pressure. Since the compaction of samples ET2.5 to ET6 ceases before high values of
φ
are reached, no conclusion on the particulate nature of these materials can be drawn from the present analysis. Another striking observation is the lowering of K for some samples when they are compressed (see Figure 5). This phenomenon has been known for long for similar systems. For instance Gross et al. observed that the velocity of sound propagation in some sol-gel materials decreases when they are compressed [13]. The explanation given by these authors for the phenomenon is summarized in Figure 6a. The microstructure of many sol-gel materials Figure 5. Pressure density curves of (a) on silica xerogels: ET2.5 (□); ET4 (○), ET6 (∆), ET10 (◊),ET15 (∇), and ET20 (×), and (b) of resorcinol xerogels: RF5.8 (□); RF6 (○), RF6.25 (∆), RF6.5 (◊),
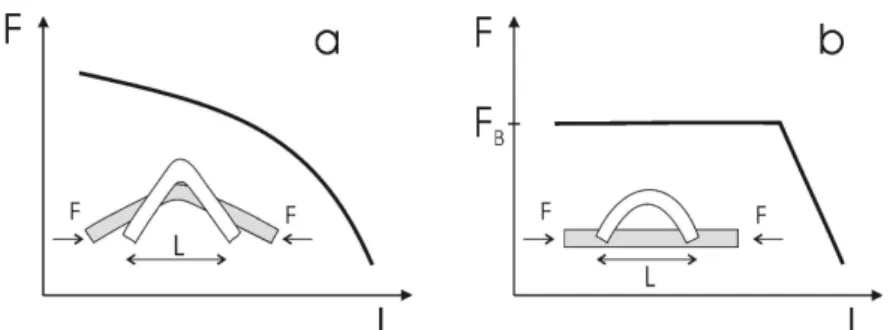
is a sponge-like structure, supported by elongated struts similar to those visible in Figure 1a. Because the struts often have knee-like defects, they are expected to become progressively weaker when they are compressed. The force-length relation F(L) of the struts becomes progressively flatter when L is decreased or F increased. Therefore, the macroscopic lowering of K may be directly related to the lowering of the microscopic stiffness k = dF/dL of the individual struts.
It can be noted that the knee model of the struts does predict their collapse when the force is increased. Indeed, the change in length dL, resulting from an increase of the force dF, increases very rapidly for increasing values of F (see Figure 6a). In another model of the struts, Pirard et al. [4, 11] neglects the influence of the knees and suggests that the collapse of the pores be related to the buckling of the struts (Figure 6b). This geometrical approximation leads to a well defined value for the force at which buckling occurs FB. According to Euler’s
law, the critical force at which buckling occurs is related to the length L of the beam by FB ~
1/L2 [14]. One therefore expects that the pressure at which the porosity of a material collapses be inversely related to the size of its pores. This general conclusion is also expected to hold qualitatively for the knee model. In the ambit of Pirard’s buckling model, the quantitative relation is P~1/L4 [4, 11]. From the curves of Figure 4, it is clear that the yield pressure of the analyzed materials increases continuously from ET2.5 to ET20 and from RF5.8 to RF7.35, which is in qualitative agreement with the values of lP reported in Table 1.
In addition to the mechanism suggested by Gross et al. [13], the very collapse of the pores can explain the lowering of K of the ET samples upon compression. The change in density d
φ
of a sample upon increasing the pressure by a small amount dP can be written as:where d
φ
E is the elastic contribution and dφ
C is the contribution from the collapse of pores.Recalling the definition of the compression modulus, K =
φ
dP/dφ
, Eq. (1) can be written equivalently as:where the individual compression moduli were defined as KE/C =
φ
(dP/dφ)
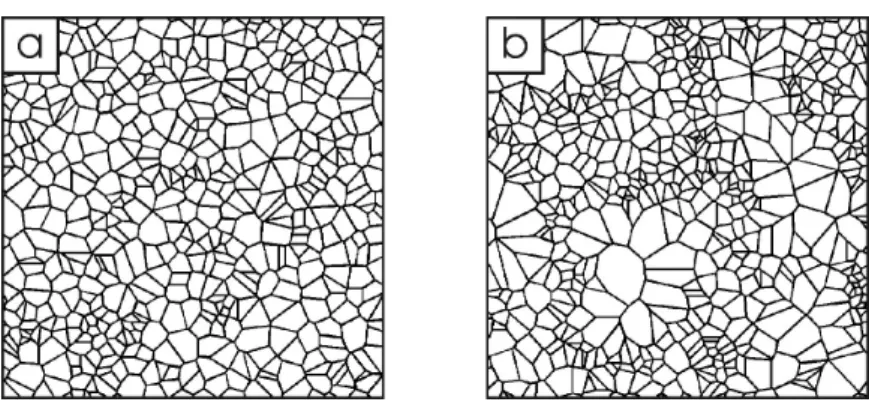
E/C. Thecompaction of a material which microstructure would be similar to that of Figure 7a, is expected to be the following. Since the length distribution of the struts is narrow, all the pores collapse at the same pressure, say PB. For P<PB, the struts are deformed elastically, and
according to Eq. (2), ones has K = KE. When P approaches PB, the largest pores begin to
collapse. Since the volume loss resulting from the collapse of a pore is much larger than any possible elastic deformation of the same pore, collapse can only lead to a lowering of K near
C E 1 1 1 K K K = + (2) C E
φ
φ
φ
d d d = + (1)Figure 6. Deformation of the struts that support the porous network of sol-gel materials, according (a) to Gross et al. [12] and (b) to Pirard et al. [4], and corresponding force-length relations F(L).
P = PB. For P>PB, there are no pores left to collapse and the crowding of the microstructures
is such that K increases again. This succession of events could easily explain the shape of the K vs.
φ
curve of sample ET20 (Figure 5). Furthermore, the fact that the minimum of K shifts towards lower values ofφ
and of P from ET20 to ET2.5 compares well with the size of the pores, lP, in these samples (Table 1).The collapse of the porosity cannot be responsible for the lowering of K in the RF samples, as for these samples it is initially not accompanied by any significant increase of
φ
(Figure 5b). In this case, the origin of the lowering of K lies in the heterogeneity of the samples. In a sample such as in Figure 7b, the largest struts that would buckle at low pressure are surrounded by denser regions of shorter struts. When the pressure exerted on the material increases, so does the load supported by each individual strut. The largest struts begin to buckle when their yield load is reached, but the collapse of the pores is prevented by the surrounding smaller pores. Since the load supported by a buckled strut remains constant and it cannot exceed FB (see Figure 6b), any subsequent increase in the pressure concentrates theadditional load in the not yet buckled shorter struts. The net effect of an increase in pressure is therefore to share the total load among a smaller number of structures without significantly reducing the volume, by which the macroscopic stiffness can only decrease. It should be stressed that a qualitatively similar conclusion could be reached with the knee model of the struts. The collapse of the porosity only occurs at pressures sufficiently high for the network of buckled structures to percolate throughout the macroscopic solid.
5. CONCLUSIONS
The texture of two series of silica and organic xerogels was analyzed by mercury porosimetry. The samples are mainly compressed but not intruded by mercury in the porosimeter, and the information obtained is therefore purely mechanical. A textural information can however be extracted from the data by analyzing the way in which a given microstructure should resist a compressive stress.
In the case of the analyzed silica xerogels, the lowering of the stiffness when some samples are compressed can be interpreted as the collapse of a homogeneous porosity. In the case of the organic xerogels, the lowering of K stems from the buckling of the microstructures of the materials without any significant collapse, which is likely to occur only for heterogeneous samples.
Figure 7. Pictorial examples of materials whose porosity is supported by elongated struts and whose microstructure is (a) homogeneous or (b) heterogeneous at a scale much larger than the struts.
Acknowledgements It is a pleasure for the authors to acknowledge stimulating discussions with Dr. René Pirard of the University of Liège. C.J. Gommes is grateful to the National Funds for Scientific Research (FNRS, Belgium) for a Ph.D. research fellow position. The authors thank the Ministère de la Région Wallonne (DGTRE) and the Ministère de la Communauté Française de Belgique (Action de recherche concertée 00/05-265) for their financial support.
REFERENCES
[1] K. Kaneko, J. Membrane Sci. 96 (1994) 59.
[2] H.A. Barnes, J.F. Hutton, K. Walters, An Introduction to Rheology, Elsevier: Amsterdam, 1989, Chap 6.
[3] G.W. Scherer, D.M. Smith, X. Qiu, J.M. Anderson, J. Non-Cryst Solids 194 (1996) 283. [4] R. Pirard, S. Blacher, F. Brouers, J.-P. Pirard, J. Mater. Res. 10 (1995) 2114.
[5] A.P. Roberts, E.J. Garboczi, J. Mech. Phys. Solids 50 (2002) 33. [6] A.A. Potanin, W.B. Russel, Phys. Rev. E 53 (1996) 3702. [7] R. Botet, B. Cabane, Phys. Rev. E 70 (2004) 031403.
[8] C. Gommes, S. Blacher, B. Goderis, R. Pirard, B. Heinrichs, C. Alié, J.-P. Pirard, J. Phys. Chem. B 108 (2004) 8983.
[9] N. Job, R. Pirard, J. Marien, J.-P. Pirard, Carbon, 42 (2004) 619.
[10] C.J. Gommes, S. Blacher, M. Basiura, B. Goderis, J.-P. Pirard, Chem. Mat. submitted for publication.
[11] R. Pirard, C. Alié, J;-P. Pirard, Handbook of Sol-Gel Technology, In Characterization of Sol-Gel Materials and Products, Sakka, S. Ed.; Kluwer: Boston, 2005; Vol 2, pp 211-33. [12] G.M. Channel, K.T. Miller, C.F. Zukoski, AIChE J. 46 (2000) 72.
[13] J. Gross, J. Fricke, R.W. Pekala, L.W. Hrubesh, Phys. Rev. B 45 (1992) 12774. [14] L.D. Landau, E.M. Lifshiftz, Theory of Elasticity, Butterworth-Heinemann, 1986.