HAL Id: tel-01899752
https://pastel.archives-ouvertes.fr/tel-01899752
Submitted on 19 Oct 2018HAL is a multi-disciplinary open access archive for the deposit and dissemination of sci-entific research documents, whether they are pub-lished or not. The documents may come from teaching and research institutions in France or abroad, or from public or private research centers.
L’archive ouverte pluridisciplinaire HAL, est destinée au dépôt et à la diffusion de documents scientifiques de niveau recherche, publiés ou non, émanant des établissements d’enseignement et de recherche français ou étrangers, des laboratoires publics ou privés.
Optimization of the planning and operations of electric
distribution grids in the context of high renewable
energy penetration
Etta Grover Silva
To cite this version:
Etta Grover Silva. Optimization of the planning and operations of electric distribution grids in the context of high renewable energy penetration. Electric power. Université Paris sciences et lettres, 2017. English. �NNT : 2017PSLEM074�. �tel-01899752�
THÈSE DE DOCTORAT
de l’Université de recherche Paris Sciences et Lettres
PSL Research University
Préparée à MINES ParisTech
Optimisation de la planification et l’opération du réseau de distribution
dans le contexte d’une forte pénétration des énergies renouvelables
École doctorale n
o432
SCIENCES ET MÉTIERS DE L’INGÉNIEUR
Spécialité
ÉNERGÉTIQUE ET PROCÉDÉSSoutenue par
Etta Grover-Silva
le 14 décembre 2017
Dirigée par
Georges Kariniotakis
and
Robin Girard
COMPOSITION DU JURY :
Mme Manuela Sechilariu UTC, Présidente
M Benoît Robyns HEI Lille, Rapporteur M Anastasios Bakirtzis AUTH, Rapporteur M Raphael Caire
Grenoble INP ENSE3, G2Elab, Rapporteur M Miguel Heleno
LBNL, Examinateur M Damien Picault ENEDIS, Examinateur M Georges Kariniotakis
MINES ParisTech, Examinateur M Robin Girard
Contents
1 Introduction 15
1.1 Summary . . . 16
1.2 The energy transition context . . . 18
1.3 The electric power system . . . 20
1.3.1 The electric distribution system . . . 21
1.4 Planning strategies for distribution systems . . . 22
1.4.1 Increasing demand - new clients and evolution of existing clients . . . 23
1.4.2 Integration of decentralized generation . . . 23
1.4.3 Mathematical tools for distribution grid planning with DER . . . 25
1.5 Challenges of decentralized energy resources . . . 26
1.5.1 Increased or bi-directional current . . . 27
1.5.2 Voltage regulation devices . . . 28
1.6 Innovative smart grid solutions . . . 28
1.6.1 Storage . . . 29
1.6.2 Demand side management . . . 29
1.6.3 Curtailment . . . 29
1.7 OPF analysis for planning tools . . . 30
1.8 Thesis work objectives . . . 31
2 Low voltage unbalanced distribution networks 33 2.1 Summary . . . 33
2.2 Introduction . . . 34
2.3 Single-phase and three-phase unbalanced systems . . . 35
2.3.1 Single-phase power flow formulation . . . 35
2.3.2 Unbalanced power flow formulation . . . 35
2.3.3 Simplification of high dimensionality . . . 38
2.3.4 Case study . . . 39
2.3.5 Results . . . 39
2.4 OPF multi-phase unbalanced algorithms . . . 44
2.4.1 Existing algorithms literature review . . . 44
2.4.2 Implemented algorithms . . . 45
2.5 Conclusion . . . 45
3 Planning methodologies for smart grids 47 3.1 Summary . . . 47
3.2 Introduction . . . 48 1
2 CONTENTS
3.3 Multi-temporal OPF for hosting capacity analysis . . . 50
3.3.1 Power flow model . . . 50
3.3.2 SOCP optimum power flow formulation . . . 51
3.3.3 Case study . . . 52
3.3.4 Results . . . 53
3.3.5 Discussion . . . 54
3.4 Optimal placement and sizing of storage devices . . . 55
3.4.1 Optimal power flow model . . . 55
3.4.2 Variations of the objective function . . . 56
3.4.3 Results . . . 58
3.4.4 Discussion . . . 65
3.5 Conclusion . . . 66
4 OPF analysis considering uncertainties 67 4.1 Summary . . . 68
4.2 Introduction . . . 68
4.3 Stochastic OPF for day-ahead scheduling . . . 69
4.3.1 Scenario representation in an OPF . . . 70
4.3.2 Scenario generation techniques . . . 72
4.3.3 Demand side management of thermal loads . . . 72
4.4 Proposed stochastic optimal power flow method . . . 73
4.4.1 Method overview . . . 73
4.4.2 Formulation . . . 74
4.4.3 Performance evaluation of deterministic vs stochastic strategy . . . 77
4.5 Case study . . . 77
4.5.1 Generation and Load Data . . . 77
4.6 Results . . . 78
4.6.1 Probabilistic forecasts . . . 79
4.6.2 Multivariate covariance forecasts . . . 79
4.6.3 Annual operational cost benefit . . . 81
4.7 Conclusion . . . 88
5 Conclusions 91 5.1 Conclusions . . . 91
5.2 Future work . . . 93
List of Tables
2.1 Feeder characteristics of network 20 [1] . . . 39
2.2 Feeder 3 electrical characteristics . . . 39
2.3 Simplified feeder 3 electrical characteristics . . . 42
3.1 For a given amount of coupled time steps, the calculation time in seconds . . . . 54
3.2 Operation of electrical feeder with and without battery integration. Annual anal-ysis for the case of 85 e/MWh-day . . . 65
3.3 Calculation time for daily and annual analysis . . . 65
4.1 Control variables, scenario dependent variables and stochastic variables . . . 77
4.2 UL, CL and DER characteristics per node . . . 79
4.3 Case study labels . . . 79
4.4 Algorithmic performance of deterministic and stochastic methods for 24 coupled time-steps . . . 88
List of Figures
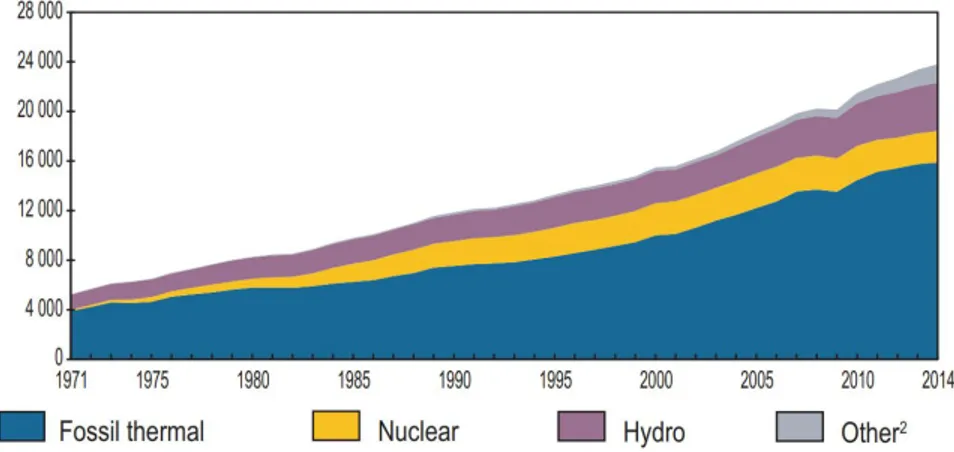
1.1 Introduction outline . . . 18 1.2 World electricity generation by fuel from 1971 to 2014 in TWh published by IEA 19 1.3 Electricity produced in France by source in TWh from 1970 to 2015 [2] . . . 19 1.4 Grid components and voltage levels of an example transmission and distribution
network [3] . . . 21 1.5 Annual domestic electricity demand in mainland France at reference temperatures 24 1.6 Forecast trend in supply in France between 2016-2021 . . . 24 1.7 Regional plans for the climate, air and energy (RPCAE) renewable energy targets
for mainland France . . . 25 1.8 Hypothesis used by the French DSO for medium voltage and low voltage
distri-bution systems planning studies [4] . . . 27 1.9 Thesis document outline and main contributions . . . 32 2.1 Passive node examples indicated by a blue "P" and active node examples indicated
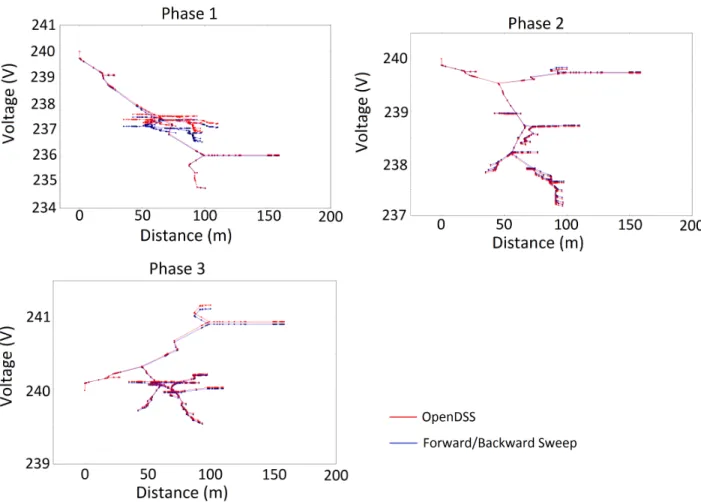
by a red "A" . . . 39 2.2 Low voltage network used in the case study . . . 40 2.3 Comparison of OpenDSS and load flow calculations using a forward backward
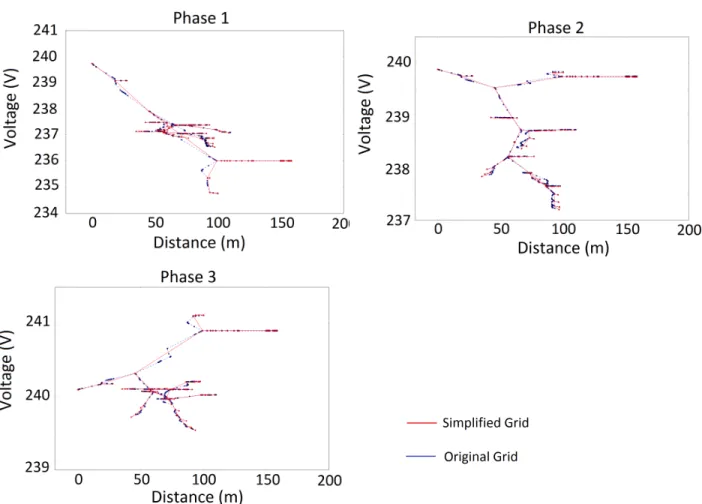
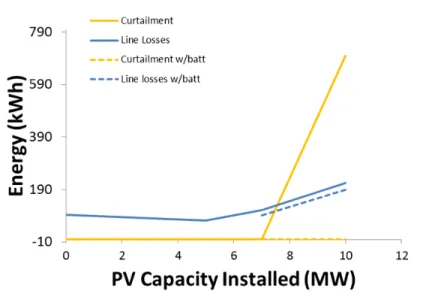
sweep and eqs. (2.1), (2.2) and (2.16) . . . 41 2.4 Comparison of simplified grid load flow calculation with original one . . . 43 2.5 Comparison of three-phase unbalanced and single-phase load flow calculation . . 44 3.1 Comparison of curtailment and line losses with and without battery systems
dur-ing a three-day period usdur-ing typical summer profiles . . . 53 3.2 Comparison imports and exports with and without batteries during a three-day
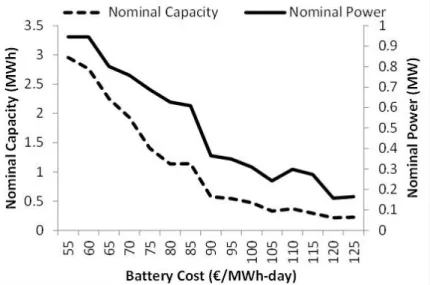
period using typical summer profiles . . . 54 3.3 Grid topology including low voltage substation (C) and PV system placement (PV) 59 3.4 Load characteristics for all loaded nodes . . . 60 3.5 PV nominal power ratings for each PV node . . . 60 3.6 Total aggregated nominal capacity and power optimal system size as a function
of battery costs . . . 61 3.7 Sensitivity analysis of PV penetration in relation to optimal aggregated nominal
power and capacity battery size for an investment cost of 85 e/MWh-day . . . . 62 3.8 Comparison of centralized and decentralized nominal power (P) and capacity (C)
optimal system size as a function of battery costs . . . 63 3.9 Calculated nominal power of battery systems for each node with battery prices
varying from 55 e/MWh-day to 95 e/MWh-day . . . 63 5
6 LIST OF FIGURES
3.10 Calculated nominal capacity of battery systems for each node with battery prices varying from 55 e/MWh-day to 95 e/MWh-day . . . 63 3.11 Calculated size of battery sizes for battery prices of 85e/MWh-day . . . 64 3.12 Final size of selected nodes with a battery cost of 85 e/MWh-day . . . 64 4.1 Scenario tree with "trunk" period between 0-5 and the branch region between 6-12 70 4.2 Scenario tree with "trunk" period for time step 0 and the branch region between
1-12 . . . 71 4.3 Sliding scenario tree formation to solve optimal scheduling problem . . . 71 4.4 Flow chart of proposed methodology to take into account uncertainties in
day-ahead operational scheduling of flexibilities . . . 74 4.5 Medium voltage IEEE 37 node case study feeder. C indicates a node with load,
PV + B indicates nodes with PV and batteries . . . 78 4.6 PV production quantiles 10 to 90 (left) and the selected high, low and middle
quantiles (25th, 75th and 50th) (right) with the real PV realization for the pre-diction day in red . . . 80 4.7 Uncontrollable load profile quantiles 10 to 90 (left) and the selected hig, low and
middle quantiles (25th, 75th and 50th) (right) with the real load profile realization for the prediction day in red . . . 80 4.8 Temperature profile quantiles 10 to 90 (left) and the selected high, low and middle
quantiles (25th, 75th and 50th) (right) with the real load profile realization for the prediction day in red . . . 81 4.9 PV production scenarios (left) and the selected high, low and middle scenarios
(right) with the real PV realization for the prediction day in red . . . 81 4.10 Load profile scenarios (left) and the selected high, low and middle scenarios (right)
with the real load profile realization for the prediction day in red . . . 82 4.11 Temperature profile scenarios (left) and the selected high, low and middle
scenar-ios (right) with the real temperature profile realization for the prediction day in red . . . 82 4.12 Annual costs of operation for the case with only batteries ("St No CL 2 S" and
"St No CL 4 S") and with additional flexibility from CL ("St w T 1e", "St w T 10 e", "St 2 S", "St C", "St PV" and "St 4 S") using probabilistic forecasts . . . . 84 4.13 Annual costs of operation for the case with only batteries ("St No CL 2 S" and
"St No CL 4 S") and with additional flexibility from CL ("St w T 1e", "St w T 10 e", "St 2 S", "St C", "St PV" and "St 4 S") using multivariate covariance forecasts 84 4.14 Example day where stochastic scheduling results in lower operational costs than
the deterministic one. From top to bottom, price of electricity (1), PV scenar-ios and real PV production (2), UL scenarscenar-ios and real UL (3), stochastic and deterministic battery schedule (4), stochastic and deterministic controllable load schedule (5). . . 86 4.15 Annual operational cost vs annual comfort constraint violations for the total
comfort constraint violations of AC and EWH using probabilistic forecasts . . . . 87 4.16 Annual operational cost vs annual comfort constraint violations for the total
Acknowledgements
Writing this dissertation has been a difficult but enlightening task. This experience has forced me to grow in many ways and I am grateful to have had the opportunity to pursue a subject that I am passionate about. Completing my PhD and writing the final document has taught me diligence, determination and endurance. This work was completed with the support of many people. I would first like to thank my family and close friends for encouraging me during the entire period of my PhD. More specifically my office colleagues were a constant source of encouragement for technical and emotional support. I would like to recognize my supervisor Robin Girard for following my work and providing feedback on the technical and scientific choices made during the PhD. I am very grateful for my thesis director George Kariniotakis who was not only there to support me for the technical decisions and guidance but also on a more personal level. He constantly was a support for more logistical and administrative matters as well as a mentor for a multitude of challenges. I would like to thank my aunt Abby to have helped with reading and correcting the final document. I would also like to recognize my significant other, Yoann for helping with the final document corrections but also supporting me throughout my thesis in many ways.
I would like to recognize and thank ADEME for supporting the PhD financially and specif-ically Patricia Sidat for taking the time to have meaningful discussions about my work. I am grateful to have participated in the SENSIBLE European project which also partially funded the PhD. I would also like to thank the Grid Integration Group at Lawrence Berkeley National Laboratory and more specifically Miguel Heleno for being a close supervisor and teaching me many things about being persistent, precise and rigorous. I would also like to extend my grati-tude to the MINES Foundation and the ELECTRA EERA Mobility program that allowed me to complete my collaboration in California with Berkeley Lab.
Nomenclature
Indices
+ a variable with a positive domain − a variable with a negative domain
0 indicating the substation point of common coupling 0 zero sequence impedance
γ scenario dependent variables
a phase a
ab relationship between phase a and phase b ac air conditioning (AC) systems
appx indicating an approximation of a previous formulation
b phase b
c phase c
cl cumulative controllable load at a specific node (CL) d individual controllable device
ec price of electricity
edc price of electricity plus transmission and distribution costs ef price of comfort constraint violations in euros per degree eq indicating an equivalent formulation
ewh electric water heater (EWH) systems ext external air temperature
H Hermitian matrix
Hac over heating in AC systems ij branch between nodes i and j
init indicating an initial value
inj the power injection at substation int internal building air temperature inv capital investment
j index for node j
Lac under heating in AC systems loss system losses
n neutral cable
N ac range of acceptable temperature for AC systems
nom indicating the nominal value characteristics of a system O&M operations and maintenance (O&M)
p positive sequence impedance
pv PV system
pvid PV maximum possible injection st storage system
t period of time
ul uncontrollable load (UL) wtr property of water
Parameters
αd Heat loss constant of the hot water heater tank thermal insulation η Efficiency of a device
Θ Maximum temperature allowable
Ppv,j,t Ideal PV production for node j at time step t Spv,j,t PV maximum apparent power flow at node j
V Maximum voltage
Θ Minimum temperature allowable
V Minimum voltage
c Cost value
Cd Thermal capacity of an individual device 10
Cwtr Thermal capacity of water Imb Imbalance of three-phase system Invmax Total capital cost limit of project LF Load factor of three-phase system
Pul,j,s,t Active power load at node j scenario s and time step t Qul,j,s,t Reactive power load at node j scenario s and time step t r Electrical resistance
Rd Thermal resistance of an individual device t Duration of time step
Tmax Transformer nominal power rating vt,d Electric hot water use in liters x Electrical reactance
y Electrical admittance
Z Impedance matrix associated with all phases z Impedance of a single-phase
Sets
J Set of all nodes within the network j ∈ J
K Set of all nodes within the network for desired analysis Variables
β difference in phase angles between the currents of two phases ` Square of current magnitude
φ current to voltage phase angle
Θ Temperature
θ voltage phase angle
υ Square of voltage magnitude
I Current including magnitude and phase
N The hours of autonomy at nominal rating for a battery system
P Active power
Q Reactive power
S Apparent power
soc Nominal capacity of a battery system V Voltage including magnitude and phase
Abbreviations
AC Alternating Current
ADN Active Distribution Network API Application Program Interface BFM Branch Flow Model
BIM Bus Injection Model CL Controllable Load
CRE Commission de Régulation de l’Énergie DER Distributed Energy Resources
DMS Distribution Management System DR Demand Response
DSM Demand Side Management DSO Distribution System Operator EDF Électricité de France
EWH Electric Water Heater GDP Gross Domestic Product
HVAC Heating Ventilation and Air Conditioning
INSEE Institut National de la Statistique et des Étude Économiques OLTC On-Load Tap Changer
OPF Optimal Power Flow
PDF Probability Density Function PV Photovoltaic
QCQP Quadratically Constrained Quadratic Program QP Quadradtic Programming
RMSE Root Mean Square Error
RTE Réseau de Transport d’Électricité SDP Semi-Definite Program
SOC State of Charge
SOCP Second-Order Cone Programming UL Uncontrollable Load
Chapter 1
Introduction
Résumé
L’électricité est devenue critique dans le monde pour améliorer l’économie, la santé et la sécurité d’un pays. Actuellement, la production de cette électricité pour le monde entier est principale-ment basee sur les ressources fossiles. Les ressources fossiles sont à présent critiquées pour leur durabilité et leur impact sur l’environnement. S’il faut diminuer la consommation des ressources fossiles, il faut développer autres technologies pour fournir une électricité de qualité pour l’avenir. Cette transition des ressources fossiles aux nouvelles technologies non polluantes est souvent ap-pelée la transition énergétique. Cette transition peut apparaître comme une mission colossale mais une transition énergétique à déjà eu lieu en France. Cette transition a impliqué un passage des ressources fossiles aux ressources nucléaires et a été effectué entre les années 1971 et 2001. Les leçons à retenir de cette expérience sont importantes pour réussir la transition vers les én-ergies renouvelables. La différence principale de ces deux transitions est le passage d’un modèle centralisé à un modèle décentralisé. Cette évolution vers un modèle décentralisé implique une rénovation significative du réseau de distribution. Une possibilité pour cette transformation est de modifier le système actuel passif en un système actif pour optimiser l’infrastructure actuelle. Le Smart Grid est un réseau qui est adapté vers un réseau contrôlable et automatisé. Pour réussir cette transformation, le système actuel sera étudié.
Le système électrique actuel est composé de deux réseaux: le réseau de transport et le réseau de distribution. Ces deux systèmes sont connectés pour créer le système électrique. Ces systèmes utilisent plusieurs niveaux de tension et transformateurs pour amener l’électricité depuis des générateurs centralisés jusqu’aux consommateurs finaux. Ainsi que ce système est efficace, mais il est aussi cher à construire et à maintenir. Ce modèle centralisé est efficace pour fournir une grande quantité de clients en minimisant les coûts d’opération. Le réseau de basse tension est le point de connexion pour une majorité des clients. De ce fait, la qualité de puissance du réseau de basse tension est importante pour satisfaire les consommateurs finaux.
La planification opérationnelle du réseau de distribution est une tâche complexe. Les dé-cisions prises aujourd’hui peuvent avoir des effets sur le long terme et déterminer l’utilisation possible de ces réseaux dans l’avenir. Les investissements, principalement gérés par les opéra-teurs du réseau de distribution, sont classifiés en deux catégories: la gestion des déffaillances des équipements et les investissements de préventifs. Cette thèse focalise plutôt sur les in-vestissements préventifs notamment les inin-vestissements d’adaptation du réseau de distribution actuel pour un fonctionnement plus intelligent. Toutefois, ces investissements sont difficiles à
16 CHAPTER 1. INTRODUCTION
hiérarchiser du au fait qu’il existe des incertitudes sur l’évolution de la consommation, la péné-tration des générateurs décentralisés et l’évolution de la technologie en général. Un besoin existe pour adapter les réseaux passifs existants afin d’être plus actifs. Cette transformation permettra l’augmentation de la pénétration des générateurs décentralisés tout en évitant des renforcements coûteux du réseau électrique.
L’intégration des générateurs décentralisés sur le réseau de distribution peut amener de nouvelles difficultés par exemple le flux de puissance bi-directionels, une déviation du profil de tension et des problèmes de congestion. Ces difficultés peuvent influencer les appareils existants par exemple les régulateurs de tension. De plus, les générateurs décentralisés peuvent être connectés par des acteurs différents qui ont des priorités autre que la qualité de puissance du réseau électrique. Ces installations peuvent contribuer aux problèmes de la qualité de fourniture du réseau électrique et par conséquent augmenter le coût d’opération pour l’opérateur du réseau. Ces difficultés amènent de nouvelles problématiques pour les opérateurs du réseau électrique.
Ces nouvelles difficultés amènent la planification à prendre en compte des solutions intel-ligentes comme décrites par différents pays. Cette évolution est principalement conduite avec l’objectif d’augmenter la pénétration des énergies renouvelables tout en évitant les investisse-ments coûteux de renforcement du réseau. La stratégie principale implique l’exploitation des flexibilités du réseau de distribution. Plus précisément, cette thèse va explorer trois sources de flexibilité : le stockage, la gestion de la demande et le dispatch down. Pour hiérarchiser ces flexibilités, de nouveaux outils de planification et gestion sont nécessaires.
Les études de flux de puissance optimal sont une possibilité pour l’analyse du réseau intelli-gent. Ce type d’étude est focalisé sur flux de puissance active et réactive pour minimiser le coût d’opération d’un réseau intelligent. Cet outil est efficace pour la planification et la gestion des réseaux avec des composants actifs et contrôlables. Les charactéristiques du réseau de distribu-tion impliquent l’utilisadistribu-tion des équadistribu-tions de courant alternatif pour réussir des analyses précises. Ces équations ne peuvent pas être directement intégrées dans un algorithme d’optimisation con-vexe mais, il existe plusieurs stratégies pour les prendre en considération. Cette thèse fait un focus sur les techniques de relaxation convexe pour la résolution optimale de ces problèmes mathématiques. Les algorithmes développés dans cette thèse s’adressent principalement à la problématique de planification et de la gestion du réseau électrique intelligent.
De nouvelles méthodologies de planification et de la gestion sont applicables pour les réseaux électriques avec une forte pénétration des énergies renouvelables et la possibilité de contrôle. Ces méthodologies considèrent les coûts d’investissement, les stratégies d’opération et les incertitudes pour la gestion du réseau afin de hiérarchiser les investissements. L’intégration des générateurs décentralisés grâce aux outils d’optimisation peut diminuer les coûts d’opération et réduire la production de déchets. Avec des incertitudes élevés concernant la production électrique des énergies renouvelables, la gestion optimal de ces ressources est difficile. Toutefois, il existe des techniques pour une gestion robuste qui considère les incertitudes de la consommation et la production. Les détails de l’organisation de l’introduction sont présentés dans la Fig. 1.1.
1.1
Summary
Electricity is a critical element in society to improve health, safety and the economy around the world. Currently, fossil fuels are the primary source of the majority of electricity consumed in the world. This primary source has recently been questioned for its sustainability and longevity. In order to guarantee a future with easy access to high quality electricity, an energy transition
1.1. SUMMARY 17
from fossil fuels to new renewable sources is necessary. In the past, specifically in France, a successful energy transition has already come about. This transition was from fossil fuels to nuclear power achieved between 1971 and 2001. Lessons learned from this past energy transition can be helpful for the success of the current energy transition. The primary difference of the current energy transition is the focus on decentralization as opposed to a more centralized model. This shift from centralized to decentralized production will require a significant adaptation of the distribution network. This adaptation implies the transformation of a passive distribution system to an active controllable system. A distribution network that is an active distribution network (ADN) can also be referred to as a smart grid. For this successful adaptation from passive to active electrical networks, it is important to understand the existing infrastructure and architecture.
The current electric power system is composed of a transmission system and a distribution system. These two systems combined create an interconnected system with varying levels of voltage and varying configurations. This sophisticated infrastructure is expensive and time con-suming to develop. However, this architecture is a cost-effective model to provide electricity to a substantial number of clients (e.g. all citizens of a country). The low voltage distribution grid is the connecting point for a majority of industrial and residential clients. Therefore, guaranteeing the power quality at the end-user connection point is important for end-user satisfaction.
The planning for investment decisions resulting in the evolution of the distribution grid are multifaceted, long lasting and have a significant impact on the end-user experience. Distribution system operators’ (DSO) investment decisions fall into two main categories: failure management and preventative investments. This thesis will focus primarily on preventative investments including the opportunity to adapt the existing architecture allowing new functionality. However, these investments are challenging due to uncertainties in the future evolution of load, generation and technology. The need for an adaptation of the distribution grid from a passive to an active network is primarily driven by the introduction of distributed energy resources (DER).
DER can create bi-directional flow, voltage deviation and congestion problems in the dis-tribution grid. These new challenges can affect existing grid regulation devices which may not be capable of regulating voltage. Furthermore, DER may be connected by various stakeholders that are not responsible for guaranteeing power quality in the distribution grid. This could possibly increase costs for the distribution system operator (DSO) indirectly. Therefore, DSO are faced with a challenging new environment in relation to operations and planning of future distribution grids.
In order for DSO to plan for more intelligent distribution grid systems, smart grid develop-ment goals have been defined by various countries. This evolution is primarily driven by the goal of increasing DER integration and deferring infrastructure investments. The key to this new era of smart grid operations and planning is to optimize the available flexibilities of the distribution grid. Specifically, this thesis will explore three sources of flexibility: storage, de-mand side management (DSM) and curtailment. In order to perform techno-economic analysis of distribution grid flexibility, sophisticated planning and operations tools are necessary.
OPF is a class of optimization problems where active and reactive power of devices con-nected to the distribution grid can be optimized to minimize a cost function under power flow constraints. It is an appropriate tool to model the operation and planning of distribution systems that contain active elements. Due to the specificity of the distribution network characteristics, alternating current (AC) OPF is the most appropriate method. An AC OPF problem requires sophisticated techniques for its resolution, however these techniques are well documented in the
18 CHAPTER 1. INTRODUCTION
Figure 1.1: Introduction outline
literature. In this thesis, the problem resolution technique of convex relaxations has been cho-sen to guarantee a low calculation burden and optimal solutions. This thesis will focus on the development of operations and planning methodologies to address new challenges in planning and operations for smart grids.
These new planning methodologies and operational strategies will consider decentralized controllable devices such as storage, DSM and curtailment. They will consider investment costs, operational strategies and uncertainties to prioritize smart grid investments. The integration of DER along with the optimization of grid operations could result in lower maintenance costs and fewer waste products. Due to a high degree of uncertainty in renewable energy generator production, optimal management of decentralized components is difficult. Robust management strategies that consider these uncertainties in load profiles and decentralized production are critical. A figure summarizing the contents in this chapter can be found in Fig. 1.1.
1.2
The energy transition context
The discussion encompassing a future with easy access to high quality electricity is economically and culturally complex, as well as highly technical. A new mix of technologies will be necessary to satisfy an increasing demand and uncertain availability of future resources. With new tech-nologies, new technical, political and cultural challenges arise. This new transformation of the future energy outlook plan is commonly referred to as the energy transition.
Energy and more specifically electricity is an essential part of developed countries daily activity. Once reserved only for the rich, electricity is now accessible by 83 % of the global population as sited by IEA [2]. Since electricity was invented, the GDP and wealth of a country has been closely connected to the availability and quality of the electricity. This has driven countries worldwide to invest in the development of the power transmission and distribution systems. Due to these investments, power systems expanded from small microgrids to intercon-nected transcontinental networks. The transit of energy from a centralized power plant down to individual customers became the most cost-effective solution.
The high dependency of modern society on electricity sheds light on the importance of guaranteeing the primary sources of electricity production. Over the past decades, the source of electricity production has evolved. As seen in Fig. 1.2, a continual increase in fossil fuels as well as nuclear electricity production is seen between 1971 and 2014. Increasing concerns about the sustainability of fossil fuels is a part of the driving forces of the recent energy transition.
1.2. THE ENERGY TRANSITION CONTEXT 19
Figure 1.2: World electricity generation by fuel from 1971 to 2014 in TWh published by IEA
Figure 1.3: Electricity produced in France by source in TWh from 1970 to 2015 [2]
The current concern of stakeholders in electricity markets is to find a strategy of sustainable development that is dependent on renewable primary energy sources while guaranteeing power quality and security of supply in the future.
The energy transition from "traditional" resources to renewable ones is not the first energy transition in the history of the industrialized world. The first major energy transition was initiated by the discovery of fossil fuels in the 1700s. This transition took two centuries and, by the 19th century, fossil fuels became the primary global energy source. In 1973, oil accounted for 70 % of the total primary energy used to produce electricity in France. However, due to various oil embargoes and the growing concern of dependence on Middle Eastern countries’ oil production, France invested in a new electricity production technology, nuclear. Between 1971 and 2001, 58 nuclear reactors were built in France. By 2015, a large percentage of the electricity produced in France resulted from nuclear generators as seen in Fig. 1.3. This figure shows the source energy mix of electricity production in France between 1970 and 2015. In the 2009 IEA report, it was reported that the French government had achieved their goal to produce at least 50 % of the electricity used domestically [2] therefore succeeding in their initial goals driving the energy transition started in the 1970s.
This massive development of nuclear power between 1971 and 2001 was primarily driven by EDF as well as substantial subsidies [5]. France had a desire to "create a distinct role for itself in the two decades following World War II". Involved actors started work to enable the
trans-20 CHAPTER 1. INTRODUCTION
formation into an "all-electric all-nuclear" society and therefore successfully transitioned their electricity production strategy in a period of 30 years. The major energy transition in France to nuclear was reinforced by strong government policy, large subsidies and a strong desire to revitalize France as a powerful world leader. Lessons learned from past major energy transitions included: "a stated ambition for an energy transition is not enough; energy alternatives have to be nurtured through a combination of research and technology development as well as deploy-ment policies over a sustained period; nationalistic sentideploy-ments and centralized power appear to be important for marshaling resources in a sustained way; the existence of new types of energy firms and jobs can help governments to stay committed and focused; and the relative costs of new energy technologies also must develop favorably" [6]. These lessons learned can be helpful to ensure the success of the current energy transition.
Similar mechanisms have been put in place for the current energy transition. These mecha-nisms include subsidies, as well as policy and research funded by the European Union to encour-age the development of decentralized generator technologies and their integration into the grid. The current energy transition resembles the previous energy transition in the fact that subsidies are available for the development of new technologies. A notable difference between the two transitions is the focus on decentralized generation as opposed to centralized generation. The integration of new decentralized generators imply a significant development of the distribution grid.
The renovation of the current distribution grid requires a passive system to be evolved into an active system with automation and control. This new active distribution system is often referred to as a smart grid. A smart grid as defined by the CEN-CENELEC-ETSI standards is an electricity network that can integrate, in a cost-efficient manner, the behavior and actions of all users connected to it (generators and/or consumers). This behavioral control ensures an economically efficient, sustainable power system with high levels of quality and security of supply and safety [7]. The next large-scale energy transition is currently emerging often associated in the literature with the term smart grid.
1.3
The electric power system
The development of an electric power system is expensive and time consuming. For example, the full development of the electric power system in France has been an ongoing task for the past hundred years. The three steps of development of an electrical power system include the initial electrification, the expansion of the system to supply a desired quantity of end-users and finally the quality assurance of the delivered electricity. In France this evolution began between 1880-1990 with the first industrial clients. The electric distribution grid was later labeled as a public service in 1906 when the development of distribution grids started to be present in large cities and densely populated areas. At this point, a majority of electricity was generated and used locally with few interconnections between cities. In 1938, the French government pushed to develop interconnections between existing distribution grids. EDF was created in 1946 to unite all the small private power producers into one entity and move towards a more standardized service of electricity in France. In the 1970s, EDF successfully interconnected an electric power system that reached almost all French citizens except individuals in very rural areas [8]. The connection of a majority of French citizens to the electric grid conveniently was completed just before the beginning of the development of centralized nuclear power plants as the primary electric generation source in France.
1.3. THE ELECTRIC POWER SYSTEM 21
Figure 1.4: Grid components and voltage levels of an example transmission and distribution network [3]
The current architecture of the electric power system contains two primary electric grid structures: the transmission system and the distribution system. These two systems are con-nected and interact to transit electricity from primarily centralized producers to end-use clients. Therefore, the classical distribution grid is mono-directional which has encouraged a majority of distribution grids to be operated with a radial configuration.
The primary objectives of the transmission and distribution system is to transit electricity from the producer to the end consumer while maintaining power quality, minimizing losses and minimizing operational costs. To achieve this goal multiple levels of voltage are used in the transportation and distribution system to minimize losses and improve end-user power quality. Transformers are used at various stages to step down voltages to a level accessible for industrial, commercial and residential customers. A schematic of the transmission and distribution system and the connection of the two is found in Fig. 1.4. The transmission system is connected to a high voltage partitioning of lines that then are converted to medium voltage through transformers connected to industrial clients. Another transformer is used to lower the voltage to the low voltage distribution level that most commercial and residential customers are connected to [3]. The distribution system is represented by the bottom half of Fig. 1.4 highlighted in yellow. The current distribution grids were designed to distribute energy with a mono-directional flow of power from a substation to end-use customers.
1.3.1 The electric distribution system
The electric distribution system is the lower voltage system that a majority of end-use customers are connected to. Two voltage levels exist in a distribution system: medium voltage and low voltage. Two important technical specifications of a distribution system are the number of phases and voltage levels. In France, the medium voltage distribution grid ranges from 3 to 33 kV. The low voltage distribution system ranges between 110 and 600 V with the standard connection voltage of most customers being 230 V. Unlike the medium voltage distribution grid, the low voltage distribution grid can have single-phase clients. The low voltage distribution grid
22 CHAPTER 1. INTRODUCTION
is composed of three-phase systems that are connected to one-phase or three-phase end-user clients. The connection of a single-phase client to one phase and a different client to another phase of the three-phase system can create unbalanced loading scenarios. Therefore, low voltage grids often experience imbalances between phases of a three-phase system. Depending on the load profiles of varying clients, imbalances in the system can be more or less elevated.
Residential and commercial customers can use electricity at any time of the day. In France, there are 31.6 million residential customers and 4.9 million commercial customers [9]. Clients subscribe to a maximum power usage and then pay by kWh their total energy use. The end use quality of the power delivered by the DSO is required by legislation in France to be +-5 percent for the medium voltage distribution grid [10] norm C13-200 and +-10 percent for the low voltage distribution grid [10] norm C15-100. This implies that a client has very few limitations, besides the maximum power value, on how much energy and which periods of the day the client is allowed to use energy. The distribution grid operator then is responsible to balance the electric production and consumption that is required to cover the load at the lowest possible cost.
1.4
Planning strategies for distribution systems
The investment strategy of a country in relation to the electric distribution system can signifi-cantly affect the experience of end-users and the future development of smart grid functionality. These investment decisions are often expensive and are long-lived. Investments in electrical lines, transformers, or security equipment could last from 2 to more than 40 years. The planning strat-egy often must find an investment schedule considering for example the current investment price, the life span of the investment, the timing of the proposed investment in relation to the long-term investment strategy, risk assessment of aging material, time of implementation and attempting to prepare for future possible new uses of the distribution grid. The planning strategy must take these considerations into account to find the optimal economic strategy.
The distribution grid investment strategy of the French DSO is managed by Enedis which is funded by a user tariff (Tarif d’Utilisation des Réseaux Publics d’Electricité) proposed by the CRE and approved by the government. The investment choices of Enedis must satisfy power quality and safety regulations while minimizing the environmental impact and the final cost to the society. The main axis pursued for the maintenance and expansion of the current electric grid include: resolution of specific technical problem, long term architecture planning, required annual investments including new customer connections or replacement of broken components and future environmental concerns that require the reduction of CO2 emissions [4]. These
planning goals lead to two main categories of infrastructure investments: failure management and preventative investments that reduce future failures, improve the quality, or reduce the cost of service. This thesis will focus primarily on preventative investment planning that addresses increasing load and grid adaptation to encourage renewable energy integration.
Preventative investments are difficult to calculate due to high uncertainty in future failures or power quality issues, new strategies or technologies that have not been extensively tested, the evolution of load profiles and the future penetration of decentralized generators. For the testing and validation of new innovative solutions, numerous test platforms and demonstration projects have been developed [11, 12, 13]. These projects attempt to analyze and validate the cost benefits of innovative technologies that may facilitate grid operations, improve system efficiency and increase the penetration of renewable energy systems. Pilot projects can be expensive and time consuming. Therefore, mathematical modeling is also used for techno-economic analysis of
1.4. PLANNING STRATEGIES FOR DISTRIBUTION SYSTEMS 23
network renovations.
1.4.1 Increasing demand - new clients and evolution of existing clients
For new customer connections or the evolution of the maximum power subscribed by a client, studies addressing existing line capacity are necessary. These studies are often power flow cal-culations for worst-case scenarios, in order to minimize risks. The recent evolution of electric meters allows for a more detailed data collection of client consumption. The new more sophis-ticated metering devices allow for an increased controllability of appliances and the possibility to connect small decentralized generators with associated tariff schemes. This large push to renovate electric meters has significantly increased the observability and the possibility of con-trollability in the low voltage distribution grid. However, the exploitation of the concon-trollability is not yet widely implemented. These new smart meters allow for the more precise analysis and optimization of existing architecture to avoid unnecessary costly infrastructure investments [14]. The evolution of the distribution grid is also dependent on the trends of electric demand country wide. For this reason, it is important to address briefly the analysis of RTE which is more specifically related to the transmission grid but has direct effects on the evolution of the distribution grid.
The evolution of the demand for electricity varies for each country based on political strategy, cultural context, climate conditions, etc. Specifically, in France, there are varying scenarios for future electric demand as published by RTE [15]. Fig. 1.5 shows three primary trends of total electric consumption for the three main energy sectors: residential, industrial and commercial. These three scenarios are developed from detailed analysis of historical data and current trends in all three sectors. The primary influence creating three possible demand scenarios is based on three key unknown factors: i) energy efficiency of future appliances, ii) new end-user appliances deployment such as EVs or the switching between energy sources such as replacing an oil boiler with a heat pump, and iii) unknown increase in population therefore increasing housing density and economic activity.
As seen in Fig. 1.5 the dotted line represents RTE’s plan for electric generation to have sufficient energy to meet the load requirements. For two out of three scenarios, the projected generation in relation to the projected demand increases in the next 4 years.
1.4.2 Integration of decentralized generation
The current procedure of Enedis to connect decentralized generators includes verification of short circuit security, harmonics produced by generator, perturbations of the communication system with safety components, flicker in voltage profile, maximum line capacity study, and indicating a set maximum possible current injected by the generator. These regulations force the DSO to often reinforce existing lines when installing new generators or creating new separate lines specifically for the generator [14]. The overall goals of France for the energy balance objectives in relation to the transmission grid is important to understand the possible effects on the distribution grid.
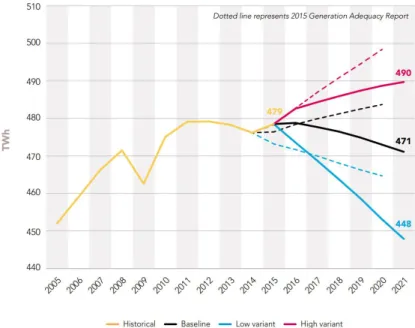
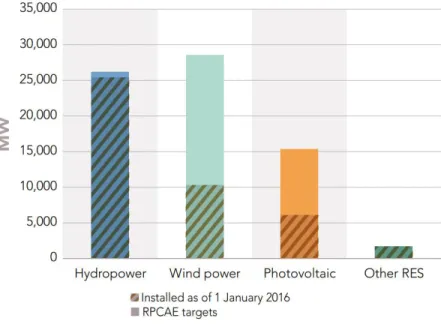
The energy production in France as stated by RTE will most likely have an increasing trend to match the increasing trend of load. In RTE’s adequacy report [15], the evolution of renewable energy, nuclear power and fossil fired plants is discussed. Fig. 1.6 shows the evolution of supplied energy for each technology to meet an increasing demand in the high-need scenario and a constant demand in the low-need scenario. More specifically, Fig. 1.7 shows the renewable
24 CHAPTER 1. INTRODUCTION
Figure 1.5: Annual domestic electricity demand in mainland France at reference temperatures
1.4. PLANNING STRATEGIES FOR DISTRIBUTION SYSTEMS 25
Figure 1.7: Regional plans for the climate, air and energy (RPCAE) renewable energy targets for mainland France
energy development targets in France for the next 5 years (2016 to 2021).
1.4.3 Mathematical tools for distribution grid planning with DER
There are two main groups of mathematical tools that exist for distribution grid planning. These tools include the tools that are actually used by current DSO and the proposed more innovative tools that exist in academic literature. The current tools used by the DSO include different techno-economic indicators to evaluate investment choices. For example, in France, these in-dicators include return on investment, rate of return or discounted benefit as described in [3]. Mathematical modeling tools such as power flow analysis are also used to give insights into the behavior or expected operation of a distribution grid. The presence of new decentralized gener-ators, can significantly affect the voltage profile of a distribution grid. Therefore, detailed power flow models are necessary to quantify these effects for intelligent planning of these generators. Current assumptions for power flow analysis used by the French DSO can be found in Fig. 1.8. Often these power flow studies use simplifications of grid operations and single time step anal-ysis. Existing power flow algorithms include the forward/backward sweep, Newton Raphson method [16, 17], fast-decoupled load-flow method [18, 19], z-bus matrix construction method [20], and loop impedance method [21, 22]. A power flow calculation is capable of calculating the currents and losses in all the branches (lines, cables, and transformers), the voltage in load buses, the reactive power in generator buses and the active and reactive power in the slack bus (primary substation in a distribution grid). This method gives full detail of the electric system for a given instance.
Power flow analysis is effective for certain grid analysis studies, but in the context of an ADN, power flow analysis is incapable of optimally managing controllable devices. More adapted methodologies that exist for ADN in the literature include OPF analysis. OPF analysis is not very commonly used in distribution grid planning. In contrast to a power flow analysis, an OPF
26 CHAPTER 1. INTRODUCTION
algorithm is capable of performing multi-period analysis. A multi-period analysis is important when temporally dependent variables such as storage are present. An OPF can also take into account the bounds of each variable including voltage and current limits of a network and generator power limits. Therefore, the OPF is more appropriate for smart grid analysis.
Many OPF algorithms are proposed in the literature for power systems applications as described in [23]. These algorithms are grouped into three main categories: DC approximations, non-linear convex approximations or non-convex problems. In the context of distribution grids, DC approximations are often not accurate enough for planning and operations algorithms. DC approximations can be used to reduce calculation time and eliminate convergence problems. However, a DC approximation makes linear assumptions about the losses in the lines and does not consider the transit of reactive power flows. These two characteristics are critical in the distribution grid. Due to a high ratio between the resistance and the reactance of lower voltage networks, losses are not linear but quadratic as a function of the current. The reactive power transit in a distribution system can also have effects on the voltage profiles and congestion problems. Therefore, full AC power flow models should be used when performing distribution grid analysis.
Full AC power flow models are non-linear and non-convex. Non-convex problems are often solved by decomposition or heuristic techniques which can be costly in terms of calculation burden. Within the non-linear convex category, there exist two main convex relaxations: the SDP relaxation and the SOCP relaxation. Both of these relaxations have been proposed in various papers for distribution power system analysis. These papers often address operations of distribution grids [24] [25] [26] [27] [28] [29] [28] [30]. Few are presented as planning algorithms [31] [32] [33]. An OPF is capable of calculating optimal set points of controllable devices dur-ing multi-period analysis. It assumes a centralized control that optimizes the entire network. This implies that one actor is controlling all the controllable devices with one primary objec-tive. The lack of controllability and observability in current distribution grids make the OPF somewhat unrealistic. However, increased decentralized generators could make this control and optimization more important.
1.5
Challenges of decentralized energy resources
Some possible decentralized generators that are often connected to the distribution grid include PV, wind turbines and micro-hydroelectric generators. These decentralized generators bring about new challenges for the distribution grid operators. These challenges include bi-directional or increased power flow within the network, voltage profile deviation and compromised safety of equipment. To exacerbate these challenges, uncertainties in the distribution grid are high due to reduced aggregation effects in comparison to medium and high voltage grids. Unpredictable variation in load and generation can create high fluctuations in network power flow therefore causing unpredictable changes in the voltage profile.
The principal challenges associated with DER are discussed in [34]. The primary difficulty in relation to the quality of power delivered can be related to voltage level, and power conditioning. Localized voltage regulation is important at the distribution level. The voltage level can be significantly affected by high variations of power flow in the electrical lines. Undesirable effects such as flicker or voltage deviations can occur. Power conditioning through voltage regulation devices (e.g. tap changing transformers or static var compensator) is not always compatible with decentralized generators. Decentralized generator inverters can also contribute to harmonics in
1.5. CHALLENGES OF DECENTRALIZED ENERGY RESOURCES 27
Figure 1.8: Hypothesis used by the French DSO for medium voltage and low voltage distribution systems planning studies [4]
the grid which reduce power quality, affect negatively regulation and safety devices [34]. Additionally, DSO are not the only entity installing decentralized generators, adding further challenges to guarantee power quality. Individuals, companies and also private power producers have increased their interest in DER in the past years due to increasing environmental concerns and subsidies for renewable energy development. While in France, one primary player exists (EDF), new players are emerging offering alternative energy generation possibilities. These new decentralized generators may be used for alternative uses not aligning with the objectives of EDF or Enedis. However, these generators may still be connected to the distribution grid. This implies a new usage of the existing architecture. This introduction of multiple players forces the DSO to adapt current planning and operational strategies to host such demands.
1.5.1 Increased or bi-directional current
DER generators can act as current sources connected to decentralized nodes throughout the network. The injection of current into a distribution grid at a decentralized node can cause local challenges. If a high capacity of DER is installed in an area that has low load, current can flow from the decentralized node towards the substation. This reverse current flow can have effects on safety devices, voltage regulation devices and maximum current limits of distribution lines. Certain nodes may have so much DER installed in networks with low loading scenarios that reverse current exceeds maximum current values of the electrical line. Therefore, possibly requiring a re-sizing of the current electrical line based on the peak load resulting from peak injection of the generator.
28 CHAPTER 1. INTRODUCTION
power flow created by decentralized generators. Fuse coordination can be affected by DER due to the fact that DER change downstream current. If DER do not disconnect early in a fault situation, security devices attempting to clear the fault could malfunction. This can cause further damage to conductors, insulators or DER itself. Existing breakers, reclosers and fuses may also be affected if these devices are already operating close to their rated maximum device current. DER can increase the existing currents running through these devices therefore exceeding maximum current limits. Faults on adjacent feeders can have tripping effects on DER, therefore disconnecting the DER for no reason and propagating the fault signal. When generators are connected to a low voltage system with a grounded wye connection, the DER can have a negative effect on the ground fault coordination of utility breakers and reclosers. For a more extensive and more detailed list of other safety concerns see [35].
1.5.2 Voltage regulation devices
Generally, DER will increase the voltage profile locally where it is installed due to the injections of power into the distribution grid. The DER can inject active power but also reactive power. Active power injection when correlated with local loading of the feeder can decrease losses in the distribution system. However, injected active power far away from load can increase losses. Reactive power injection is not allowed in some countries due to undesirable effects of interactions with existing voltage regulation components such as switch capacitor banks or OLTCs. However, reactive power control to assist volt var regulators has been shown to be promising [36] [37].
If DER do not attempt to regulate local voltages, normally switch capacitor banks are unaffected. However, if DER do attempt to control local voltages or change downstream current of the regulating device, line drop compensation calculations may no longer be accurate. Both switch capacitor banks and step type voltage regulators attempt to calculate the downstream voltage based on the current close to the device. Assumptions of downstream voltage are no longer accurate if DER attempt to change local voltage or inject significant power into the grid. Therefore, downstream voltage regulation calculations are no longer accurate [35].
1.6
Innovative smart grid solutions
In the current context of smart grids, the existing electric grid infrastructure should evolve in the following areas as stated by the US Congress: increased digital information and controls, dynamic optimization of grid operations, deployment of distributed resources, incorporation of demand-side resources and demand response, deployment of smart technologies and integration of smart appliances and consumer devices, deployment of storage and peak-shaving technology, provision of timely information and control options to consumers, standard development for com-munication and interoperability of equipment and identification, and lowering of unreasonable barriers to adopt smart grid technology, practices, and services [38].
Smart grid solutions are often proposed to optimize existing infrastructure therefore delaying power electronic and infrastructure investments. The idea of a smart grid is to optimize certain flexibilities available in the grid as opposed to allowing a passive operational scenario. A review of ADN enabling technologies can be found in [39]. This review covers a general summary of existing solutions to transform a passive traditional distribution system into an ADN. These strategies include the active control of generator dispatch, transformer tap positions, voltage regulators, reactive power and system configuration. The strategies discussed in [39] to be the most common ones found in the literature include demand side management, storage devices,
1.6. INNOVATIVE SMART GRID SOLUTIONS 29
dynamic line rating, voltage and power control, fault current limiters and advanced distribution protection. This thesis will focus primarily on three of these solutions including storage devices, demand side management and power control in the form of curtailment.
1.6.1 Storage
The advantages of storage devices in ADN are well documented in [40]. Techno-economic analysis is necessary to evaluate if the advantages of battery systems outweigh their costs. The main categories of storage benefits as described by [41] include bulk energy services, ancillary services, transmission infrastructure services, distribution infrastructure services and customer energy management services. The primary benefits analyzed in this thesis include lines loss reduction, electric energy time-shifting, minimization of DER curtailment and mitigation of congestion problems.
With variable prices of electricity, retail electric energy time-shift can become economically advantageous. Economic benefits occur when storage units absorb energy during periods when electric prices are low and resell the electricity during periods when electric prices are high. This mechanism allows storage devices to reduce operational costs for a DSO or reduce electric bills for residential and commercial customers. Naturally a distributed storage device managed by the DSO can also decrease line losses. Distributed storage devices may also significantly reduce necessary curtailment when installed close to decentralized generators. When attempting to optimize a whole feeder, a centralized optimization algorithm is most effective to determine the operational set points of each storage device. These types of algorithms can coordinate the operation of decentralized storage devices so that a conflict of interest does not occur possibly creating more problems for the DSO.
1.6.2 Demand side management
Demand side management can be implemented passively by giving price signals to end-user customers and encouraging behavioral changes. Active control of devices is another technique. Often these devices that are possible to control are devices that are not time sensitive. For example, the washing machine that must be finished by a certain time in the evening but the precise hour when the machine is launched is less important. The second type of controllable load has some inherent storage, for example hot water heaters or space heating equipment. If the thermal inertia of a thermal electrical load is large enough, these devices can be turned off for certain periods without affecting significantly end-user comfort. This type of demand side management is based on a sort of decentralized thermal storage characteristic that when cumulated can have significant effects on operational grid costs.
1.6.3 Curtailment
Curtailment is the active reduction of power of a decentralized generator below the ideal power output operational set point because the grid is incapable of absorbing the produced power. This can be caused when decentralized generation is high and electric consumption is low. The injection of large amount of power into an unloaded feeder can result in backwards power flow, voltage rise and congestion problems. This strategy is implemented usually if there is not another solution to consuming the excess energy. It can be cost-effective in comparison to infrastructure reinforcements but can negatively affect the payback period of the generator.
30 CHAPTER 1. INTRODUCTION
1.7
OPF analysis for planning tools
OPF algorithms are capable of analyzing multi-period problems and calculating optimal set points of controllable variables. An OPF analysis allows the consideration of flexibilities of smart grids to be considered during the planning phase. An optimization algorithm is ca-pable of minimizing or maximizing multiple parameters while considering the boundaries and requirements of each variable (i.e. power quality constraints). This approach is effective in grid simulation because it is capable of taking into account the system of equations used to describe a power flow in electrical lines while minimizing certain parameters such as losses. Optimum power flow has been used in the management and planning of the transmission grid however the use of optimum power flow in distribution systems is less frequent. An extensive review of optimization algorithms in the context of transmission system planning can be found in [42].
Optimization algorithms are capable of integrating the benefits of smart grid operations and devices into the planning process. These types of algorithms have been proposed in the literature but are rarely used in current planning strategies of the DSO. OPF analysis can include DC or AC power flow equations depending on the system analyzed. The classic power flow problem (AC model) calculates the active and reactive power flow at each node. However, AC power flow calculations are non-linear, non-convex and high-dimensional, which can be computationally intensive. Methods for resolving this non-linear system of equations include the forward/backward sweep, Newton Raphson method [16, 17], fast-decoupled load-flow method [18, 19], z-bus matrix construction method [20], and loop impedance method [21, 22].
The resolution of an OPF requires evolved techniques due to the fact that the problem formulation is high-dimensional and non-linear. Furthermore, these equations are considered non-convex. Convexity is the characterization of a set of values. A set of values is convex if any line drawn between two points in the set is also included in the given set [43]. This implies that, with solving techniques such as the interior-point method, simply following the gradient of the solution set will allow the algorithm to find the absolute minimum or maximum of the function. If a problem is not convex, following the gradient of the set will not result in finding an absolute minimum or maximum. Therefore, other techniques are used to attempt to find the absolute minimum of the solution set. These techniques include heuristics methods that consist of testing the solution space and comparing final values, thereafter selecting the best values. Examples of heuristic methods include particle swarm optimization [44], artificial bee colony [45] [46], differential evolution [47] and a hybrid tabu search particle swarm optimization [48]. However, heuristic algorithms often require a long calculation time as noted in [49] when compared to convex relaxation algorithms. The relaxation of certain equations to create a convex problem has been widely explored in the literature [50, 51]. The convex problem may not represent exactly the initial problem but can still find an optimal solution to the original problem. The advantages of heuristics include a real representation of the initial problem. The disadvantages include a substantial calculation burden and a final solution that is not guaranteed to be optimal. The advantages of convex relaxations are a low calculation burden and if the relaxation is proven to be exact, a guaranteed optimal solution.
The family of convex relaxation algorithms that is most commonly used for distribution grids is called a Quadratically Constrained Quadratic Program (QCQP). In multiple studies, the non-convex power flow equations have been cast as a QCQP as shown in [52, 53]. Within the QCQP family, two convex relaxation algorithms exist including the Second-Order Cone Program (SOCP) or the Semi-Definite Program (SDP). An SDP convex relaxation has been proved to be exact under certain conditions by [54]. While an SOCP relaxation has also proved to be exact
1.8. THESIS WORK OBJECTIVES 31
under certain conditions as stated in [55, 50, 56]. However, these relaxations have been proven to be inexact during periods of high renewable energy production feeding into the grid due to elevated line losses [57]. In order to determine the hosting capacity of a distribution grid, it is critical to have a precise and accurate calculation methodology when RE production is high. An example of this difficulty could be high photovoltaic (PV) production during the summer season. In order to overcome the challenge of inaccurate results at periods of high PV injection, [57] presents an AC optimum power flow algorithm that integrates linear cuts, implemented in a iterative fashion, to ensure an exact and feasible relaxation of the power flow equations. This single-phase AC optimum power flow algorithm has then been developed into a multi-temporal algorithm in order to more effectively evaluate the benefits of grid connected storage in [58].
1.8
Thesis work objectives
Through power flow modeling and optimal power flow modeling, strategies of distribution plan-ning and operations will be explored during this PhD. The main contributions of this thesis are the proposed methodologies for the planning and operations of distribution grids through sophisticated OPF tools. The author of the thesis studies the current methodologies and tools available for the distribution system planning and operations. These methodologies are analyzed for their applicability in smart grids with high renewable energy penetration. New methodolo-gies are proposed that improve the current methodolomethodolo-gies existing in the literature. Case studies are implemented to demonstrate the concrete results possible of such studies. The contributions of this thesis are summarized as:
• evaluation of the importance of three-phase unbalanced power flow equations in the context of planning and operations of distribution grids
• development of a methodology for the simultaneous optimal sizing and placement of de-centralized storage devices
• development of a methodology that considers uncertainties while generating day-ahead storage and controllable load schedules through stochastic optimal power flow analysis This thesis is divided into three main sections. First, (Ch. 2), low voltage three-phase unbal-anced systems are analyzed to identify the specificity of these systems and how these specificities affect the planning and operations of such systems. A more detailed literature review is pre-sented specifically related to three-phase unbalanced systems. An analysis of the effects of these imbalances on the power flow equations is presented. A case study is implemented to quantify these effects. In conclusion, accuracy improvements of the detailed analysis of three-phase sys-tems are deemed to be insignificant in the context of OPF planning and operations analysis. This conclusion motivates further studies in the thesis to consider single-phase estimations for each phase as opposed to fully developed unbalanced three-phase equations.
Second, (Ch. 3), deterministic OPF planning methodologies are presented for decentralized storage analysis. Multi-temporal aspects of an OPF algorithm are presented including a case study calculating the hosting capacity of an example distribution grid. Further adaptation of the OPF algorithm is presented for the use of optimal sizing and placement of distributed storage devices. A case study is presented showing the advantages of optimal distributed storage devices. The chapter concludes by presenting the real world applications of presented methodologies.
32 CHAPTER 1. INTRODUCTION
Figure 1.9: Thesis document outline and main contributions
Third, (Ch. 4), uncertainties in generation and load profiles are discussed. A methodology for integrating these uncertainties into the operations of distribution grids is presented. A case study showing the added benefits of DSM and storage is analyzed. Conclusions are drawn about the importance of considering uncertainties in the operations and planning process for distribution grids. A schematic outline of the thesis topics is found in 1.9.
![Figure 1.8: Hypothesis used by the French DSO for medium voltage and low voltage distribution systems planning studies [4]](https://thumb-eu.123doks.com/thumbv2/123doknet/2992170.83547/30.918.148.769.123.519/figure-hypothesis-french-voltage-voltage-distribution-systems-planning.webp)