En vue de l'obtention du
DOCTORAT DE L'UNIVERSITÉ DE TOULOUSE
Délivré par :Institut National Polytechnique de Toulouse (INP Toulouse)
Discipline ou spécialité :
Mathématiques Appliquées
Présentée et soutenue par :
M. TAMBET TREIMUTH le vendredi 19 janvier 2018
Titre :
Unité de recherche : Ecole doctorale :
Dynamic optimization of airspace sector grouping
Aéronautique-Astronautique (AA)
Laboratoire de Mathématiques Appliquées, Informatique et Automatique pour l'Aérien (MAIAA-ENAC)
Directeur(s) de Thèse :
M. DANIEL DELAHAYE MME SANDRA NGUEVEU
Rapporteurs :
M. BERNARD GENDRON, UNIVERSITE DE MONTREAL M. ERIC FERON, GEORGIA INSTITUTE OF TECHNOLOGY
Membre(s) du jury :
M. CYRIL BRIAND, UNIVERSITE TOULOUSE 3, Président M. CLAUS GWIGGNER, UNIVERSITE D'HAMBOURG, Membre
M. DANIEL DELAHAYE, ECOLE NATIONALE DE L'AVIATION CIVILE, Membre Mme SANDRA NGUEVEU, INP TOULOUSE, Membre
Abstract
The current airspace configuration is highly structured, fixed and is less responsive to changes causing the overall system to lack the flexibility, adaptability, and responsibility needed to handle the increasing air traffic demands in the near future. The work presented in this thesis aims at improving the flexibility and adaptability of today’s airspace management in Europe in a pre-tactical context. We focus on the development of a method to support a process of automatic generation of a sequence of sector configurations composed of predefined sectors. Airspace configurations should be dynamically adjusted to provide maximum efficiency and flexibility in response to demand fluctuations. We dynamically build configurations by combining existing elementary sectors. In this step, any sector combination which forms controllable airspace blocks is eligible and may be used during the day of operation. In this work, we developed efficient methods to solve DAC problem. We formulated and study the sectorization problem from an algorithmic point of view. We proposed methods based on a mathematical modeling and heuristic optimization techniques. We also introduced here an approach to evaluate the workload inside sectors.
Keywords: airspace blocks, opening schemas, optimization, sector
Resum´
e
Au cours de ces derni´eres d´ecennies, au fur et `a mesure de l’augmentation du trafic, l’espace a´erien a ´et´e divis´e en secteurs de plus en plus petits afin d’´eviter la saturation de ces derniers. Ce principe de sectorisation pr´esente une limite dans la mesure o`u l’on doit m´enager un temps suffisant au contrˆoleur pour g´erer son trafic et donc g´en´erer des secteurs dont la taille permet de satisfaire cette contrainte. De plus, le contrˆoleur ne connaˆıt que le trafic li´e `a son secteur et lorsqu’un avion passe d’un secteur `a un autre, il s’op`ere un dialogue entre les contrˆoleurs et les pilotes qui induit une charge de travail suppl´ementaire (coordination). Au cours d’une journ´ee de trafic ordinaire, la charge de contrˆole fluctue dans le temps en fonction des demandes de trafic entre les diverses paires origine-destination. Dans le syst`eme op´erationnel actuel, le nombre de contrˆoleurs varie en fonction des fluctuations de trafic. La nuit par exemple, le nombre d’´equipes de contˆorle est r´eduit car il y a beaucoup moins de trafic. Les secteurs sont alors regroup´es en groupe de trois `a quatre avant attribution `a une ´equipe de contrˆoleurs.
Il est donc n´ecessaire d’optimiser la planification sur une journ´ee du sch´ema de regroupement et de d´egroupement des secteurs: resectorisation dynamique de l’espace a´erien. Un des objectifs est de fournir des groupes de secteurs pr´esentant un minimum de coordinations et ´equilibr´es en terme de charge de contr`ole afin que chaque ´equipe de contrˆoleurs travaille de la m`eme fa¸con. Les instants de com-mutation entre configurations de secteurs en fonction des fluctuations de trafic doivent ˆetre d´etermin´es, et les distances entre configurations successives doivent Ãłtre prises en compte afin d’´eviter des changements brusques au sein d’un es-pace a´erien donn´e. Le d´eveloppement d’un algorithme efficace pour r´esoudre le probl`eme dynamique r´esultant est d’autant plus important que le trafic a´erien est amen´e ´evoluer de mani`ere significative au cours des ann´ees qui viennent.
Mots-clefs: bloc d’espace a´erien, sch`emas d’ouverture, optimisation, regroupe-ments secteurs, g´en´eration de colonnes.
Acknowledgements
I would like to thank my supervisors, Daniel Delahaye and Sandra Ulrich Ngueveu, for the patient guidance, and advice they has provided throughout my time as a PhD student. I am also very grateful to my jury members, professor Eric Marie J Feron, professor Bernard Gendron, professor Cyril Briand for serving as my jury members. This thesis has been written during my stay at ENAC. I would like to thank the ENAC for providing excellent working conditions and for its financial support. I would like to express my special appreciation and thanks to my friends Ma Ji, Jun Zhou, Giang Bang Nguyen and Supatcha Chaimatanan. I would like to thank Serge Roux for the technical support. I would like to thank my colleagues Andrija Vidosavljevic and Romaric Breil for their contribution to the improvement of the thesis.
3 5 7
Contents
Abstract Resum´e Acknowledgements1 Introduction and Problem Definition 17
1.1 Air Traffic Services . . . . 17
1.2 Air Traffic Management . . . . 19
1.3 Airspace Sectorization . . . . 20
1.3.1 Air Traffic Controller . . . . 20
1.4 Air Traffic Planning Periods . . . . 24
1.5 Dynamic airspace configuration . . . . 27
1.6 Objectives, scope and contribution of this study . . . . 28
1.7 Thesis organization . . . . 28
2 The State of the Art 29 2.1 Major challenges of dynamic sectorization . . . . 31
2.2 Dynamic sectorization algorithms (Type I) . . . . 32
2.3 Dynamic sectorization algorithms (Type II) . . . . 36
2.4 Dynamic sectorization algorithms (Type III) . . . . 36
2.5 Dynamic sectorization algorithms (Type IV) . . . . 36
2.6 Conclusion . . . . 38
3 Airspace Complexity Metrics 41 3.1 Introduction . . . . 41
3.2 Previous related works . . . . 44
3.3 Metrics proposed for the DAC problem . . . . 47
3.3.1 Flow-based approach . . . . 47
3.3.2 Geometrical approaches . . . . 51
3.3.4 Spatiotemporal extension using non-linear dynamic systems 72
3.4 Implementation of the Complexity algorithm on GPU . . . . 73
3.4.1 Sequential and Parallel Programming . . . . 74
3.4.2 Graphics Processing Units . . . . 78
3.4.3 Sequential implementation . . . . 80
3.4.4 Parallel implementation on GPU . . . . 83
3.4.5 Results . . . . 86
3.5 Conclusion . . . . 89
4 MILP for dynamic airspace configuration 95 4.1 Fundamentals of (Mixed) Integer Linear Programming . . . . 96
4.1.1 Linear Programming basic concepts . . . . 96
4.1.2 (Classical) Solution Methods . . . . 98
4.2 MILP formulations for the MPDAC problem . . . 101
4.2.1 Problem statement . . . 101
4.2.2 Center-based mathematical model . . . 103
4.2.3 Tree-based mathematical model . . . 105
4.2.4 Group-based mathematical model . . . 108
4.2.5 Configuration-based mathematical model . . . 110
4.3 Branch-and-price-based solution method . . . 113
4.3.1 Principle . . . 113
4.3.2 Pricing procedure . . . 114
4.3.3 Branch-and-price scheme . . . 115
4.4 Computational results . . . 115
4.4.1 Instances and implementation . . . 115
4.4.2 Results and analysis . . . 117
4.5 Conclusion . . . 119
5 Conclusion 123 Perspectives . . . 125
List of Figures
1.1 Air traffic flows in 1989 (on the left) and in 2015 (on the right) . . 19
1.2 This figure shows the European airspace structure based on the new Functional Airspace Blocks concept. Such blocks are shown with thick solid lines In this figure, the French airspace belongs to the core area called FABEC. In this airspace, control center areas are represented by light shaded lines. . . 21
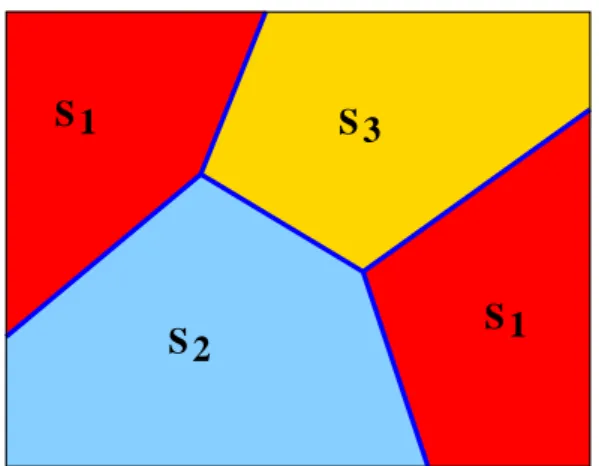
1.3 Convexity constraints. Sector has to be convex according to the airways directions. In this figure, aircraft have to cross four time the boundaries of sector S1 which is fully forbidden in operational airspace . . . 24
1.4 Min stay time constraint. This constraint is also linked to the shape of sectors. One must avoid design like sector S2 on this figure for which aircraft stay to short time in this sector and induce only coor-dination workload. Controllers in charge of S2 have not possibilities to manage this traffic because aircraft do not stay enough time in the sector. . . 25
1.5 Boundary constraint. In this figure, controllers in charge of sector S1 are not able to manage conflicts at the crossing point due to the lack of space between such point and the boundary with sector S2. In order to avoid such problem, crossing points have to be located in the central area of sectors. . . 26
1.6 Connectivity constraints. In this case, sector S1 is split into two not connected components which is a situation fully forbidden in operational airspace. . . 27
3.1 Workload imbalance between sectors . . . 43
3.2 Crossing of two routes . . . 47
3.3 Network showing three possible coordination situations . . . 49
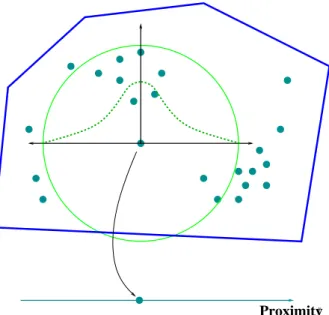
3.4 On the left, we have five airplanes which are well distributed across the sector. In the situation represented on the right, the same five airplanes are aggregated in a reduced spatial zone. . . 52
3.6 Evolution of the number of airplanes and of proximity as a function of time . . . 53 3.7 Evolution of the (proximity)/(number of airplanes) relationship over
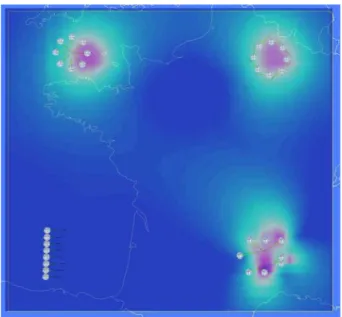
time . . . 53 3.8 This figure presents an artificial traffic situation with 4 groups of 8
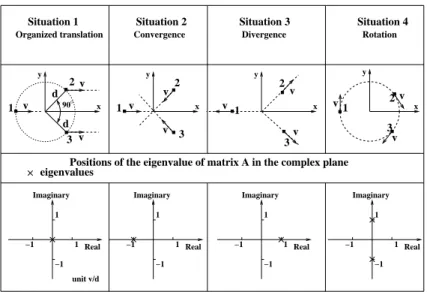
aircraft placed on a square. For each point in the space, we calcu-late the average level of proximity, considering the airplanes in the vicinity of the point. . . 54 3.9 The speed distributions are identical in the top 4 situations and the
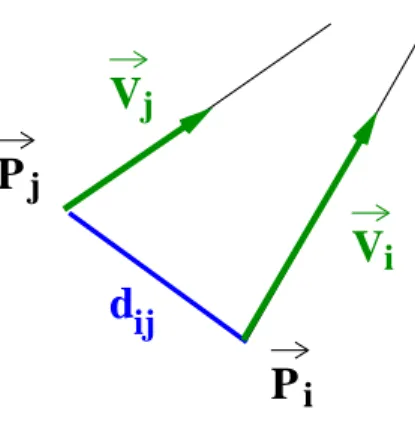
bottom 4 situations; however, the relative distance is smaller in the bottom 4 situations. The most critical situation is located at the bottom right (strong convergence and low relative distance). . . 55 3.10 The variation of the relative distance between two airplanes (dij)
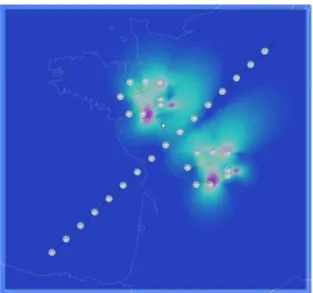
indicates whether or not they are converging, and at what speed. . 56 3.11 In this figure, two airplanes are represented in a proximity/convergence
referential. The airplanes located in the top right zone are the most critical (strong convergence with high proximity). . . 57 3.12 Convergence and proximity calculated for a day of French air traffic. 57 3.13 Convergence map for four groups of eight airplanes . . . 57 3.14 This figure presents two extreme traffic situations. On the left, the
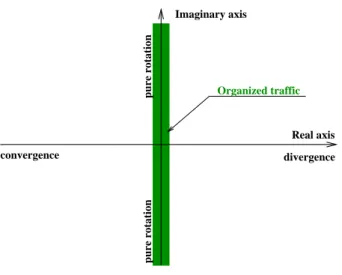
airplanes are completely structured in terms of speed and the situ-ation presents no difficulties. On the right, however, the situsitu-ation is extremely disordered and will consequently be harder to manage. 59 3.15 Mapped Grassmannian indicator . . . 61 3.16 Location of the eigenvalues of matrix A. The central rectangle
cor-responds to organized traffic situations (in pure rotation or in trans-lation). . . 62 3.17 Radar captures associated with three aircraft . . . 63 3.18 Vector field produced by the linear dynamic system . . . 63 3.19 Representation of the eigenvalues of matrix A associated with 4
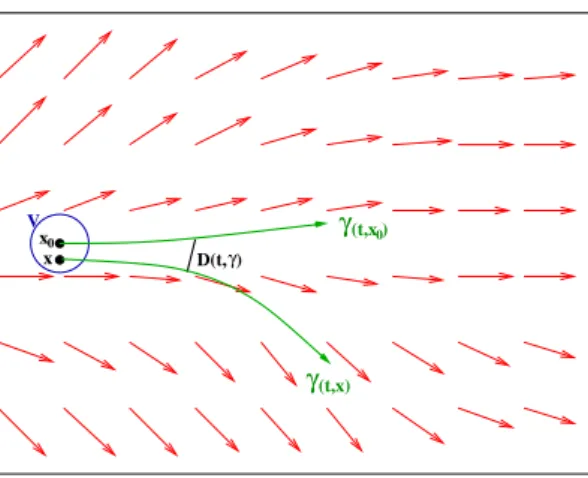
traffic situations. . . 65 3.20 Temporal evolution of the reference trajectory and a trajectory
taken from the vicinity in ~x0. . . 67
3.21 Map of Lyapunov exponents for four artificial traffic situations. . . . 70 3.22 The Lyapunov exponents have low values at the level of the “Miles
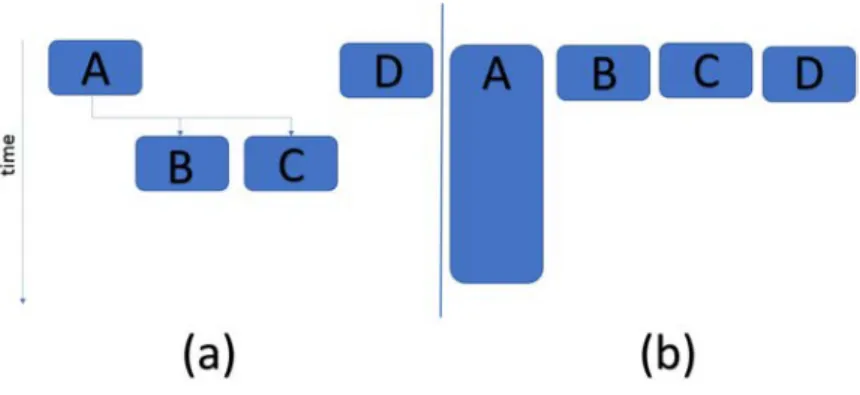
In Trail” organized traffic, and high values in zones of disordered traffic . . . 71 3.23 Looped trajectory in the horizontal plane . . . 72 3.24 Independent software tasks can be run in parallel on multiple
3.25 (a) Tasks can be arranged to run in parallel as long as dependencies are honored. (b) Tasks may take different amounts of time to be
executed. Both of these issues may reduce scalability. . . 75
3.26 Vectors addition computed on a CPU . . . 75
3.27 Vector addition computed on a GPU . . . 76
3.28 Computing sequentially the minimum value of a set of elements . . 77
3.29 Computing the minimum value of a set of elements in parallel . . . 77
3.30 GPU has more transistors for data processing . . . 79
3.31 The figure shows the sequential structure of the proposed method. Only one Lyapunov exponent value is computed at a time. . . 81
3.32 Two consecutive traffic situations in the airspace. Gradients are computed at the points that aircraft pass. Those points are marked by circles. . . 83
3.33 Gradient values are computed multiple times for the same grid point. 83 3.34 The figure shows the sequential structure of the proposed method. Only one thread is used for computing. . . 84
3.35 For a given grid point, only one gradient value is computed at one timestep t. The same function is called sequentially. . . . 85
3.36 Multiple input values are copied simultaneously to the GPU. This way multiple gradient values are computed simultaneously. . . 86
3.37 Lypaunov exponents are computed sequentially. Only one complex-ity value is returned at each time step. . . 87
3.38 Multiple complexity values κ are computed simultaneously on the GPU. It computes complexities at the same time for many grid points. . . 88
3.39 The gradient computation and the Lyapunov exponent computation are combined. It reduces the computation time because less data coping operations are needed. . . 89
3.40 European Airspace . . . 90
3.41 French Airspace . . . 91
3.42 Aircraft trajectory projection. This figure shows on the left the initial traffic seen by the controller. The center correspond to the radar extraction with maneuver. On the right, one can see the traffic rebuilt by the prepossessing step. . . 91
3.43 Those figures present two traffic situations for which complexity map have been computed. The left figure shows a complex traffic situation and the right one correspond to an easy one.. . . 92
3.44 Sectors in the Reims ACC . . . 92
3.45 Workload and complexity comparison . . . 93
4.2 CS solution for instance 9 (starting at 8h00, T = 8) . . . 120 4.3 GA solution for instance 9 (starting at 8h00, T = 8) . . . 121 4.4 BP solution for instance 9 (starting at 8h00, T = 8) . . . 122
List of Tables
3.1 Lyapunov exponent computation comparison on the French airspace.
Each line correspond to different grid size. . . 87
3.2 Lyapunov exponent computation comparison on the French airspace. Each line correspond to different grid size. . . 88
3.3 French airspace computation error. In this table, ten cases have been evaluated. Each case correspond to a given traffic situation for which complexity metric has been computed by the CPU and also by the GPU. The associated relative error between the two methods are given in the right column. . . 93
3.4 Reims ACC computation error . . . 94
3.5 French airspace computation error. In this table, ten cases have been evaluated. Each case correspond to a given traffic situation for which complexity metric has been computed by the CPU and also by the GPU. The associated relative error between the two methods are given in the right column. . . 94
3.6 European airspace computation error . . . 94
4.1 Primal-Dual relations between linear programs . . . 97
4.2 Sector traffic between 6h00 and 8h00 . . . 116
4.3 Sector traffic between 8h00 and 10h00 . . . 116
4.4 Sector traffic between 10h00 and 12h00 . . . 117
4.5 Sector traffic between 12h00 and 14h00 . . . 117
4.6 Comparison of solutions values from CS, GA and BP . . . 118
4.7 Comparison of solutions per instance from BP(α, β, γ) with differ-ent α, β, γ parameters values: WD = workload difference, CW = coordination workload, FC = frontier changes . . . 119
Chapter 1
Introduction and Problem
Definition
1.1
Air Traffic Services
In terms of the services provided, airspace can be fundamentally divided into controlled and uncontrolled airspace. According to the portion of airspace where services are provided, the Air Traffic Services (ATS) in controlled airspace are divided into three groups: airport control service, approach control service and area control service. These three groups are further associated with the typical phases of flight for airspace users. Airport control service ATS are provided to aircraft on the airport surface or in the vicinity of the airport up to the boundary to approach control service or area control service. Airport control service is responsible for the taxi and take-off phases of flight.The airport control service is typically located in the airport towers. Airport control in busy airports is usually divided into start-up control, taxi control and departure and arrival control in relation to the different phases of the aircraft activity on the airport ground. The flights controlled within the approach control are in the arrival/departure phase. When many airports converge in the same area, the approach controls for the different airports are merged into a single TMA. Approach control is typically located in towers whilst TMA controls are located in separate control centers. Approach control service is responsible for the early stages of climb, late stages of descent and approach phases of flight. Approach control is usually divided into smaller airspace partitions in such a way that different units control the departure or the arrivals of air traffic from/to the airports. The area control service comprises all the controlled areas outside the two above (airport and approach control). Area control service is responsible for the cruise, late stages of climb and early stages of descent of flights. The area control service is usually referred to as en-route
control and is typically located in Area Control Centers (ACCs), which are in charge of a certain portion of airspace. When the control service is located over the seas and oceans where there is no radar coverage the center is referred to as Oceanic Area Control Center (OACC). The OACC controlling procedures differ significantly from the ones operating located over land. In fact, the control in the OACC is of a procedural type not based on radar positioning but on estimated positioning made by pilot reports. The rules and separation distances differ from those used in ACCs. In areas of procedural control the separation standards are larger than in other areas due to the lack of positive positioning with radar systems. The airspace under the control of ACCs is structured into a network of routes and smaller portions of airspace volume . These smaller portions have the main objective of easing the air traffic control (ATC) function with a subsequent increase in safety and capacity. The specific manner in which the airspace is divided and configured is called airspace configuration or sectorization. Each of the indivisible airspace portions resulting from the airspace sectorization is referred to as a basic sector or an elementary sector in this thesis. Depending on operational conditions, such as weather or traffic flows, basic sectors can be combined differently resulting in different airspace volumes known as operational sectors, which are controlled by a team of air traffic controller (ATCOs), each of the teams occupying an operational position inside the ATC centers (ATCC) operations room. An operational sector or controlled sector can therefore be either one basic sector or a combination of sectors. Each of the different combinations of basic sectors resulting in operational sectors corresponds to a unique sector configuration.
Airspace Management (ASM) measures are major contributors to the demand and capacity balancing task, applied through the ATFCM measures : the ASM function designs optimum airspace configurations, in terms of routes and sector-izations aiming to satisfy airspace users requirements at the same time as ATC centers requirements. During the execution phase, the ASM management function directly assists the ATFCM function optimizing capacity resources and avoiding over-deliveries by means of providing the optimum sector configuration. Configu-ration management selects the optimum sector configuConfigu-ration based on:
• Traffic pattern predictions • Weather predictions
• Available sector configurations • Staff availability
• Event predictions • Military activity
Splitting operational sectors is a measure that increases capacity, whereas com-bining operational sectors reduces the capacity. This procedure is typically used to ensure an airspace configuration which is tailored to the traffic demand and operational needs. Splitting airspace volumes into smaller operational sectors has been the main enabler for increasing airspace capacity, which does not involve any substantial technological change. Even though the absolute traffic levels for smaller airspace sectors are reduced compared to larger sectors, the former can handle more traffic density, hence releasing capacity enhancements.
1.2
Air Traffic Management
The world of air transport is changing, not only through the technological evolution and economy, but also as an interaction of society demands, in term of future strategies. European ATM is undergoing a process of change in many of its aspects and the infrastructure side of ATM needs improvement and modernization. Air traffic flows increased by 33% since 1989 and they are expected to nearly double over the next 20 years (see Figure 1.1).
Figure 1.1: Air traffic flows in 1989 (on the left) and in 2015 (on the right)
The current airspace configuration is highly structured, fixed and is less re-sponsive to changes causing the overall system to lack the flexibility, adaptability, and responsibility needed to handle the increasing air traffic demands in the near future. Meanwhile, the air traffic is managed by ground based air traffic controllers (ATCO) who are responsible for safe and efficient air traffic management within a given airspace partition known as a sector. As a human, an ATCO has cognitive limitations restricting the number of aircraft that one ATCO can safely handle. In ATM, these cognitive limitations are measured by ATC workload which include the workload of monitoring, aircraft handover between sectors, conflict detection and resolution, and others. Moreover the air traffic is not evenly distributed in the airspace, which causes congestion in sectors sitting between the major airports, or
the sectors around major airways. This situation induces potential safety, efficiency issues, and other problems in busy sectors.
Although the ATM system evolved along with the advances in technologies, the cognitive limitations of ATC and the fixed airspace configuration induces sub-optimal efficient and safe airspace usage. Therefore, fundamental changes on the present airspace configuration, especially sectors, are required. A major European program for modernization of the air traffic management infrastructure has been launch (Single European Sky initiatives :SESAR project). A similar initiative has also been launch in UA (NextGen project). SESAR aims to define and implement new air traffic management concept of operations to overcome current capacity, environment and safety issues. SESAR has set the definition for the 2025 per-formance targets, which covers a broad spectrum. European Airspace Measures towards a more Sustainable ATM SESAR program aims at bringing the point of readiness for deployment of new trajectory management procedures and technolo-gies for the European ATM system.
1.3
Airspace Sectorization
Air traffic flow and capacity management is at the core of air traffic management network operations. Its objective is to optimize traffic flows according to air traffic control capacity while enabling airlines to operate safe and efficient flights. The balance between the airspace capacity and the traffic load is monitored perma-nently by the Network Manager Operations Center (NMOC1). Sectorization is a
fundamental architectural feature of the Air Traffic Control system. Airspace is usually divided into several sectors, each of them assigned to a team of controllers. The air traffic flow has been increasingly rising and is expected to rise even further. The forecasts predict the demand to be 11% higher than the supply in terms of airspace capacity in 20 years. As a consequence, the number of aircraft in each con-trol sector will also rising, and the associated workload will exceed the concon-troller’s capability, inducing unacceptable delays.
1.3.1
Air Traffic Controller
Air Traffic Control (ATC) is the function of providing a safe, expeditious and orderly flow of traffic in the designated portion of airspace. The ATC function ensures that no loss of separation occur while maintaining at the same time an efficient traffic flow. For this purpose, equipment, procedures and personnel in-teract in a complex manner to enable traffic separation and synchronization and communication. Aircraft are controlled according to their phase of flight by the
relevant facility: aerodrome, approach and area centers. Irrespective of the facility being considered, the process carried out by a controller team can be generalized as follows:
• Aircraft enter a sector;
• ATC estimates future positions of the aircraft and detects conflicts between them;
• ATC intervenes if necessary to separate aircraft; • Aircraft exit the sector.
At present in Europe, the elementary control sectors, which are the smallest subdivisions of the airspace for a controller, are grouped into qualification areas. Each air traffic controller is trained to work on all the elementary sectors of a qualification area, as well as groups of them, but cannot change the qualification area without undergoing a long and specific training. This mean that Elementary sector can only be grouped together inside a qualification area. Currently, there are seven qualification areas in France, grouped together in the five control centers. Figure1.2 shows the list of control centers and their qualification areas of several European countries which constitute the core area.
Figure 1.2: This figure shows the European airspace structure based on the new Functional Airspace Blocks concept. Such blocks are shown with thick solid lines In this figure, the French airspace belongs to the core area called FABEC. In this airspace, control center areas are represented by light shaded lines.
The Single European Sky project, developed by the European Union, plans to create the Functional Airspace Blocks which will subdivide the European sky according to the traffic flows and no longer according to the national borders, as
followed these days. This project plans to set up FABs in the core areas, which is defined as the European airspace region with the dense traffic.
The airspace is divided into qualification areas that are, themselves a part of en-route control centers. This means that there are already several divisions of the airspace in Europe, depending on whether we are talking about the division into sectors, areas, or centers. For practical reasons, en route control differentiates the upper airspace from the lower airspace. The division level between the upper and lower airspaces is fixed at a flight level 195 (5944 m). This operational differen-tiation is based on the cruising flight level of commercial aircraft. The resulting air traffic control and the related problems are therefore different in the lower and upper airspaces.
From European sky’s point of view, the current study concerns the reorganiza-tion of the control sectors into the qualificareorganiza-tion areas in the future. For example, this is the case of the airspace area controlled by the Eurocontrol center in Maas-tricht.
A sector is controlled by pair of controllers who ensure safety of flights by separating aircraft from each other according to the separation standard. The larger the number of aircraft in a sector, the more the control workload increases in a non-linear way. There is a limitation where the controller can no longer accept aircraft, which have to fly through less loaded neighbor sectors. In this case, the sector is said to be saturated. This critical situation must be avoided as it provokes a cumulative phenomenon of overload on the sectors upstream, and may even go as far as the departure airports.
In the controller’s workload, three main components are usually distinguish-able, which are as follows:
• Monitoring workload: in a sector, apart from any actions taken on the tra-jectory, the controller must check that flight plans are followed correctly on the radar image, and determine the potential risk of collision (conflict) with the surrounding aircraft. Monitoring is the controllers’ basic task, but it is a major source of stress for them. This workload is directly linked to the number of aircraft in the sector.
• Resolution workload: when a risk of conflict is detected, the controller can change the aircraft trajectory in order to maintain the minimal separation standard.
• Coordination workload: when an aircraft changes of sector, the controller who in charge of it makes control transfer and therefore the aircraft must change its radio frequency. Earlier, the transfer must have been accepted by the controller, who is receiving the aircraft. An agreement is made between the two controllers, the one receiving and the one transferring, in order to
ensure that the aircraft can be accepted and to define the transfer proce-dures such as the flight level, heading, speed. The coordination workload is proportional to the flow cut by the sector borders.
There are two different types of controllers:terminal controllers and en-route controllers.
Terminal controllers manage the coming and going of aircraft into an airport. First a plane is given a flight plan which the controllers put into a sequence. They then guide the aircraft on the ground to the active take off runway and give the pilot clearance to take off as soon as they are sure of the safety of the departure. Terminal controllers are broken up into two main sections: tower local controllers and terminal radar controllers. Tower local controllers use visual observation to manage arriving and departing aircraft at runways. They may also provide guid-ance for aircraft on taxiways. Terminal radar controllers monitor the arriving and departing aircraft in the terminal area by using radar image of the traffic. Using the radar they can determine if the distances between planes are safe and can also keep an eye on weather conditions.
En route controllers manage traffic between TMAs. There are twenty air route traffic control centers in Europe, all assigned to different sections of airspace. The aircraft is passed to different controllers within the center and then in between centers as it moves through its designated flight plan. If a problem arises and two planes are heading towards one another, it is up to the en route controllers to switch one of the planes onto a different path or altitude, making sure that this change does not interfere with any other aircraft. About fifty miles away from the destination airport, en route controllers organize the aircraft in a sequence for arrivals and transfer them to terminal controllers.
The training of terminal controllers and en route controllers are identical, but their duties vary significantly. Terminal controllers manage arrivals and depar-tures, and taxiing of aircraft, and en route controllers monitor aircraft through airspace. Their responsibilities, however, are the same. They both are responsible for keeping aircraft safe.
Sector design has to satisfy several constraints: workload constraint, convexity constraint, boundary constraint and connectivity constraint.
• Workload constraint The workload constraint limits the capacity of a sector below a maximum threshold that is called sector capacity. This value specifies the maximum number of allowable aircraft in any sector at a given time.
• Convexity constraint or minimum dwell time and no reentry
S1
S2
Figure 1.3: Convexity constraints. Sector has to be convex according to the airways directions. In this figure, aircraft have to cross four time the boundaries of sector
S1 which is fully forbidden in operational airspace
for a minimum amount of time and does not re-enter the sector again (see figures 1.31.4).
• Boundary constraint or safety constraint The boundary constraint en-sure a distance between sector boundaries and possible conflict points so that the controller has sufficient time to resolve the conflicts (see figure 1.5). • Connectivity constraint The connectivity constraint avoids sector
frag-mentation (see figure 1.6).
1.4
Air Traffic Planning Periods
The ATC provides the flights with clearances ensuring that separation minima requirements are met. Separation minima standards are set and regulated by each country and are based on ICAO’s standards. Typically in an European en-route ACC this separation standard is 5 Nautical miles (Nm) longitudinally and 1000 feet (ft) vertically. ATM operational planning goes through an iterative refinement process, in which different layered measures are applied to optimize the operations as more accurate information becomes available. Therefore, the different tasks are individually associated with a certain temporal layer or frame. The time-frames are defined as periods of time relative to the absolute execution time of the flight:
• Long-term: More than 6 months before flight execution day. • Strategic: 6 months to one day before the flight execution day.
S1
S2
S3
Figure 1.4: Min stay time constraint. This constraint is also linked to the shape of sectors. One must avoid design like sector S2 on this figure for which aircraft stay
to short time in this sector and induce only coordination workload. Controllers in charge of S2 have not possibilities to manage this traffic because aircraft do not
stay enough time in the sector.
• Pre-Tactical: one day before to approximately 20 minutes before departure.
• Tactical: from approximately 20 minutes before to the actual flight trajectory instant.
• Execution: relative zero time.
• Post-execution: after flight execution.
The long-term planning function, encompasses all the strategic planning pro-cesses of the ATM system. This includes demand prediction, planning activities at network and local (ATC center and airport) levels. In addition, ATC centers need to estimate and develop the long-term operational requirements in terms of future technologies, procedures and operations. The network planning process gathers the plans and predictions from ATC centers and airlines in order to build a holis-tic prediction of the network, aiming to detect possible imbalances and support as well the local planning processes.
The strategic phase takes place seven days, or more before the day of oper-ations. During this phase the NMOC helps the air navigation service providers (ANSPs) to predict what capacity they will need to provide in each of their air traffic control centers. A routing scheme is prepared. This also includes avoiding imbalances between capacity and demand for events taking place a week or more in the future.
S 1 S 2 S 3
f
23f
131
2
4
3
Figure 1.5: Boundary constraint. In this figure, controllers in charge of sector S1
are not able to manage conflicts at the crossing point due to the lack of space between such point and the boundary with sector S2. In order to avoid such
problem, crossing points have to be located in the central area of sectors.
The pre-tactical phase takes place one day to six days before the day of oper-ations. During this phase the NMOC coordinates the definition of a daily plan, the initial network plan and informs air traffic control (ATC) units and aircraft operators about the air traffic flow and capacity management (ATFCM) measures that will be applied in European airspace on the following day by publishing the agreed plan for the day of operations.
The tactical phase takes place on the day of operations. During this phase the NMOC monitors and updates the daily plan based on the current situation and continuous capacity optimization according to real time traffic demand. When air-craft are affected by a regulation, the center offers alternative solutions to minimize delays.
The post-operational phase takes place after the day of operations. During this phase an analysis is carried out in order to measure, investigate and report on operational processes and activities throughout all domains and external units relevant to an ATFCM service. This phase compares the anticipated outcome with the actual measured outcome, generally in terms of delay and route extension, while taking into account performance targets. This allows operators to develop best practices and/or lessons learned to improve those operational processes and activities.
S 1
S 1 S 3
S 2
Figure 1.6: Connectivity constraints. In this case, sector S1 is split into two not
connected components which is a situation fully forbidden in operational airspace.
1.5
Dynamic airspace configuration
During the course of a day, the ATC workload fluctuates based on traffic demands between various origin-destination pairings. As the traffic in the airspace is chang-ing with time, it is necessary to consider dynamic reconfiguration of the airspace for which the number of controlled sectors and their shape will be adapted to the current traffic situation. Initial elementary sectors can be temporarily combined with each others in order to improve efficiency of the airspace configuration. This process is called Dynamic Airspace Configuration (DAC).
Current airspace consists of static sectors. The purpose of the current airspace management is to ensure that controllers are not overloaded throughout the day of operation. Configuration process consists in combining and de-combining ele-mentary sectors into controlled sectors for example during shift change operations when the traffic demand is low. The idea is to find the optimal combination of elementary sectors that will provide the maximum capacity to a given input traffic, and balance the controller’s workload as much as possible between the controlled sectors.
The process of creation of configurations and opening schemes is done in the pre-tactical phase. Opening scheme specifies which controlled sectors should be opened during the day of operation, taking into account flight plans and the num-ber of available controllers. Any decision of adding some changes in the airspace configuration is based on operational experience. Currently, almost no automation is used to determine the best airspace configurations.
Because of the huge number of possible combinations of elementary sectors, the determination of sector configurations and opening schemes requires the use of automated support tools. Given the organizational framework of the concerned
airspace, the challenge is to organize, plan and manage airspace configurations to meet User Preferred Routing, in a Free Route environment with enough flexibility to respond to changes in traffic demand, to unexpected events including weather, and to any update in airspace in the optimum way, while maintaining the safety targets.
1.6
Objectives, scope and contribution of this
study
The work presented in this thesis aims at improving the flexibility and adaptability of today’s airspace management in Europe in a pre-tactical context.
We focus on the development of a method to support a process of automatic generation of a sequence of sector configurations composed of predefined sectors. Airspace configurations should be dynamically adjusted to provide maximum ef-ficiency and flexibility in response to demand fluctuations. We dynamically build configurations by combining existing elementary sectors. In this step, any sector combination which forms controllable airspace blocks is eligible and may be used during the day of operation.
In this work, we develop efficient methods to solve DAC problem. We formulate and study the sectorization problem from an algorithmic point of view. We propose methods based on a mathematical modeling and heuristic optimization techniques. We also introduce here an approach to evaluate the workload inside sectors.
1.7
Thesis organization
Chapter two discusses previous works related on dynamic airspace configuration. Chapter three, introduces air traffic complexity metrics with a focus on a new approach based on a non linear dynamical systems which has been implemented on GPU to speed up the computation. In chapter four, the multi-period dynamic airspace configuration problem is introduced, we propose mathematical formula-tions and a branch-and-price-based solution method is presented. The approach has been applied to real French airspace (Reims ATCC) for which results have been compared to current operational solutions.
Chapter 2
The State of the Art
Air traffic is currently controlled by air traffic controllers who monitor aircraft tra-jectories and give instructions to pilots to avoid collisions and dangerous situations. The airspace is partitioned into air traffic control centers which are partitioned into elementary sectors. These sectors may be combined together to form bigger air traffic control sectors, each operated by a team of controllers. The airspace config-uration, may change during the day, depending on the incoming traffic and work-load. Sectors may be split when the workload increases and may exceed capacity. A general statement is that workload depends largely on the number of flights, but also on the traffic complexity; For instance, aircraft flying parallel tracks at constant flight levels are less difficult. Dynamic airspace configuration can be ad-dressed with two approaches. The first approach consists in adapting the sector boundaries to the current traffic demand. This approach is not currently used in operations and requires new decision support tools for the controller to be able to manage sector with dynamic shape. The second approach, which is currently used in operation combines or splits existing sectors in order to have an optimal configurations of the airspace. Such a sector combination plan should minimize controller shifts and satisfy certain operational rules, such as minimizing changes of control regions over successive periods. Depending on the time of day, certain areas have high air traffic, while others have low traffic. The traffic intensity across different regions is also affected by the presence of convective weather, change in the demand profiles at various airports, military zone activities, etc ...
Airspace sectorization, also known as static airspace sectorization, consists in dividing an airspace into a number of sectors, each of them being assigned to a controller, as described in [29]. Static airspace sectorization has been widely studied and several solution methods were proposed, which can be separated into two types: freeform or based on airblocks. Airblock-based sectorization assumes that the airspace is already divided into indivisible elementary airblocks, usually polygonal shaped, which are grouped to form sectors that can be assigned to a
controller. In such cases the problem can be modeled as a particular graph par-titioning problem where the nodes of the graph represent the airblocks, the edges of the graph connect the nodes of adjacent airblocks [6]. Freeform sectorization do not use such hypothesis and aims to divide the airspace into polygonal re-gions. This is often done by using grids [46], Voronoi diagrams [45] or geometric algorithms [2]. A classical objective in static airspace sectorization is to ensure balanced workloads between controllers while respecting capacity constraints as well as the four sector design constraints described in the introduction: connec-tivity, convexity, minimum distance, minimum dwell time constraints. Capacity constraints are often in the objective function, in which case the problem either becomes a multi-objective problem or is considered as a weighted objective func-tion combining multiple terms. For a review of models and algorithms for static airspace sectorization, refer to the survey of [10].
A four-category classification can be done for publications on the topic of dy-namic airspace configuration.
The first category is composed of papers that explain the challenges and im-portance of dynamically changing the configuration of the airspace to take into account the changes of traffic, but do not propose any dedicated solution method. This is the case of [9, 19, 32]. This category will be called “Type I” in the following of this chapter.
The second category (called “Type II”) is composed of papers where sector-izations for multiple periods are computed, but without any link between the configurations applied during the different periods. In this case, the problem is equivalent to solving multiple times a classical static sectorization problem with different data input corresponding to the airspace traffic at different time peri-ods, generating sectors with desirable geometry for each period. This is the case of [42, 23, 22, 12, 36, 44]. Such works do not take into account the need for some stability of design. Indeed, air traffic controllers have to adapt to the configura-tion changes, therefore, transiconfigura-tions between configuraconfigura-tions must allow to maintain some level of stability over time.
The third category (“Type III”) regroups papers that use elements of the config-uration of the current period when designing the configconfig-uration of the next period. This is the case of the methods presented in the survey [47]. Seven algorithmic methods were tested on a representation of current day operations in Kansas City Center and compared in terms of delay reduction benefits, traffic pattern com-plexity, and reconfiguration complexity. Compared to the baseline, most airspace design methods reduced delay but increased the reconfiguration complexity with similar traffic pattern complexity results. [34] modeled the dynamic airspace configuration as a multi-periods geometric graph partitioning problem with an objective-function combining five terms: the overload index, sector load
balanc-ing index, transfer traffic index, as well as re-enterbalanc-ing and short-crossbalanc-ing flights indexes. The solution method proposed was an evolutionary algorithm (EA). One key feature of their method compared to previous EA algorithms for airspace sec-torization ([6, 8]) was the concept of non-sharable blocks (SBBs) which identified elementary sectors that were not allowed to be merged, with the expectation that imposing the same SBB from one time period to another would contribute to obtain solutions with some stability over the time horizon. However, no explicit measure or evaluation of the resulting stability was proposed.
The fourth and final category (“Type IV”) is composed of papers that solve the dynamic airspace configuration problem for a planning horizon of multiple time periods, taking into account the reconfiguration complexity resulting from a change of configuration between any two consecutive time periods [9, 4, 3].
The approach, which is currently used in operation combines or splits existing sectors in order to have an optimal configurations of the airspace.
2.1
Major challenges of dynamic sectorization
The airspace design is highly depending on traffic demand and traffic flow, which is a permanently changing process [9]. Therefore, the airspace design must be kept dynamic as a whole and must be quickly reactive for change. Instead of a static airspace layout, a floating airspace baseline is created. The challenge of operations is to create systems that have the same reactivity. The combinatory logic for creating sectors from air blocks and configurations from sectors, taking into account constraints like shapes and division flight levels and their dynamics is beyond the limit of human capabilities. A mathematical optimization tool is required to support this process. It is of highest usefulness to iterate through the airspace design process by applying capacity-simulations. Each iteration still takes about 3 weeks in the current practice due to the fast-time simulation: even if this is much better than in the past, this is still too long. It would be nice to have faster tools with higher reactivity. The high number of simulations and the corresponding flood of data to be analyzed can only be handled with an add-on tool to the fast-time simulator. The full validation of the airspace design process is only possible with real-time simulation, and other operations. Nevertheless it can already be stated that this process is a milestone in Maastricht airspace design. It pre-validates a completely new airspace based on new procedures using fast-time capacity simulations.
The structural elements of current airspace include sectors, routes, and fixes [19]. Current airspace has significant limitations. It is not structured to accommodate automated separation assurance aircraft, airspace boundaries cannot be changed, and controller resources are not interchangeable. The goal of future airspace is to
provide flexibility and structure where it is necessary. The main airspace research areas are: restructuring airspace, adaptable airspace, and generic airspace. The airspace organization should support concepts such as automated separation as-surance. The airspace should change based on demand and weather predictions. The airspace should be as generic as possible so that controllers and facilities will be interchangeable. Based on the current understanding, it now appears that new airspace building blocks may include complex shape (corridors-in-the sky) and it must be dynamic. The mid-term airspace may be divided into high altitude and low altitude airspace. The low altitude airspace can be further divided into struc-tured, and metroplex and super density airspace. The far-term airspace may be divided into four primary regions: airspace for automated separation assurance op-erations, high altitude airspace, super density and metroplex operations airspace, and remaining airspace. When all aircraft become capable of automated separa-tion and spacing assurance, either via ground based or airborne based technologies, the airspace design can be further simplified. In such a case, only arrival-departure corridors may be necessary and the rest of the airspace can be generic and may not need much structure. However, there are a number of research issues that need to be addressed to test the feasibility of mid-term and long-term airspace configuration concepts.
2.2
Dynamic sectorization algorithms (Type I)
The anticipated flight demand increase in the future inspires the research of Dy-namical Airspace Configuration [42]. In [42], a graph-based DAC algorithm was developed aiming at balancing the workload among all sectors and minimizing the coordination workload between adjacent sectors. An experiment is set up to ex-plore how the DAC algorithm handles future traffic expansions. The ASDI data (Aircraft Situation Display to Industry data) of the Kansas center (ZKC) for a good weather day with high traffic volume is used for the current scenario, while the AvDemand tool correspondingly generates double traffic data to simulate the future scenario. Their DAC algorithm generates three different configurations for both the current and future scenarios taking into account of traffic variations. The current configuration in ZKC serves as the baseline. Moreover, the Welch method [43] is used to estimate the traffic capacity for each sector. Results in-dicate that the DAC algorithm is robust when dealing with traffic demand of different scales. In both scenarios, the traffic load for each sector is more balanced in comparison with the baseline. Also, the numbers of capacity violations and boundary crossings are reduced significantly. In the future scenario, the DAC al-gorithm shows more improvement in safety and efficiency, which is in accordance with the motivation of DAC.
A method for partitioning airspace into smaller regions based on a peak traffic-counts metric is described [23]. The three setup steps of this approach consist of creating a flow network flow and creating an occupancy grid composed of grid cells of specified size for discretizing assignment of grid cells to the nodes of the flow network. Both the occupancy grid and the grid cell assignment to nodes are computationally realized using matrices. During the run phase of the method, the flow network is partitioned into two sub-graphs and these two sub-graphs and then partitioned again into two sub-graphs, and so on till a termination criterion is met. Weights of the sub-graphs are computed by summing the number of aircraft in each grid cell associated with the nodes of the sub-graphs at each time. This process is accomplished by using the occupancy and assignment matrices created during the setup step. The final weight is obtained as the maximum count over a time period. Spectral bisection is then used to split the sub-graph with the maximum weight into its two sub-graphs. Recursive application of the spectral bisection method and weight computation results in the final set of sub-graphs. The grid cells associated with each sub-graph then represent the geometry of the associated sector. Results of sectorization of the airspace over the continental United States are provided to demonstrate the merits and the limitations of the method. The weighted-graph technique created larger sectors in regions of light-traffic and smaller sectors in regions of heavy-traffic. Peak traffic-counts in the sectors were found to be within the range of the Monitor Alert Parameters specified in the Enhanced Traffic Management System.The algorithm was used for partitioning the airspace over the United States into 466 sectors, once for each hour of the 24-hour day, using a single day of air traffic data. Along with these desirable features, some limitations and opportunities for refinement of the sectorization algorithm were revealed by these examples. The algorithm generated small sectors that were enclosed within larger sectors. Elongated sectors were created in some instances. Some of the areas of possible refinement are: use of hexagonal cells rather than square cells for synthesis of convex sectors, use of peak traffic-counts rather than the fixed number of sectors as the termination criteria, and use of alternative flow graph structures such as a spanning tree connecting the major airports in the United States.
The Dynamic Airspace Configuration (DAC) concept requires strategically or-ganizing and efficiently allocating airspace [22]. In the current National Airspace System (NAS), sector boundaries have been developed heuristically over decades in light of historical data and analysis. In their previous research, authors of [22], have developped a graph structure based on air route structure to model the en-route airspace over the U.S., and which was partitioned using a spectral clus-tering algorithm. This paper [22] addresses how to generate sectors with desirable geometry using the partitioned graph as an input. The minimum distance con-straints are considered in their two- step algorithm. Instead of converting these
constraints into a mathematical programming problem as in most previous re-searches have done, they treat the constraints satisfaction as a geometric problem. In correspondence to vertices assignments, an algorithm is first proposed that aims to compute non-overlapping convex hulls, while satisfying the constraints. They developed a novel method using the shortest path searching algorithm to create smooth sector boundaries outside the convex hulls, where the desirable boundary is mathematically defined and computed. Finally, the performance of the proposed sectorization algorithm is demonstrated using the Enhanced Traffic Management System air traffic data. In this paper, they have proposed an airspace sectorization algorithm based on their graph model which accurately represents the air route structure in the NAS. The graph model is first partitioned into a set of subgraphs which satisfy the workload capacity constraint for each sector.Important sector constraints are also incorporated into the proposed algorithm.They have solved the minimum distance constraints by adding protection zones to the graph model. In the two-step sectorization algorithm, they firstly compute non-overlapping con-vex hulls,each containing only one subgraph.Then,using a shortest path searching method,they compute desirable sector boundaries in order to check the convexity of the associated sectors.They have validated the performance of four algorithm with real air traffic data.
Another approach presented in [12] consists in forecasting air traffic controller workload and required airspace configuration changes with enough ahead time and with a good degree of realism. For this purpose, tree search methods were combined with a neural network. The neural network takes relevant air traffic complexity metrics as input and provides a workload indication (high, normal, or low) for any given air traffic control (ATC) sector. It was trained on historical data, i.e. archived sector operations, considering that ATC sectors made up of several airspace modules are usually split into several smaller sectors when the workload is excessive, or merged with other sectors when the workload is low. The input metrics are computed from the sector geometry and from simulated or real aircraft trajectories. The tree search methods explore all possible combinations of elementary airspace modules in order to build an optimal airspace partition where the workload is balanced as well as possible across the ATC sectors. The results are compared both to the real airspace configurations and to the forecast made by flow management operators in a French en-route air traffic control
A key limitation when accommodating the continuing air traffic growth is the fixed airspace structure including sector boundaries [36]. The geometry of sectors has stayed relatively constant despite the fact that route structures and demand have changed dramatically over the past decade. Dynamic Airspace Sectorization is a concept where the airspace is redesigned dynamically to accommodate chang-ing traffic demands. Various methods have been proposed to dynamically
parti-tion the airspace to accommodate the traffic growth while satisfying other sector constraints and efficiency metrics. However, these approaches suffer from several operational drawbacks, and their computational complexity increases fast as the airspace size and traffic volume increase. In [36] authors evaluate and identify the gaps in existing 3D sectorization methods, and propose an improved Agent Based Model (iABM) to address these gaps. They also propose three additional models using KD-Tree, Bisection and Voronoi Diagrams in 3D, to partition the airspace to satisfy the convexity constraint and to reduce computational cost. They use a multi-objective optimization approach that uses three objectives: minimizing the variance of controller workload across the sectors, maximizing the average sec-tor flight time, and minimizing the distance between secsec-tor boundaries and the traffic flow crossing points. Experimental results show that iABM has the best performance on workload balancing, but it is restrictive when it comes to the con-vexity constraint. Bisection- and Voronoi Diagram-based models perform worse than iABM on workload balancing but better on average sector flight time, and they can satisfy the convexity constraint. The KD-tree-based model has a lower computational cost, but with a poor performance on the given objectives
Dynamic resectorization is a promising concept to accommodate the increasing and fluctuating demands of flight operations in the National Airspace System [44]. At the core of dynamic resectorization is the definition of an optimal sectoriza-tion. Finding such an optimal sectorization is challenging because it mixes the graph partition problem and NP-hard optimization problem. They use Voronoi diagrams and Genetic Algorithms, and proposes a strategy that combines these al-gorithms with the iterative deepening algorithm. Voronoi diagrams accomplish the graph partition, which then needs to be optimized. By defining a multi-objective cost, the combination of the Genetic Algorithm and iterative deepening algorithm solves the optimization problem. Experimental results show that by setting an appropriate cost, the design can have a balanced workload and low coordination between sectors with dominant flow structure captured. If the capacity is de-fined and incorporated into the cost, the sectorization will lead to a design with increased capacity. The whole process can be finished within a reasonable time period without the need for parallel schemes.With the Voronoi Diagram, the con-vexity requirement is automatically satisfied and the choice of costs is flexible. The sectorization can be encoded as the generating points. Genetic Algorithm is used to perform the multi-objective optimization. The Iterative Deepening Algorithm is applied to expedite the process. Initial results in 2D showed that this strategy is promising for sectorization. This method balanced the workload satisfactorily with a small deviation from average workload, and maintained convex shapes for sectors by the nature of the Voronoi diagram. By lowering the crossing volume and increasing sector flight time, the method captured the flow structure. The
case study on maximizing sector residual capacity shows that increasing capac-ity, which is based on 5/3 sector flight time, has conflicts with the objective of balancing aircraft counts.
2.3
Dynamic sectorization algorithms (Type II)
In [34], authors introduced a Genetic Algorithm based method for sequencing sec-tor configurations composed of two airspace component types Sharable Airspace Modules and Sectors Building Blocks The proposed solution was tested at Ams-terdam UTA and Northern part of Hanover UIR in a Free Routes Environment. Their objective functions and constraints were designed in cooperation with EU-ROCONTROL experts. They included five different parameters in the objective function: workload imbalance among all controlled sectors, the total number of overloads in each controlled sector of the configuration, the transfer traffic be-tween neighboring components, the number of reentry events and the number of short transits inside each sector.
2.4
Dynamic sectorization algorithms (Type III)
The algorithm presented in [5] combines sectors based on a measure of predicted excess capacity in sectors. Such a measure has two components. The first one is a predicted measure of the utilization of a sector. The second one is a measure of the maximum possible safe utilization of a sector, which is also referred to as the capacity of a sector. These components share units and so the predicted excess capacity is the difference between the predicted utilization and the capacity.
There are three main steps in the proposed algorithm:
• Compute the predicted capacity gaps for all possible two-sector combinations in the center.
• Combine the two sectors whose combination has the largest predicted capac-ity gap.
• Repeat until the largest predicted capacity gap is smaller than the minimum capacity gap.
2.5
Dynamic sectorization algorithms (Type IV)
In response to traffic and staffing changes, supervisors dynamically configure airspace sectors by assigning them to control positions.In [4] finite horizon airspace sector
configuration problem models this supervisor decision. The problem is to select an airspace configuration at each time step while considering a workload cost, a reconfiguration cost, and a constraint on the number of control positions at each time step. Three algorithms for this problem are proposed and evaluated: a myopic heuristic, an exact dynamic programming algorithm, and a rollouts approximate dynamic programming algorithm. On problem instances from current operations with only dozens of possible configurations, an exact dynamic programming so-lution gives the optimal cost value. The rollouts algorithm achieves costs within 2% to the optimal solution for these instances, on average. For larger problem instances that are representative of future operations and have thousands of possi-ble configurations, excessive computation time prohibits the use of exact dynamic programming. On such problem instances, the rollouts algorithm reduces the cost achieved by the heuristic by more than 15% on average with an acceptable com-putation time.
[3] presents another algorithm for which two versions were developed. The dif-ference between these versions of the algorithms relates to areas of specialization within centers. Currently, each sector in a center is part of an area of specializa-tion. This algorithm considers that neighboring sectors could only be combined if they are in the same area of specialization. When sector combinations are re-stricted to sectors within the same area of specialization, the algorithm is referred to as the restricted algorithm. This restriction may be relaxed as automation en-ables controllers to control more sectors in a center. There are several strengths of this algorithm. It produces a new sectorization that utilizes air traffic control resources at least as effciently as the original sectorization. It only uses informa-tion currently available in ATC centers. There are several algorithm parameters that can be changed to increase the safety of the resulting sectorization. These parameters also enable users to tailor the algorithm to work with existing opera-tional procedures. In fact, because it combines this configurability with the use of existing sectors and data, this algorithm allows for a systematically more efficient utilization of airspace that can be implemented in the near term. In practice the al-gorithm is executed in less than a second when calculating hour-long combinations for a center with 20 sectors. This algorithm has several weaknesses as well. Using existing sectors as the building blocks for a new sectorization allows for short-term implementation, it restricts the possible airspace configurations and therefore also restricts the efficiency of the resulting sectorizations. Moreover, while this ap-proach will yield more efficient air traffic control resource utilization, it does so by eliminating unused capacity, not by increasing capacity where capacity is lacking. This algorithm also does not guarantee sector convexity in the resulting sectoriza-tion. This analysis has shown that a relatively simple greedy heuristic algorithm can systematically combine airspace sectors to significantly improve the efficiency
of air traffic control resource utilization.A weakness of this algorithm is that it is a heuristic with no guarantee of optimality. The problem faced here can be mapped to a graph theory problem by considering sectors as vertices and each sector’s set of neighbors as defining edges between vertices. The optimal solutions for related problems in graph theory can be found in polynomial time.Air traffic controller supervisors configure available sector, operating position, and worksta-tion resources to safely and efficiently control air traffic in a region of airspace. An algorithm for assisting supervisors with this task is described and demonstrated on two sample problem instances. The algorithm produces configuration schedule advisories that minimize a cost. The cost is a weighted sum of two competing costs: one penalizing mismatches between configurations and predicted air traffic demand and another one penalizing the effort associated with changing configura-tions. The problem considered by the algorithm is a shortest path problem that is solved with a dynamic programming value iteration algorithm. The cost function contains numerous parameters. Default values for most of these are suggested based on descriptions of air traffic control procedures and subject-matter expert feedback. The parameter determining the relative importance of the two com-peting costs is tuned by comparing historical configurations with corresponding algorithm advisories. Two sample problem instances for which appropriate con-figuration advisories are obvious were designed to illustrate characteristics of the algorithm. Results demonstrate how the algorithm suggests advisories that ap-propriately utilize changes in airspace configurations and changes in the number of operating positions allocated to each open sector.
2.6
Conclusion
Current state-of-the-art in dynamic sectorization literature shows the importance of flexible airspaces. The airspace design algorithms must take into account two important objectives. They must adapt sectorization according to traffic demand and there must be stability between consecutive configurations. There exist some methods that solve the DAC problems for multiple periods but they don’t maxi-mize similarity between configurations. They may find solutions that are not ap-plicable in real life because of big changes in different configurations. The second issue is that methods don’t take into account geometry of sectors. They compare consecutive solutions by number of aircraft that has passed from one controller to another if the configuration change is made. Those algorithms may give solutions that have very different shapes of sectors for consecutive periods. If sectors are different then it takes more time until controllers understand the current situation in the airspace. The third problem is that such algorithms can solve only small problems. If we want to solve bigger problems then existing algorithms could be
too slow. We propose a method that solves those three issues.
Before introducing our DAC algorithm, the next chapter describe the complex-ity metrics which have been used for our experiment.
Chapter 3
Airspace Complexity Metrics
In this chapter, air traffic complexity principles are introduced. This chapter is divided into fourth sections. In the first section general introduction of complexity is given. In the second section some previous related works on air traffic complexity metrics are presented. The third section presents the three metrics which has been tested for our evaluation. The fourth section presents the development and the implementation on GPU of the metric based on non linear dynamical system.
3.1
Introduction
In a control sector, the higher the number of aircraft, the more the control workload increases (in a non-linear manner). A limit exists after which the controllers in charge of a control sector are unable to accept additional aircraft, obliging these new aircraft to travel around the sector, moving through less charged neighboring sectors. In this case, the sector is said to be saturated. This critical state should be avoided, as it provokes a cumulative overloading phenomenon in preceding sectors which can back up as far as the departure airport. The saturation threshold is very difficult to estimate, as it depends on the geometry of routes traversing a sector, the geometry of the sector itself, the distribution of aircraft along routes, the performances of the control team, etc. One widely accepted threshold is fixed at 3 conflicts and 15 aircraft for a given sector. This maximum load should not last for more than ten minutes as it places the controllers under considerable stress, with the risk that they will no longer be able to manage traffic in optimal safety conditions.
The control workload measurement is critical in many domains of ATM as it is at the heart of optimization processes. Examples include the following applica-tions: