This is an author-deposited version published in:
http://oatao.univ-toulouse.fr/
Eprints ID: 18698
To cite this version:
Brahimi, Mehdi and Medjaher, Kamal
and Leouatni, Mohammed and
Zerhouni, Noureddine Development of a prognostics and health
management system for the railway infrastructure – Review and
methodology. (2016) In: Prognostics and System Health Management
Conference (PHM-Chengdu), 19 October 2016 - 21 October 2016
(Chengdu, China).
O
pen
A
rchive
T
oulouse
A
rchive
O
uverte (
OATAO
)
OATAO is an open access repository that collects the work of Toulouse researchers and
makes it freely available over the web where possible.
Any correspondence concerning this service should be sent to the repository
administrator: [email protected]
Development of a Prognostics and Health
Management system for the railway infrastructure –
Review and methodology
M. Brahimi
ALSTOM
48 rue Albert Dhalenne, 93400 Saint-Ouen, France FEMTO-ST UMR CNRS 6174 – UBFC/UFC/ENSMM/UTBM
24 rue Alain Savary, 25000 Besançon, France [email protected]
K. Medjaher
Production Engineering Laboratory (LGP), INP-ENIT 47 Av. d’Azereix, 65000 Tarbes, France
M. Leouatni
ALSTOM
48 rue Albert Dhalenne, 93400 Saint-Ouen, France [email protected]
N. Zerhouni
FEMTO-ST UMR CNRS 6174 – UBFC/UFC/ENSMM/UTBM 24 rue Alain Savary, 25000 Besançon, France
Abstract— The Prognostics and Health Management (PHM) can be considered as a key process to deploy a predictive maintenance program. Since its inception as an engineering discipline, a lot of diagnostics and prognostics algorithms were developed and furthermore methodologies for health management and PHM development established. These solutions were applied in a lot of industrial cases aiming a maintenance transformation. In the Aerospace and Military systems, for example, the PHM has been applied more than 20 years with systems and components applications. During this last decade, the railway industry focused on maintenance issues and expressed a special interest on the PHM systems. The maintenance of the railway infrastructure requires considerable resources and an important budget. Many of the developed algorithms and methodologies can be imported to the Rail Transport systems. However, a methodology to develop a PHM system for a railway infrastructure must be established. This paper provides an overview on the key steps to design a PHM system regarding to the specific characteristics of the railway infrastructure. In addition, tools and procedures for each level of the PHM process are reviewed, as well as a summary of the existing monitoring, health assessment and decision solutions for the railway infrastructure.
Keywords- Prognostics and Health Maagement; Railway infrastructure; Condition-Ba sed Maintenance; Predictive Maintenance; Condition monitoring
I.! INTRODUCTION
In recent years, the various actors of the railway sector showed a growing interest for services activities, and especially for remote monitoring, fault diagnostics, embedded sensors techniques and more broadly predictive maintenance solutions. This interest is motivated by the will of the railway operators to reduce operational expenditures such us maintenance operations costs and overhauls, which became a crucial area for competitiveness. In this context, efforts are made for the
development of monitoring systems, diagnostics and prognostics algorithms and decision support solutions, based on Prognostics and Health Management (PHM) techniques. However, some solutions already exist in the market. In 2006, ALSTOM launched a preventive maintenance tool called TrainTracer which captures data from multiple sensor sources allowing monitoring continuously the “health” status of various components. This tool was completed in 2008 by “eTrain” a data gathering system. And few years later, ALSTOM launched a predictive tool called HealthHub which integrates TrainTracer, and supported by various data capture solutions for the Rolling Stock, Infrastructure and Signaling [1]. Similar to TrainTracer a solution for a predictive maintenance facility was developed by Bombardier Transportation called Orbita which generates maintenance requirements automatically from different sensors [2]. SIEMENS also proposes a remote monitoring solution, the EFLEET system, which provides functions such as GPS positioning, faults alarm and operating data reviewing, data records downloading, offline analysis, and diagnostics of the faults and event records, this solution will be completed earlier with RAILability solution for predictive maintenance [1].
This interest in such technologies is aiming an evolution of traditional preventive maintenance policies, essentially based on planned inspections and experts’ knowledge, to a predictive maintenance relying on the current condition of the asset and the estimated future condition to take maintenance decisions and actions. In this way, the PHM can provide solutions to achieve high reliability and availability, and maintenance cost reductions. Many of these solutions can be used in the context of railways by tailoring the existing PHM techniques developed for particular applications in the areas of rotary machines systems, electronic equipment, aerospace and military systems, or even nuclear field or medical field.
However, the development and the deployment of a PHM solution for the railway infrastructure necessitate a good knowledge of the existing techniques in both PHM and railway monitoring techniques.
In addition, the most of the current PHM solutions are adapted to complex mechanical systems or components which are not compatible with the large-scale distributed systems that compose the railway infrastructure. In fact, the railway infrastructure is composed of linear assets which span long distances and are composed of a large population of components. A comparison between a non-liner and a linear asset inspired from [3] is given in the table 1.
TABLE I. ! COMPARAISON BETWEEN A LARGE DISTRIBUTED SYSTEM AND AN INDUSTRIAL SYSTEM [3]
Industrial system (non-linear assets)
Large-scale distributed system (linear assets) Geographically compact system Geographically extended system Uniform environement:
Known and stable
Different environments Changeable environment Small number of complex
components
Large populations of technically unsophisticated
components
These differences imply to define a clear way to implement and design a PHM solution for the railway infrastructure. This involves taking into account all the parameters of a large-scale distributed system for the different levels of PHM system architecture.
This paper provides a review on methodologies and tools used in PHM and a review of technologies and techniques applied for the railway infrastructure monitoring. It is structured as follow, the section II concerns a review on the key steps for the development of a PHM system. The section III presents a proposition for the development of a PHM program regarding the context of the railway infrastructure, then each step of the deployment is discussed considering the recent development in the railway infrastructure monitoring and diagnostics techniques in the section IV. In section V we conclude the paper and give some the perspectives.
II.! DEVELOPMENT OF A PHM SYSTEM
Any product or system is subject to deterioration and failure during its life cycle. A maintenance program is aiming to overhaul or replace equipment after its failure and keep an industrial system or equipment in a state in which it can perform its required function by carrying out periodical actions. Therefore, adopting an efficient maintenance policy can allow the industrials to achieve requirements such as high reliability; maximum availability; enhance safety; and minimize the life cycle cost of the asset since the maintenance is an important part of the lifetime of a system. To do so, the Condition-Based Maintenance (CBM) seems to be an adapted strategy for such requirements. In fact, the CBM is a maintenance program in which the tasks are planned regarding the health status of the physical asset. Set up properly and effectively implemented, it can significantly reduce
maintenance costs by replacing the number of unnecessary planned operations by necessary ones, and ensure an optimization of service by operating only when the current condition of the asset is critical [4]. Gradually, the CBM led to the emergence of the field of the PHM due to the use of new techniques and its broader framework.
A.! PHM architecture
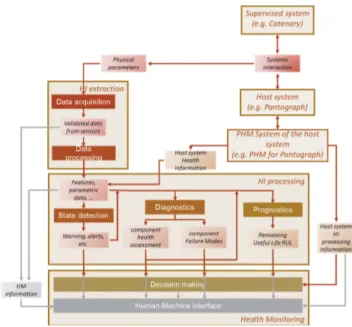
Basically, and according to the ISO 13881-1, the Prognostics (P) in the industrial field refers to “the estimation of time to failure and risk for one or more existing and future failure modes”. The Health Management (HM) refers to a decision making capability to intelligently perform maintenance and logistics activities on the basis of diagnostics / prognostics information [5]. Moreover, it can be defined as an engineering discipline consisting of technologies and methods to assess the reliability of a product in its actual life cycle conditions to determine the advent of failure and mitigate system risk [6] through the supports and enabling prognostics and a condition-based maintenance strategy. Regarding these definitions the PHM can be considered as an enabling discipline for the CBM and it is usually described with the OSA-CBM architecture [7], which is composed of seven layers, as described in the figure 1:
Figure 1. ! PHM architecture adapted from the ISO 13374
This architecture can be depicted into two main areas of development. The first one is related to the health monitoring techniques and includes the Data acquisition (DA), Data manipulation (DM), State detection (SD), Health assessment or Diagnostics (HA) and Prognostics (P) layers. The second one is related to the health management and includes the Decision and the Human-Machine interface. The DA and DM modules are used to collect useful monitoring data and to process it in order to extract features, provide parametric data or build the health indicators (HI). Subsequently, the HI and other outputs from the DM layer are used to detect abnormalities, estimate the current state and perform diagnostics. The prognostic aims to predict the future states using the DM outputs. The classical prognostics output is the Remaining Useful Life (RUL) which is performed with an interval confidence allowing the health monitoring system generating for a component or a sub-system: a failure mode of a subsystem or a component in case
of failure; a subsystem or component health state; and a prediction of the remaining useful life (RUL). The information is sent to the decision module which process them to generate recommendations for the support of the maintenance staff or logistic. This architecture aims to give the basic pillars for a maintenance strategy based on the forecasting of the future health state of the monitored asset.
Nevertheless, the methodologies to develop a PHM solution are not systematics and the selection of the prognostics approach is hard to perceive.
B.! Methodologies for the development of PHM
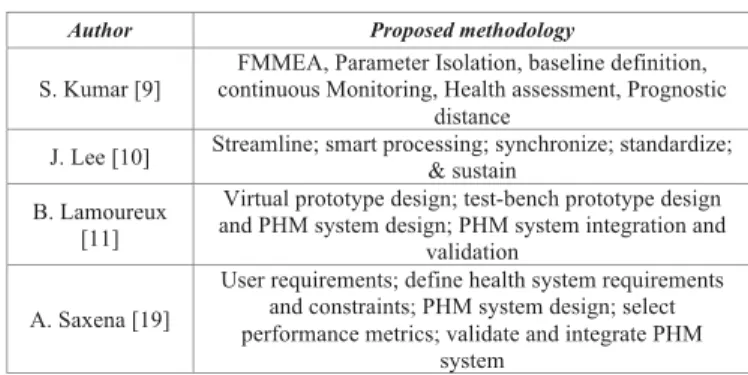
There is no systematic methodology for the development of PHM systems and most of the solutions in the literature are applied to particular cases. In [8] the authors raised the issue of a systematic approach for the research methodology in the field of prognostics and provided the key requirements for the development of PHM system. Moreover, several attempts have been achieved to propose a systematic methodology for particular engineering areas. In the field of electronic products, [9] proposed a methodology based on a hybrid-approach. The 5S development process proposed for e-manufacturing by [10] is based on data-driven approaches and relies on five steps: Streamline, Smart Processing, Synchronize & See, Standardize and Sustain. The Streamline step refers to the identification of the critical component and the prioritization of the monitoring data; the smart processing focusses on the extraction of the useful features to assess the asset and provide health indicators; the Synchronize & See consist of the implementation of a decision tool; then the solution must be standardized and sustained. For aircraft engines, an original methodology named V3-model is proposed in [11]. In this approach the development of the PHM system is done in three steps: 1) the first step is the validation of the health indicators extraction software by using virtual prototype and physics-based models 2) the second step consists on the development of a prototype of the system in order to test the sensors, command unit etc. 3) Then the third step is dedicated to the system deployment, verification and validation. The first step of this method has been applied to aircraft engines and it can be realized as well as the development of the supervised system. More generally, the authors of [19] provides a global approach to generate requirements specifications for PHM system development. The requirement are derived from a cost-benefit-risk analysis, these requirements are used then to flow down to algorithmic level for prognostic specifications definition. Each analysis is revised depending another one to establish a balance between requirements, cost-benefice-risk analysis, and prognostics specifications. Then, for PHM system development, a V-model is proposed for PHM system development. In this model, system requirements and constraints are derived from system to identified subset of components or sub-systems level thorough analyses such as FMECA, HAZOP, or domain experts. Therefore, a PHM system architecture is created and a set of performance metrics is identified. Then the hardware and software solutions for the PHM system are tested and validated at component/subsystem level, then at it is integrated at system level.
TABLE II. ! VARIOUS APPROACHES FOR PHM SYSTEM DEVELOPMENTIN THE LITTERATURE
Author Proposed methodology
S. Kumar [9]
FMMEA, Parameter Isolation, baseline definition, continuous Monitoring, Health assessment, Prognostic
distance
J. Lee [10] Streamline; smart processing; synchronize; standardize; & sustain
B. Lamoureux [11]
Virtual prototype design; test-bench prototype design and PHM system design; PHM system integration and
validation A. Saxena [19]
User requirements; define health system requirements and constraints; PHM system design; select performance metrics; validate and integrate PHM
system
The different design methodologies presented above are summarized in the above table. They all are related to several prognostics approaches, which constitute the key step in the definition of the PHM system architecture. We can classify the prognostics approaches into three main groups: data-driven, model-based and hybrid prognostics.
In data-driven approaches the monitoring data are used to fit models to the degradation mechanisms (e.g., see [12]). These models are based on two overlapping domain [13]: the Computational Intelligence (CI) models such as fuzzy logic and neural networks; the Machine Learning (ML) models such us support vector machines and Bayesian networks. The main driving forces behind this approach are the availability of reliable run-to-failure data and the hypotheses that the features extracted from the monitoring data remains unchanged or evolve according to the component or sub-system condition. This kind of approach can enable the implementation of prognostics models faster with less cost. Nevertheless, the physical behavior of the failure mechanisms is neglected which can imply difficulties to explain failures and consequently generate the suitable recommendations for the maintenance.
The model-based approaches use physics models built from the available knowledge of failure mechanisms of the monitored equipment. The models are often established using Physics of Failure models to capture an understanding of failure mechanisms and evaluate the useful life of the system under actual operating conditions. This approach can be applied at the conception stage of the system or when there is not enough time-to-failure data available, and a good knowledge of the physics of the system and the failure modes is available.
The hybrid approach relies on the combination of the data-driven and model-based approaches and it can be achieved in two ways: 1) the fusion of the results of each model-based and data-driven approaches, this method is called parallel approach; 2) Or using data-driven approaches to tune input parameters for the physics-based model which it’s used to achieve prediction with better accuracy, this method is called series approach.
Several works discussed the methodologies for the development and the deployment of a PHM system and selection of the prognostics approach. In recent literature, [14] provide a generic design framework to select the appropriate approach for the development of a PHM system regarding the
requirements and the available means. Furthermore, the importance of the prognostic approach selection for the development methodology was highlighted. In the context of the railway infrastructure, a methodology for the development of a PHM system must be defined regarding to the system definition and the prognostics approach.
III.! DEVELOPMENT OF A PHM SOLUTION FOR THE RAILWAY INFRASTRUCTURE
The maintenance of the railway infrastructure is a wide field and concerns systems of signaling, electrification system, Track and ballast, and artworks. In our paper we will discuss the maintenance for the catenary and the Track systems which are two main systems of the railway infrastructure. The next paragraphs aim to introduce a development process for the railway infrastructure.
A.! PHM architecture for interoperable systems
Current maintenance polices for the railway infrastructure are based mostly on planned periodic inspections or on experts’ knowledge. However, several monitoring solutions were considered aiming to enable an evolution of traditional maintenance policies to condition-based maintenance and predictive maintenance. Due to the large-scale of the railway infrastructure, inspection trains or commercial trains equipped by remote sensors systems are used to detect defects or faulty components of the track and the catenary. Regarding these assumptions the development of the traditional architecture of a PHM system must take into account this configuration. Indeed, in traditional cases the PHM system is grafted on to the supervised system to extract physical parameters in order to obtain health indicators by achieving data manipulation step. For the railway infrastructure monitoring the sensors are integrated on specific train sub-systems, acceleration sensors can be mounted on the axle-boxes for example [15], or for the catenary monitoring instrumented pantographs can be used to assess the catenary condition [16]. To illustrate this issue a schematic of the systems configuration is given in the Figure 2. In this example HI extraction part (DA and DM layers) is integrated into the host system (Pantograph system) which is in interaction with the supervised system (Catenary).
Figure 2. ! Relationship between the supervised system, the host system and the PHM system
In this case, the host system is considered in a proper operating condition. However, this system is also subject to failures (e.g. flat wheel defect can affect acquisition of the axle-boxes accelerations), this implies that the host system health can impact feature extraction process. Therefore considerations
must be taken into account during the design of and the development of the PHM systems:
-! The host system parameters must be taken in account as input for the different layers of the PHM system as well as the supervised system parameters (train speed, static force of the pantograph, etc.)
-! Whether the host system has a monitoring system or not, criteria regarding the host system condition must be applied to the extracted features.
The underlying idea is that obtainment of the health status of the supervised system is done thanks to the host system; hence, the current condition of the latter one must be integrated as an input in the design of the PHM system. An example of detailed architecture implementation is depicted in the figure 3.
Figure 3. ! PHM architecture adapted for interoperable systems
In this example of architecture the health processing pillar receives data from the PHM host system. We can for example use these data to evaluate the extracted health indicators regarding the health assessment of the host system or it can be used as information for decision making step and the validation of RUL, diagnostics and state information.
Furthermore, in general the design of a PHM system relies to several steps presented below:
-! Identification of the critical component of the supervised system
-! Define the physical parameters to monitor
-! Develop or select associated sensors and acquisition systems.
-! Generate data from a virtual simulator or a test bench in order to depending on the selected approach and process data
-! Select the most appropriate approach for state detection, diagnostics and prognostics regarding the available means.
-! Integrate the developed hardware and software solutions to the final system.
-! Validation and verification of the developed hardware and software solution.
According to the design steps and the proposed architecture, the design of such approach must consider the interaction of the interoperable systems and the evaluation of the extracted features regarding the system operating parameters and the host system state.
B.! Prognostic approach for the railway infrastructure
The selection of the prognostics approach is a key step for the design. This question relies more to the researchers’ knowledge, system expertise and more general the available data and system characteristics.
For the railway infrastructure the lack of run-to-failure data and the changeable environment of the system can constitute an obstacle for the application of a data-driven approach. However, the data collected using inspection trains can lead to understand the evolution of failure mechanisms regarding systems geometry, environmental conditions, rolling stock type and traffic. Moreover, there are several model-based techniques for the track and the catenary based on materials studies, tribology studies [17] or crack growth model [18]. These models take in account the parameters of traffic, applied load, environmental conditions, system parameters, etc. Thereby, a validation and an integration of the physics models in PHM systems applications have to be achieved.
Based on the above considerations the hybrid-approaches can lead to good results for the development of a PHM solution for the railway infrastructure. Indeed, the lack of generality of the model-based approaches can be powered by fitted measurement data. The fitted data can be processed using data-driven approaches in order to take in account the environmental conditions, systems operational data and other parameters.
IV.! PHM SYSTEM FOR RAILWAY INFRASTRUCTURE:
ENABLING TECHNIQUES AND TECHNOLOGIES
In order to test the applicability of the proposed design approach, the existing techniques and technologies for monitoring and fault diagnosis in railway must be reviewed regarding the different steps of PHM system design. This review is done for the Overhead Contact System (OCS) or catenary.
A.! Critical component identification
The main purpose of this task is to identify the major components affecting the performance of the system in term of downtime costs, availability and reliability. There are several approaches to determine components criticality. The most used techniques within the context of the PHM are the FMEA [19], Hazard analysis such as Hazard and Operability Study
(HAZOP) or Preliminary Hazard Analysis (PHA) and expert knowledge or experience feedback.
For systems such as the Track or the Overhead Contact System (OCS) the determination of critical component can be a complicated task due to the size of the asset, the environmental conditions and the system configurations. This implies that the criticality determination for this kind of systems is more relying to experts’ knowledge and feedback experiences. There are some attempts to apply reliability techniques such as FMEA. In [3] a methodology based on FMEA analysis is proposed to determine criticality of OCS system based on failure records for decision-making. Nevertheless, the developed methodology is proposed of inspection intervals definition and the failure modes and mechanisms are not discussed.
The OCS is composed of a lot of components: messenger wire, contact wire, steady arm, insulators, droppers, etc. However, the monitoring of the OCS mostly concentrates on the monitoring of the geometrical parameters of the global system and the wear of the contact wire. Indeed, contact wire is the part of the system which is more subject to wear due to its interaction with the pantograph. Besides, issues pantograph-catenary interaction may generate overheating, arcs and abrasion, which can cause a premature wear of the contact wire.
B.! Parameters to measure
The parameters to be monitored are usually selected according to their relationship with functions affecting safety or that may involve a serious failure. We can also select the parameters depending on their involvement in the operation of the system or even their connection with functions that can lead to lengthy downtimes.
For railway infrastructure monitoring, data such as train speed, localization, and other operational data and systems information data must be taken in account for the health assessment and prognostics development.
Currently we can classify the measured data for the OCS in three main categories: geometrical, mechanical and electrical data. The geometrical data comprise the information about the system dimensions, typical geometrical measurement are the height, the stagger and wear of the contact wire. The mechanical measurements types characterize the dynamical behavior of the catenary allowing the assessment of the pantograph-catenary interaction; examples of these parameters are the contact force between the catenary and the pantograph, the uplift of the contact wire elasticity. The third type of data are the electrical measurement, the arcs parameter is often used to assess the current collection quality, in fact the loss of contact between the pantograph and the catenary implies under certain conditions an arcing between pantograph strips and the contact wire. Continuous contact is necessary to insure continuous power supply to the traction unit.
C.! Sensors selection
In this step we select the most appropriate sensors to monitor the physical parameters that are suitable for the extraction of health indicators. The sensors must be selected
regarding their accuracy, reliability, dependability and cost [20]. In addition, the sensors have to be none intrusive and don’t affect the normal operation of the supervised system.
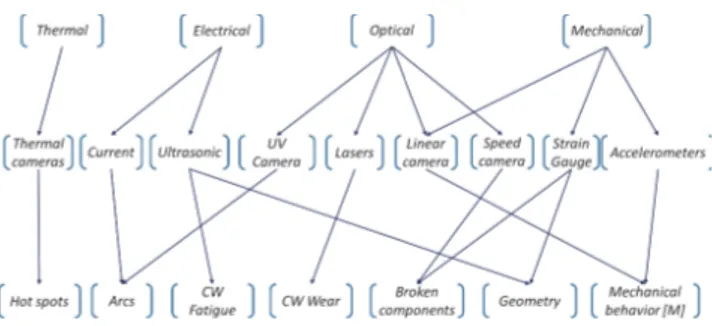
In the field of the railway industry, the inspection cars are equipped with different technologies of sensors; the figure 4 gives a review of the different types of physical parameters and sensors for the OCS system.
Figure 4. ! Sensors for the OCS monitoring
The different sensors presented above are generally installed on the rooftop of an inspection car, on the pantograph, or integrated to the OCS. This involves taking in account the different conditions of work to select the sensors. For example a sensors installed on the rooftop must be waterproof and respect the aerodynamic and electromagnetic compatibility constraints.
D.! Health indicator extraction
This step is divided into two main steps, data acquisition and data processing step. Data acquisition relies to gathering data and signals from different sensors to supervise the critical components.
In data acquisition step we differentiate two main categories of data: event data and condition monitoring data. The first category relies to qualitative data which can be related to event (e.g. breakdown, overhaul, failure, etc.) or tasks performed during the operation of the monitored equipment (e.g. minor repairs, preventive maintenance, change oil, etc.) and also concerning the description of the system. For the OCS, data such as type of pantograph strips, number of poles, overhauls, span length, etc. could constitute event data information. The second category of data is usually the measurements extracted from the sensors that are related to the health status of the monitored equipment. For the OCS system these data can be the contact force between the pantograph and catenary or the arcing rate for example.
The second part of the health indicators extraction is data processing. This step is dedicated to the processing of digital data retrieved from the different sensors. The processing of these data aims to extract features that characterize the current state of the monitored asset in order to build health indicators which can be used for the prognostics or achieve a diagnostics of the equipment. The features extraction is generally based on signal processing algorithms or summary statistics.
There are no general methods to extract the most relevant features; however this step can be divided into two stages: the feature evaluation, and the feature extraction. The figure 5, adapted from [21] illustrates the two stages.
Figure 5. ! Data processing step for RUL estimation
The feature evaluation consist of evaluate the validity of the measured data since these can be subject to errors (human error, sensor failure, etc.). Splitting, sorting and recover are manipulations done during feature evaluation; it can be performed automatically by the use of static or dynamic thresholds or may require manual intervention. Furthermore, tests can be done to evaluate the goodness of the features regarding criteria such as separability of features [21] or even predictability [22]. In the case of interoperable systems with a host system which is different than the supervised system, as discussed in chapter II, evaluation criteria can be set up based on the current status of the host system for the evaluation of feature extraction. The next step after the evaluation of the features is consisting of features extraction and health indicators construction.
In general, the inspections of the OCS are used to assess the current collection quality using the contact force between the pantograph and catenary and arc rate. In this context summary statistics are calculated on the contact force as features to assess the current collection quality.
E.! Health Indicators processing (diagnostics, health assesment, and prognostics)
Achieving diagnostics and prognostics relies to the selected approach. For the OCS diagnostics and prognostics techniques have to be developed based on the available measurement data. Several propositions have been done for health assessment of the OCS component in the literature. These propositions are based on different approaches and the measurement data for the current collection system assessment.
In recent publication [23], a data-driven approach is developed using the power spectral density of arcing signal to extract features and a K-means clustering algorithm to classify arcs regarding their duration. The methodology has been tested on different measured data for multiple train runs. Four clusters have been defined, the two first a cluster contains data without apparition of arcs. The third cluster contains the arcs with duration less than 5ms. The fourth cluster is containing 93% of the arcs with duration higher than 5ms. In this application the
arcs with duration longer than 5ms can be associated with both catenary and pantograph wear, while shorter arcs might indicate contact strip wear.
Diagnostics methodology is developed for OCS defects such as missed dropper, splicers or blocked steady arms in [24].
The methodology is based on the building of adapted wavelet using defect signatures. These adapted wavelets are then used to achieve a continuous wavelet transform in order to measure the similarity of different signal spans and the defect signatures. Later on the methodology was tested with inline test data but has not been successful. There are other uses of the contact force as a physical parameter for the health assessment of the catenary. In [25] the force is used to detect abnormalities in overlap sections and correlate the catenary with its characteristics such as height and tension.
Inspection of the OCS using vision techniques is also another topic of the diagnosis. In [26] high speed cameras are used to detect and count the droppers.
Prediction of contact wire wear is also another topic of study. In [17] a heuristic model of wear is established based on the three contributions of wear for the contact wire: mechanical contribution due to friction, electrical contribution due to energy dissipation relative to the current flow and arc contribution during contact loss between pantograph and catenary. A data-driven approach is proposed in [27], a statistical approach together with an artificial neural network (ANN) model is proposed to make a prediction of the contact wire wear. The statistical approach relies on a large quantity of collected data over a decade. All the influencing operating parameters were highlighted and an attempt to check the wire wear for different measurement runs over the two-year period to test the model.
These different approaches use different sources of data in order to assess OCS health state. The use of arcs measurement allows detecting the welding effect on the contact wires due to long arcs. The processing of contact force was used to detect geometrical defect or broken component. Furthermore, models for the contact wire wear were developed based on data-driven approaches or physics based. Combining all these techniques and validate and assess them may lead to a validation of contact wire wear prediction model and diagnostics methods.
F.! Health Management (Decision and HMI)
The aim of the previous steps is to provide useful information such as RUL or failure modes. The goal of health management is to convert the previous information into useful information to help maintainers to take different type of decisions regarding activities related to logistic supports, maintenance opportunities and maintenance activities, etc.
In the railway infrastructure case, the decision-making step must provide information for a huge amount of component regarding the scale of the systems. Therefore, it necessitate a human machine interface which integrate the attributes and characteristics of each sub-systems and components such as, GPS localization, kilometric point, part number, component type, etc. Development in Building Information Modeling (BIM) [28] process for the railway infrastructure, or information modelling using Object-based 3D models can be a key enabler for the representation of systems information and integrate PHM data for decision. Furthermore, some solutions already exists in the market, such as VisioStack company platform [29] which provide solutions for gathering complete
condition based maintenance data, rail network modeling, and data analytics facilities.
Besides, a decision support must integrate information of characteristics and health status of several systems, like rolling stock speed, health status, etc. The decision rules must integrate the different sources of data in order to generate maintenance decision. The evaluation of the types and data amount must be defined for each step of the PHM system deployment.
V.! PERSPECTIVES AND COLNCLUSION
In this paper, an approach for developing a PHM system for the railway infrastructure is presented and the associated enabling tools were reviewed. Achieving measurement along a large-distributed system is a challenging task. A great deal remains to be done for implantation of automatic diagnostics and prognostics algorithms.
Moreover, inspection of the track and catenary is achieved by dedicated inspection. The use of embedded sensors in commercial trains, stream data from in-line fleet of trains and the development of online data analytics can be a key enabler for an application of PHM system for the railway infrastructure.
REFERENCES
[1]! X. Lu, S. Shan, G. Tang, and Z. Wen, “Survey on the Railway Telematic System for Rolling Stocks,” in Proceedings of the 2015 International Conference on Electrical and Information Technologies for Rail Transportation, vol. 378, Y. Qin, L. Jia, J. Feng, M. An, and L. Diao, Eds. Berlin, Heidelberg: Springer Berlin Heidelberg, 2016, pp. 645–656. [2]! A. Le Mortellec, J. Clarhaut, Y. Sallez, T. Berger, and D. Trentesaux,
“Embedded holonic fault diagnosis of complex transportation systems,” Eng. Appl. Artif. Intell., vol. 26, no. 1, pp. 227–240, Jan. 2013. [3]! O. Duque, A. L. Zorita, L. A. García-Escudero, and M. A. Fernández,
“Criticality determination based on failure records for decision-making in the overhead contact line system,” Proceedings of the Institution of Mechanical Engineers, Part F: Journal of Rail and Rapid Transit, vol. 223, no. 5, pp. 485–494, Sep. 2009.
[4]! A. K. S. Jardine, D. Lin, and D. Banjevic, “A review on machinery diagnostics and prognostics implementing condition-based maintenance,” Mech. Syst. Signal Process., vol. 20, no. 7, pp. 1483– 1510, Oct. 2006.
[5]! K. Javed, “A robust & reliable Data-driven prognostics approach based on extreme learning machine and fuzzy clustering.,” Université de Franche-Comté, 2014.
[6]! S. Mathew, M. Alam, and M. Pecht, “Identification of failure mechanisms to enhance prognostic outcomes,” J. Fail. Anal. Prev., vol. 12, no. 1, pp. 66–73, 2012
[7]! M. Lebold, K. Reichard, C. S. Byington, and R. Orsagh, “OSA-CBM architecture development with emphasis on XML implementations,” in Maintenance and Reliability Conference (MARCON), 2002, pp. 6–8 [8]! S. Uckun, K. Goebel, and P. J. Lucas, “Standardizing research methods
for prognostics,” in Prognostics and Health Management, 2008. PHM 2008. International Conference on, 2008, pp. 1–10.
[9]! S. Kumar, M. Torres, Y. C. Chan, and M. Pecht, “A hybrid prognostics methodology for electronic products,” in Neural Networks, 2008. IJCNN 2008.(IEEE World Congress on Computational Intelligence). IEEE International Joint Conference on, 2008, pp. 3479–3485.
[10]! J. Lee, F. Wu, W. Zhao, M. Ghaffari, L. Liao, and D. Siegel, “Prognostics and health management design for rotary machinery systems—Reviews, methodology and applications,” Mech. Syst. Signal Process., vol. 42, no. 1–2, pp. 314–334, Jan. 2014.
[11]! B. Lamoureux, J.-R. Masse, and N. Mechbal, “Towards an integrated development of PHM systems for aircraft engines: In-design selection
and validation of health indicators,” in Prognostics and Health Management (PHM), 2015 IEEE Conference on, 2015, pp. 1–8. [12]! K. Medjaher, D. A. Tobon-Mejia, and N. Zerhouni, “Remaining useful
life estimation of critical components with application to bearings,” Reliab. IEEE Trans. On, vol. 61, no. 2, pp. 292–302, 2012.
[13]! A. Mosallam, K. Medjaher, and N. Zerhouni, “Component based data-driven prognostics for complex systems: Methodology and applications,” in Reliability Systems Engineering (ICRSE), 2015 First International Conference on, 2015, pp. 1–7.
[14]! J. I. Aizpurua and V. M. Catterson, “Towards a Methodology for Design of Prognostic Systems,” in Annual Conference of the Prognostics and Health Management Society, Coronado, California, USA, 2015. [15]! M. Molodova, Z. Li, A. Nunez, and R. Dollevoet, “Automatic Detection
of Squats in Railway Infrastructure,” IEEE Trans. Intell. Transp. Syst., vol. 15, no. 5, pp. 1980–1990, Oct. 2014.
[16]! S. Kusumi, T. Fukutani, and K. Nezu, “Diagnosis of Overhead Contact Line based on Contact Force,” Q. Rep. RTRI, vol. 47, no. 1, pp. 39–45, 2006.
[17]! G. Bucca and A. Collina, “Electromechanical interaction between carbon-based pantograph strip and copper contact wire: A heuristic wear model,” Tribol. Int., vol. 92, pp. 47–56, Dec. 2015.
[18]! A. Ekberg, E. Kabo, J. C. O. Nielsen, and R. Lundén, “Subsurface initiated rolling contact fatigue of railway wheels as generated by rail corrugation,” Int. J. Solids Struct., vol. 44, no. 24, pp. 7975–7987, Dec. 2007.
[19]! A. Saxena, I. Roychoudhury, J. Celaya, B. Saha, S. Saha, and K. Goebel, “Requirements Flowdown for Prognostics and Health Management,” Proc. AIAA Infotech Aerosp., 2012.
[20]! S. Cheng, M. Azarian, and M. Pecht, “Sensor system selection for prognostics and health monitoring,” in ASME 2008 International Design Engineering Technical Conferences and Computers and Information in Engineering Conference, 2008, pp. 1383–1389
[21]! F. Camci, K. Medjaher, N. Zerhouni, and P. Nectoux, “Feature evaluation for effective bearing prognostics,” Qual. Reliab. Eng. Int., vol. 29, no. 4, pp. 477–486, 2013
[22]! K. Javed, R. Gouriveau, R. Zemouri, and N. Zerhouni, “Features selection procedure for prognostics: An approach based on predictability,” in 8th IFAC International Symposium on Fault Dectection, Supervision and Safety for Technical Processes, SAFEPROCESS’12., 2012, pp. 25–30
[23]! S. Barmada, M. Tucci, M. Menci, and F. Romano, “Clustering techniques applied to a high-speed train pantograph-catenary subsystem for electric arc detection and classification,” Proc. Inst. Mech. Eng. Part F J. Rail Rapid Transit, vol. 230, no. 1, pp. 85–96, Jan. 2016
[24]! J. Massat, “Modélisation du comportement dynamique du couple pantographe-caténaire,” Appl. À Détection Défauts Dans Caténaire Simul. Pantogr.-Catenary Dyn. Interaction–Application Catenary Defect Detect. Ecole Cent. Lyon Dr. Thesis, 2007.
[25]! S. Kusumi, T. Fukutani, and K. Nezu, “Diagnosis of Overhead Contact Line based on Contact Force,” Quarterly Report of RTRI, vol. 47, no. 1, pp. 39–45, 2006.
[26]! C. Petitjean, L. Heutte, V. Delcourt, and R. Kouadio, “Extraction automatique de pendules dans des images de caténaire,” in XXIIe colloque GRETSI (traitement du signal et des images), Dijon (FRA), 8-11 septembre 2009, 2009.
[27]! W. C. Shing, “A survey of contact wire wear parameters and the development of a model to predict wire wear by using the artifical neural network,” 2011.
[28]! C.-S. Shim, K.-M. Lee, W.-S. Son, and J.-W. Moon, “Collaborative Design of High-speed Railway Lines using 3D information models,” IABSE Symp. Rep., vol. 94, no. 9, pp. 55–62, Jan. 2008
[29]! © 2016 VisioStack., (2016). VisioStack - Data Management & Analytics. [online] Visiostack.com. Available at: http://www.visiostack.com/ [Accessed 8 Apr. 2016].
![TABLE I. ! C OMPARAISON BETWEEN A LARGE DISTRIBUTED SYSTEM AND AN INDUSTRIAL SYSTEM [3]](https://thumb-eu.123doks.com/thumbv2/123doknet/3122341.88754/3.892.89.404.390.515/table-i-c-omparaison-large-distributed-industrial.webp)