This is an author-deposited version published in:
http://oatao.univ-toulouse.fr/
Eprints ID: 12170
To link to this article: DOI: 10.1109/LSP.2014.2352362
URL: http://dx.doi.org/10.1109/LSP.2014.2352362
To cite this version:
Besson, Olivier On false alarm rate of matched filter
under distribution mismatch. (2015) IEEE Signal Processing Letters, vol.
22 (n° 2). pp. 167-171. ISSN 1070-9908
O
pen
A
rchive
T
oulouse
A
rchive
O
uverte (
OATAO
)
OATAO is an open access repository that collects the work of Toulouse researchers and
makes it freely available over the web where possible.
Any correspondence concerning this service should be sent to the repository
administrator: [email protected]
On False Alarm Rate of Matched Filter
Under Distribution Mismatch
Olivier Besson, Senior Member, IEEE
Abstract—The generalized likelihood ratio test (GLRT) is a very widely used technique for detecting signals of interest amongst noise, when some of the parameters describing the signal (and possibly the noise) are unknown. The threshold of such a test is set from a desired probability of false alarm and hence this threshold depends on the statistical assumptions made about noise. In practice however, the noise statistics are seldom known and it becomes crucial to characterize under a mismatched distribution. In this letter, we address this problem in the case of a simple binary composite hypothesis testing problem (matched Þlter) when the threshold is designed under a Gaussian assumption while the noise actually follows an elliptically contoured distribu-tion. We also consider the inverse situadistribu-tion. Generic expressions for the assumed and actual are derived and illustrated on the particular case of Student distributions for which simple, closed-form expressions are obtained. The latter show that the GLRT based on Gaussian assumption is not robust while that based on Student assumption is.
Index Terms—Distribution mismatch, elliptically contoured distributions, generalized likelihood ratio test, probability of false alarm.
I. INTRODUCTION ANDPROBLEMSTATEMENT
C
ONTROL of the false alarm rate is a crucial issue in most radar systems, as a mismatch between the presumed (de-signed) probability of false alarm ( ) and the actual one has very detrimental effects in any post-detection step, e.g., target tracking. Usually, a desired is speciÞed and a threshold, as-sociated to a given detection scheme, is computed based on sta-tistical assumptions regarding the data under test. In practice, however, one cannot ensure that the received data will match its assumed distribution, and therefore it is highly desirable that a detection scheme be robust to a possible mismatch between the assumed and the actual data distribution. In this preliminary study, we investigate the relation between the designed and its actual value under distribution mismatch, for a conventional hypothesis testing problem, namely(1) In (1), stands for the signature of the signal of interest and denotes its unknown complex amplitude. is a random noise vector, whose assumed probability density function is
herein considered to be known. The generalized likelihood ratio test (GLRT) for the problem at hand is given by [1], [2]
(2)
The threshold is computed from and thus depends on . Therefore, can be ensured only if is distributed according to . In this letter, we investigate what becomes of when is drawn from . More precisely, we Þrst investigate the usual case where corresponds to a Gaussian distribution while corresponds to an elliptically contoured (EC) distribution [3], [4], [5]. EC distributions have been used in a number of engineering appli-cations, including radar where they encompass the widely used compound-Gaussian model [6]. We refer the reader to [5] and references therein for a detailed discussion. In a second step, we consider the inverse situation, viz. the probability of false alarm of the GLRT based on EC distributed data when applied to Gaussian data. We provide closed-form expressions for the actual versus assumed in the case of Student distributions, and show that the GLRT based on a Gaussian assumption is not robust at all, while the GLRT based on a Student assumption is rather robust.
II. ANALYSIS OFGAUSSIANGLRT (MATCHED FILTER) When follows a complex Gaussian distribution, i.e.,
, and the covariance matrix is known, the GLRT, also referred to as matched Þlter is given by [1], [2], [7] (3)
The probability of false alarm is related to through where the superscript over in-dicates that the probability of false alarm is obtained for a Gaussian distributed .
Our aim is to study the robustness of the test (3) when applied to elliptically distributed . Since we address probability of false alarm in this paper, we consider only hypothesis for which , and we assume that , under , admits the following stochastic representation [3], [4], [5]
(4) where means “as the same distribution as”. In (4), the vector
is uniformly distributed on the complex -sphere, where is the size of vector . This means that can be written as
with . Note that and are independent [3], [8]. is a random positive scalar whose probability density function (p.d.f.) is
where is the so-called density generator of the elliptic distri-bution and is a constant which ensures that integrates
to one. Assuming that is positive deÞnite, the probability den-sity function of , under , is given by
(5) where means “proportional to”. We Þrst examine how robust is the test in (3) when applied to in (4). Let , denote the projection onto , and the projection onto its orthogonal complement. Then, one can write that
(6)
where denotes the complex central chi-square distribu-tion with degrees of freedom (d.o.f.) whose p.d.f. is
and is the complex beta distribu-tion, whose p.d.f. is
Consequently, if the threshold is used as in (3), the actual probability of false alarm is given by (the superscript means that the data follows an EC distribution with as the density generator)
(7)
The previous formula allows one to recover the usual Gaussian case for which , , which yields
(8)
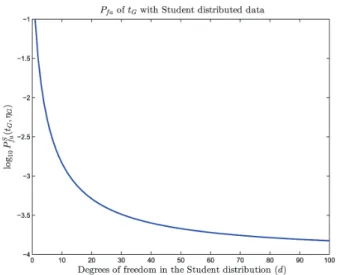
Fig. 1. Actual probability of false alarm of the Gaussian GLRT when follows
a Student distribution, as a function of . and .
The two equations (7) and (8) enables one to relate the actual and assumed . Let us illustrate the following general formula on the speciÞc case of a Student distribution with degrees of freedom, for which and
. Then, one has (9), shown at the bottom of the page, where, to obtain the last line, we made use of [9, 3.194.3]. Therefore, the actual probability of false alarm is related to the one assuming is Gaussian distributed through the relation
(10)
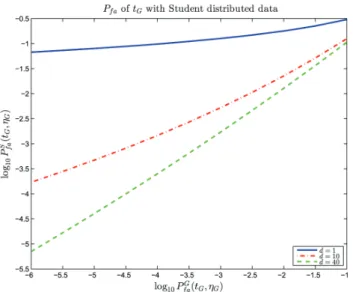
The dependence of versus is illustrated in Fig. 1, for and . Accordingly, Fig. 2 presents versus for various values of . Clearly, the Gaussian matched Þlter is not robust to deviation from the assumed data distribution as the actual can signif-icantly depart from the presumed one, making this detector not desirable in practical situations.
III. ANALYSIS OFEC GLRT
Suppose now that, under , is distributed according to (4). In this case, assuming that is decreasing, the matched Þlter takes the form [10]
(11)
Fig. 2. Actual probability of false alarm of the Gaussian GLRT when follows
a Student distribution, as a function of . Varying . .
Then, using the fact that
(12) it follows that
(13) Consequently
(14)
Since , and is decreasing, we necessarily have and thus
Therefore, the integral in the previous equation is over the do-main . Finally, we get
(15)
Suppose now that is EC distributed with a density generator . Since the distribution of is independent of , the rep-resentation in (13) holds with now
and hence
(16)
For instance, when is Gaussian distributed, and it ensues that
(17)
Let us now apply these general formulas to the case of a Stu-dent distribution with degrees of freedom, for which
and . It is straightfor-ward to show that, in this case,
where . Consequently, is obtained as (18), shown at the bottom of the page. Hence, the threshold can be computed very easily from . Let us ex-amine now what happens if is used with the same threshold
but is now Gaussian distributed. Then, we simply have
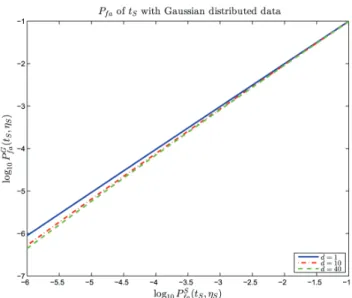
Fig. 3. Actual probability of false alarm of the Student GLRT when follows
a Gaussian distribution. and .
(19) This allows to obtain the following relation between the de-signed probability of false alarm and the actual one
:
(20)
For illustration purposes, in Fig. 3, we display
versus for . Accordingly, Fig. 4 presents versus for various values of . Clearly, the Student matched Þlter, when applied to Gaussian distributed data, exhibits a very good robustness, since the actual is very close to the designed one. In other words, even if the data is truly Gaussian distributed, there is no signiÞcant loss in assuming that it is Student distributed as the resulting will be quite close to the desired one.
Finally, as a last example, consider a mismatch in the degrees of freedom of the Student distribution. In other words, the GLRT is constructed assuming a Student distribution with degrees of freedom (and subsequently the threshold is computed based on this hypothesis) and it is applied to data following a Student distribution with degrees of freedom. Using (7) and (16), and after some straightforward calculations it can be shown that
(21)
Fig. 4. Actual probability of false alarm of the Student GLRT when follows
a Gaussian distribution, as a function of . Varying . .
Fig. 5. Actual probability of false alarm of the Student GLRT (assuming d.o.f.) when follows a Student distribution with d.o.f., as a function of .
, and .
The relation between these two is illustrated in Fig. 5. It can be observed that the GLRT is not very sensitive to a wrong guess of the number of d.o.f. in the Student distribution, which is a desirable feature.
IV. CONCLUDINGREMARKS
In this letter, we considered the (non-adaptive) detection of a signal of interest embedded in noise. We studied the sensi-tivity of the probability of false alarm of the GLRT, when the latter is designed based on some noise distribution, while the data obeys another distribution. More precisely, we considered the case where data is assumed to be Gaussian [respectively elliptically] distributed while it is actually elliptically [respec-tively Gaussian] distributed. Conclusions are that the Gaussian matched Þlter is not robust while the GLRT based on elliptical assumption guarantees a rather close to the designed one. This preliminary work should be pursued and extended to the more relevant case of adaptive detectors.
REFERENCES
[1] L. L. Scharf, Statistical Signal Processing: Detection, Estimation and Time Series Analysis. Reading, MA, USA: Addison-Wesley, 1991. [2] S. Kay, Fundamentals of Statistical Signal Processing: Detection
Theory. Englewood Cliffs, NJ, USA: Prentice-Hall, 1998. [3] K. T. Fang and Y. T. Zhang, Generalized Multivariate Analysis.
Berlin, Germany: Springer-Verlag, 1990.
[4] T. W. Anderson and K.-T. Fang, Theory and applications of elliptically contoured and related distributions Dept. Statistics, Stanford Univ., Stanford, CA, USA, Tech. Rep. 24, Sep. 1990.
[5] E. Ollila, D. Tyler, V. Koivunen, and H. Poor, “Complex elliptically symmetric distributions: Survey, new results and applications,” IEEE Trans. Signal Process., vol. 60, no. 11, pp. 5597–5625, Nov. 2012.
[6] E. Conte and M. Longo, “Characterisation of radar clutter as a spheri-cally invariant process,” Proc. Inst. Elect. Eng., Radar, Sonar Navig., vol. 134, no. 2, pp. 191–197, Apr. 1987.
[7] L. L. Scharf and B. Friedlander, “Matched subspace detectors,” IEEE Trans. Signal Process., vol. 42, no. 8, pp. 2146–2157, Aug. 1994. [8] Y. Chikuse, Statistics on Special Manifolds. New York, NY, USA:
Springer-Verlag, 2003.
[9] I. S. Gradshteyn and I. M. Ryzhik, Table of Integrals, Series and Prod-ucts, ser. ser., A. Jeffrey, Ed., 5th ed. ed. New York, NY, USA: Aca-demic, 1994.
[10] C. D. Richmond, “Adaptive array signal processing and performance analysis in non-Gaussian environments,” Ph.D. dissertation, Mass. Inst. Technol., Cambridge, MA, USA, 1996.