O
pen
A
rchive
T
OULOUSE
A
rchive
O
uverte (
OATAO
)
OATAO is an open access repository that collects the work of Toulouse researchers and
makes it freely available over the web where possible.
This is an author-deposited version published in :
http://oatao.univ-toulouse.fr/
Eprints ID : 18210
To link to this article : DOI : 10.1021/acs.cgd.6b01128
URL :
http://pubs.acs.org/doi/abs/10.1021/acs.cgd.6b01128
To cite this version : Ley-Ngardigal, Kemie and Combes, Christèle and
Teychené, Sébastien and Bonhomme, Christian and Coelho-Diogo,
Cristina and Gras, Pierre and Rey, Christian and Biscans, Béatrice
Influence of ionic additives on triclinic calcium pyrophosphate dihydrate
precipitation. (2016) Crystal Growth & Design, vol. 17 (n° 1). pp. 37-50.
ISSN 1528-7483
Any correspondence concerning this service should be sent to the repository
administrator:
[email protected]
Influence of Ionic Additives on Triclinic Calcium Pyrophosphate
Dihydrate Precipitation
Kemie Ley-Ngardigal,
†,‡Christèle Combes,
*
,‡Sébastien Teychené,
†Christian Bonhomme,
§Cristina Coelho−Diogo,
∥Pierre Gras,
‡Christian Rey,
‡and Béatrice Biscans
††
Université de Toulouse, Laboratoire de Génie Chimique, UMR5503, CNRS-INPT-UPS, ENSIACET, 4 allée E. Monso, CS 84234, 31432 Toulouse Cedex 4, France
‡
CIRIMAT, Université de Toulouse, CNRS, INPT, UPS, ENSIACET, 4 allée E. Monso, CS 44362, 31030 Toulouse Cedex 4, France
§
Sorbonne Universités, UPMC Université Paris 06, CNRS, Collège de France, UMR 7574, Chimie de la Matière Condensée de Paris, 75005, Paris, France
∥
Institut des Matériaux de Paris Centre (IMPC-UPMC-FR2482), 75005 Paris, France
*
S Supporting InformationABSTRACT: Triclinic calcium pyrophosphate dihydrate (t-CPPD) crystals are one of the two polymorphs of micro-crystals that have been found in the joints of patients suffering from pseudogout. However, there is currently no treatment for inhibiting the formation of these crystals, which present a high inflammatory potential. In this context we studied in vitro the precipitation of t-CPPD in a stirred reactor under pH- and temperature-controlled conditions and determined the effect of selected biologically relevant ionic additives (Mg2+, Cu2+,
Fe3+, Zn2+, S
2O32−) on its formation. The results showed that 1
mM Fe3+, Zn2+, or Cu2+induced the most significant changes
by partly inhibiting the crystallization of t-CPPD and favoring
the formation of an amorphous-CPP phase (98 wt %) in the presence of Fe3+or a monoclinic-CPPD phase (78 or 71 wt %,
respectively) in the presence of Zn2+or Cu2+. Correlations between31P solid-state NMR, XRD, and elemental analyses showed
that the additive cations are inserted into the monoclinic-CPPD and/or amorphous-CPP phases. This study, which combines structural, morphological, and elemental analyses, paves the way toward a deeper comprehension of the role of ionic additives in preventing the formation of CPPD crystalline phases, and is a key step in long-term development of an effective therapeutic treatment.
1. INTRODUCTION
Osteoarthritis (OA) and pseudogout are forms of arthritis involving the deposition of microcrystals in the joints. Hydrated calcium pyrophosphates (CPP: Ca2P2O7·nH2O) have been
identified among the deposited microcrystals in the joints of arthritic patients. More precisely, two polymorphs of CPP dihydrate (CPPD: Ca2P2O7·2H2O) have been found in the
joint tissues (cartilage, meniscus) or synovial fluids of patients suffering from pseudogout: the monoclinic (m-CPPD) and triclinic (t-CPPD) phases which both present a high inflammatory potential.1,2The triclinic form is considered the most stable and is the most commonly found in vitro and in vivo.3−5 There is currently no treatment that inhibits the
formation of these CPP crystals, but only treatment helping to limit the inflammatory response and relieve the patient’s pain.6,7 Understanding the mechanisms of formation of CPP in vitro and in vivo and the influence of substances that could potentially inhibit the crystallization of the m-CPPD and t-CPPD phases is a key step in the medium- to long-term development of an effective therapeutic treatment.
Although only two dihydrated forms of CPPD crystals have been detected in vivo (m- and t-CPPD), investigations of other hydrated forms, such as the tetrahydrated CPP (m-CPPT β: Ca2P2O7·4H2O) and especially amorphous CPP (a-CPP:
Ca2P2O7·nH2O with n ≅ 3 to 4), have also been reported in
vitro;8−10these phases are also of interest as potential precursor
phases for the crystalline t- and m-CPPD phases in vitro and in vivo.
There are few studies in the literature on CPP precipitation in the presence of additives.11−15 In addition, these
experimental studies did not provide explanations of the mechanism by which the additives act on the crystallization of different CPP phases. However, the influence of additives or impurities on the crystallization of other compounds has been extensively studied in previous work.16,17 It is known that
of one phase at the expense of another,18they can increase the
nucleation rate at the expense of the growth step, or they can selectively inhibit or promote the growth of particular crystal faces.19
In the case of CPP precipitation, one can classify the potential additives into different categories: (i) additives having a chemical resemblance to pyrophosphate or orthophosphate ions, such as phosphocitrates20 and bisphosphonates;21 (ii) proteins of biological interest, such as osteopontin, a negatively charged bone sialoprotein22 and fetuin A, a blood protein;23
and (iii) cationic additives corresponding to ions already found in the body, such as Mg2+or Fe3+.
These additives may act according to the modes of action described by Mullin24 and Nyvlt and Ulrich.25 Different
adsorption sites exist on the crystal surface (kinks, steps, and edges) and the additive can be adsorbed on one or more of these sites, to create a complex compound with entities/ions at the surface of the crystal or included in the crystal lattice. This can be facilitated if there is a similarity of ionic or molecular structure between the additive and the ions or molecules constituting the crystal (i.e., P2O74−and/or Ca2+in the case of
CPPD compounds). In the present study, only ionic additives will be considered.
Cheng and Pritzker14showed that magnesium ions promote the production of crystals of the m-CPPD phase rather than t-CPPD in a laboratory study where the concentrations of Ca2+
and Mg2+were varied simultaneously during the synthesis of
CPP. These authors performed their tests with three different concentrations of sodium pyrophosphate high enough to obtain sufficient CPP precipitate for analysis. Mandel et al. reported a synthesis protocol of m-CPPD involving magnesium ions which were not present in the synthesis of t-CPPD.26
In our study, besides Mg2+, four other types of biologically
relevant ions (Zn2+, Cu2+, Fe3+, and S
2O32−) were selected as
additives. In human metabolism, iron is present in two different ionic forms: Fe2+(ferrous) and Fe3+(ferric). Fe2+is transported
in the blood by ferroportin, but the element is taken up in tissues and cells as Fe3+, using transferrin (a plasmatic carrier)
and ferritin (an intracellular storage protein).27In addition, it is
known that iron and magnesium are associated with hypomagnesaemia and hemochromatosis diseases which are related to premature osteoarthritis.28,29 In hemochromatosis joint disease, measurements of serum ferritin have proven to be useful in disease detection.30Furthermore, previous studies on
crystal growth have shown that the higher the charge state of the ion is, the more pronounced is the effect of this ion on crystallization.24 Indeed, if Fe2+ were used in this study, it
would be difficult to stabilize and to prevent its oxidization in solution at high temperature (e.g., 90 °C) and acidic pH. Therefore, Fe3+was chosen in the present study.
Among the other ions of interest, thiosulfate (S2O32−) was
previously studied and displayed a reasonable efficiency in the treatment of renal or vascular calcifications.31−33This ion was
selected to determine its influence, if any, on the formation of CPP involved in osteoarthritis.
The objective of this study is to synthesize t-CPPD in vitro through a precipitation process in a stirred reactor under pH-and temperature-controlled conditions pH-and to determine the effect of the selected ionic additives on its precipitation. We do not intend on mimicking in vivo conditions for CPPD polymorph precipitation (it seems difficult at this stage, owing to the lack of information we have on these systems at the onset of CPPD formation) but we aim to evaluate and
compare the effect of various biologically relevant ionic additives while keeping all the other synthesis parameters identical to the t-CPPD reference synthesis (without additive). The effect of these different ions will be thoroughly investigated by means of a set of complementary character-ization techniques: X-ray diffraction, Fourier-transform infrared (FTIR) spectroscopy, Raman spectroscopy, solid-state nuclear magnetic resonance (solid-state NMR), scanning electron microscopy, and elemental analysis by inductively coupled plasma spectrometry.
2. MATERIALS AND METHODS
2.1. Materials. Anhydrous potassium pyrophosphate (K4P2O7)
was obtained by heating potassium hydrogen phosphate dihydrate (K2HPO4·2H2O, VWR, purity: 100%) at 400 °C for 4 h, and was used
to prepare the pyrophosphate reagent solution (rs). The other precipitating reagents, i.e., calcium nitrate tetrahydrate (Ca(NO3)2·
4H2O, Carlo Erba, purity: 97%), acetic acid (VWR, purity: 100%), and
ammonia aqueous solution (VWR, 30%), were used without undergoing further purification.
Commercial salts of zinc acetate dihydrate (Zn(CH3COO)2·2H2O,
Fisher Scientific, purity: 99.5%), iron chloride hexahydrate (FeCl3·
6H2O, VWR, purity: 98%), magnesium chloride hexahydrate (MgCl2·
6H2O, VWR, purity: 100%), copper nitrate hydrate (Cu(NO3)2·
2.5H2O, Alfa Aesar, purity: 98%), and sodium thiosulfate pentahydrate
(Na2S2O3·5H2O, VWR Prolabo, purity: 99.5%) were used as additives.
All the solutions used for performing precipitation by the double decomposition method were prepared by dissolving the salts in ultrapure water (18.2 MΩ.cm).
2.2. Experimental Setup for Precipitation in the Absence or Presence of Ionic Additive. Pure t-CPPD, m-CPPD, and a-CPP reference samples for this study, i.e., without any additive, were synthesized by double decomposition precipitation by simultaneously adding, at controlled flow rate (2.25 mL.min−1), a potassium
pyrophosphate reagent solution (rs) and a calcium nitrate reagent solution (rs) into an ammonium acetate buffer solution (b) at controlled temperature and pH. This method of synthesis was adapted from that published by Gras et al.10 and implemented in a stirred reactor in order to study the effect of the ionic additives under improved control of conditions (pH, temperature, and stirring/ mixing). The pure CPP phase obtained by this method depends on the chosen combination of pH and temperature as reported inTable 1.
The precipitation reaction involved in the precipitation of the t-CPPD or m-t-CPPD phase is
+ + → ·
+ −
2 Ca2 P O2 74 2 H O2 Ca P O 2H O2 2 7 2
Reagent solutions were prepared at room temperature by dissolving K4P2O7(8.70 × 10⁻³mol) or Ca(NO3)2·4H2O (1.74 × 10⁻²mol) in
115 mL of ultrapure water to respectively prepare the pyrophosphate and calcium reagent solutions (rs). A buffer solution (b) of ammonium acetate was prepared from a mixture of acetic acid and ammonia in water: mmonia solution was poured into the acetic acid solution to reach the desired pH (i.e., 3.6 for t-CPPD and 5.8 for m-CPPD or a-CPP).
The experiments were carried out in a 500 mL double-jacketed Pyrex glass round-bottomed crystallizer. This tank was equipped with four baffles, a lid, and a pH probe (PHC3001−8 Radiometer Analytical) connected to a pH-meter (PHM220 Radiometer
Table 1. Selected Temperature and pH Conditions for the Synthesis of the Various Pure Reference CPP Phases According to Gras et al.10
CPP phase synthesized t-CPPD m-CPPD a-CPP Temperature 90 °C 90 °C 25 °C pH 3.6 5.8 5.8
Analytical). Temperature control was provided by a cryostat (AD15R-30, VWR) connected to an external temperature sensor (PT100, VWR). A stirrer (Propeller Stirrer Shafts, Bola) fixed to a motor (RW 20 digital, IKA) was used to ensure a homogeneous mixture. 100 mL of the cationic and anionic reagent solutions were simultaneously added at a constant flow rate (2.25 mL.min−1) in the buffer solution
(200 mL) by means of two syringe pumps (Harvard Apparatus PHD 2000) (Figure 1). At the end of the addition of the reagent solutions,
an aging step was performed at the selected temperature (90 °C for m-CPPD and t-m-CPPD or 25 °C for a-CPP precipitation) for 10 min under stirring. The precipitate was then filtered on a Buchner funnel and washed with 1200 mL of deionized water before being dried in an oven at 37 °C for at least 12 h. Finally, the samples obtained were stored at ambient temperature in a sealed container to avoid any contamination.
The effect of various ionic additives (A) on t-CPPD precipitation was investigated at 90 °C and pH 3.6, i.e., the combination of temperature and pH corresponding to the formation of the t-CPPD phase.10The ionic additive was introduced into the reactor via two
routes: (i) the additive salt was dissolved at different concentrations in the buffer solution (b, placed in the reactor), or (ii) it was dissolved into one of the reagent solutions (rs, placed in a syringe pump): in the pyrophosphate reagent solution for experiments with the anionic additive (S2O32−) or in the calcium reagent solution for experiments
with cationic additives (Mg2+, Cu2+, Fe3+, Zn2+).
The concentrations tested for each ionic additive were chosen to be in the range of those found in human blood plasma (1 mM of dissociated Mg2+, 0.002 to 0.04 mM Fe)34−37or in blood components
(0.020 to 0.030 mM Zn2+ in blood plasma),38 except for sodium
thiosulfate, which is not naturally present in the human body. It is important to note that for some of these ions, their concentrations can vary in the human body, such as Cu2+, the concentration of which is
different in sweat (18.10 ± 3.90 μM Cu2+in sweat from the arm), in
serum (0.00 μM Cu2+for a healthy patient, 0.64 ± 1.10 μM Cu2+for
an osteoarthritic patient), and in synovial fluid (1.10 ± 1.65 μM Cu2+
for an osteoarthritic patient).39
The quantities of ionic additives to be introduced into the buffer (b) or a reagent solution (rs) placed in a syringe pump were calculated with respect to the total volume of the solution within the reactor at the end of the precipitation: 0.10 and 1.00 mM for Zn2+, Mg2+, or
Cu2+; 0.03, 0.10, and 1.00 mM for Fe3+; and 1.00 and 5.00 mM for
S2O32−when the additive was introduced into the buffer (b). When
the additive was introduced into one of the reagent solutions (rs), the concentrations tested for each ionic additive were 0.10 and 1.00 mM.
All experiments were performed at least in duplicate.
2.3. Characterization of the Synthesized Powders. Each synthesized sample was characterized by powder X-ray diffraction (XRD), FTIR and Raman spectroscopy, and scanning electron microscopy (SEM). In addition, elemental analyses were performed by inductively coupled plasma optical emission spectrometry (ICP-OES) on a solution of each sample.
The powder X-ray diffraction data were collected with a Bruker D8 Advance diffractometer equipped with a Bragg−Brentano θ−θ geometry and a copper anode (λ (Cu Kα1) = 1.54060 Å and λ (Cu
Kα2) = 1.54439 Å). The X-ray diffraction patterns were obtained for a
range of 2θ angles from 5 to 50° with a step of 0.2°. Figure 1.Standard experimental setup for the precipitation in a stirred
tank at controlled temperature, pH, flow rate, and mixing.
Figure 2.XRD patterns of m-CPPD and t-CPPD reference phases and of samples synthesized in the presence of additives at various concentrations (0.10 or 1.00 mM for Mg2+, Zn2+, or Cu2+; 0.03, 0.10, or 1.00 mM for Fe3+; and 1.00 or 5.00 mM for S
2O32−) initially present in the buffer solution
A semiquantitative study was performed on the XRD data obtained for each synthesized sample using the TOPAS software according to the methods of Scarlett and Madsen40 and Madsen et al.41 which
allowed the determination of the relative proportion (wt %) of m-CPPD, t-m-CPPD, and a-CPP phases. This method, named the Partial or No Known Crystal Structure method (PONKCS), is a direct approach, where the amorphous contribution to the pattern is used to directly estimate its proportion. A ±1 wt % accuracy for the relative weight proportion can be expected with the PONKCS method.41
FTIR spectra were recorded with a ThermoNicolet 5700 Fourier-transform infrared spectrometer in the 4000−400 cm−1range with
64-scan accumulation in transmission mode and a ±4 cm−1resolution
using powder samples in KBr pellets (2 mg of sample in 300 mg of KBr).
Elemental analyses were performed on aqueous solutions of the dissolved samples using ICP-OES (Ultima2 spectrometer, HORIBA Jobin Yvon). Each sample was analyzed in triplicate.
Scanning electron microscopy (SEM) micrographs were obtained using a Leo 435 VP microscope. The samples were silver-plated with an evaporator (Scancoat Six, Edwards) before observation.
Thermogravimetric analyses (TGA-DTA) were performed on some of the samples using a Setaram Setsys Evolution instrument, with a heating rate of 5 °C per minute, starting at 25 °C up to 1000 °C.
Complementarily to the XRD analyses, for some of the synthesized samples, further structural investigations were performed using 31P
magic-angle spinning (MAS) NMR. Data were recorded using a 700 MHz Bruker AVANCE III spectrometer, equipped with a 4 mm Bruker MAS probe. A MAS frequency of 14 kHz was used. The chemical shifts were referenced to H3PO4. The main purposes of these
experiments were (i) to measure the T1(31P) relaxation times in order
to evaluate the impact of the cations added in the precipitating medium, and (ii) to record fully relaxed31P NMR spectra in order to
quantify the involved phases. Briefly, a saturation-recovery experiment under fast MAS was implemented as follows: saturation 31P pulses
were followed by a delay ranging from 0.25 to 720 s, and a final31P
90° pulse of 5 μs. Spinal-64 1H decoupling (70 kHz) was applied
during acquisition.42 Prior to all experiments, the magic angle was carefully set in order to obtain the best31P MAS resolution, avoiding
the reintroduction of any CSA (chemical shift anisotropy) or dipolar interaction which would broaden the spectra. Four scans were usually used.
3. RESULTS AND DISCUSSION
3.1. Influence of Ionic Additives Initially Present within the Buffer (b) Solution: Qualitative and Semi-quantitative XRD Study. The X-ray patterns of the CPP reference sample (prepared in the absence of additive) and of the CPP samples synthesized in the presence of Mg2+, Zn2+,
Fe3+, Cu2+, or S
2O32− ions initially present at different
concentrations in the buffer solution within the reactor are shown inFigure 2. The results of the semiquantitative analysis (relative weight proportion of m-CPPD, t-CPPD, and a-CPP phases for all synthesized samples) of these XRD data are reported inTable 2. We observed that the method of synthesis in a stirred reactor at pH 3.6 and 90 °C and without additives led to the precipitation of the t-CPPD phase (reference compound) and that no additional crystalline phase could be detected using XRD (as compared with the JCPDS No. 00− 041−0488 XRD reference data for the t-CPPD phase). However, it appeared that this reference t-CPPD sample was not fully crystallized (93 wt % of t-CPPD) and that it included a small proportion (7 ± 1 wt %) of the a-CPP phase (Table 2). The effect of maturation time during the synthesis of t-CPPD and m-CPPD phases has yet been investigated; the character-ization of the precipitates formed during the synthesis from 3 min up to the end of the precipitation (about 1 h) showed that the phases were formed from the beginning and did not evolve
(unpublished results). Additional evolution tests have been made at 37 °C, in solution, for 1 month for t-CPPD and m-CPPD phases, and no alteration was detected.
The composition of the samples synthesized in the presence of ionic additives showed the characteristic peaks of t-CPPD (especially at 10.96° ± 0.02 and 12.59° ± 0.02) and a more or less intense additional diffraction peak at about 2θ = 12.03° ± 0.02 characteristic of the m-CPPD phase ((110) Bragg peak43), indicating that this latter phase also formed when the ionic additives tested were present, except in the case of a low concentration of Mg2+ (0.10 mM) (Figure 2). The relative
weight percentage of m-CPPD was approximately 0% in the absence of ionic additive, but increased from 3 ± 1 wt % up to 75 ± 1 wt % in the presence of 1.00 mM of S2O32−or Zn2+,
respectively (Table 2). We can also clearly observe a dose-dependent effect (by comparison of the relative peak intensities for 0.10 and 1.00 mM of additive) for each ionic additive except for S2O32−: in the case of a higher concentration (1.00 mM) of
Fe3+, Zn2+, or Cu2+we observed that the diffraction peaks for
the t-CPPD phase were almost absent, indicating that the major crystalline phase in these samples was m-CPPD (37, 75, and 60 wt %, respectively). The dose-dependent effect appeared to be less pronounced in the presence of Mg2+than in the presence
of Fe3+, Zn2+, or Cu2+and was negligible for S
2O32−: in both
cases (Mg2+and S
2O32−) the major crystalline phase observed
remained t-CPPD (from 69 up to 90 wt %).
Furthermore, it can be noted that the relative proportion of the amorphous phase increased significantly in the presence of 1.00 mM of Zn2+(20 ± 1 wt %) or Cu2+(36 ± 1 wt %). The
greatest effect was observed for 1.00 mM of Fe3+(62 ± 1 wt
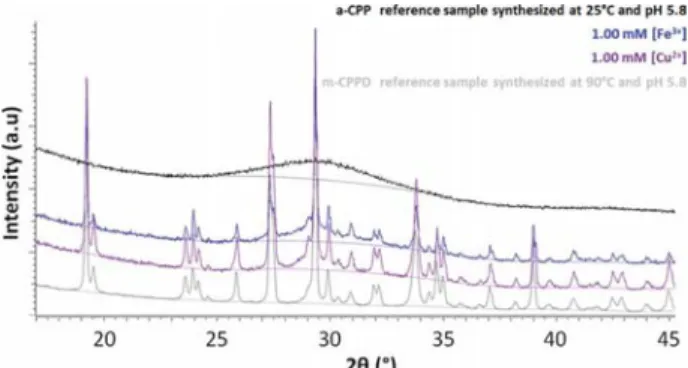
%). The presence of an amorphous phase from 5 up to 62 ± 1 wt % depending on the ionic additive present in the precipitating medium, is supporting the observation of a more or less important diffuse halo on the XRD pattern (Figure 3). Like the pure CPP reference compound, the fraction of a-CPP phase detected is probably associated with around 3 to 4 water molecules.8−10
These results showed that 1.00 mM Fe3+, Zn2+, or Cu2+
induced the most significant changes related to the presence of the m-CPPD and a-CPP phases: the presence of 1.00 mM of Zn2+, Cu2+, or Fe3+ions partly inhibited the crystallization of
t-Table 2. Relative Weight Proportion (wt %) of the CPP Phases (m-CPPD, t-CPPD, and a-CPP) Determined from the XRD Data for the Samples Precipitated in the Presence or Absence of Ionic Additives Initially Introduced in the Buffer Solution (Denoted (b) in the Main Text)s
ionic additive concentration in the
precipitation medium m-CPPD(wt %) t-CPPD(wt %) (wt %)a-CPP without additive (reference) 0 ± 1 93 ± 1 7 ± 1 [S2O32−] = 1.00 mM 3 ± 2 90 ± 1 7 ± 1 [S2O32−] = 5.00 mM 3 ± 1 89 ± 1 8 ± 1 [Mg2+] = 0.10 mM 1 ± 1 94 ± 1 5 ± 1 [Mg2+] = 1.00 mM 26 ± 1 69 ± 1 5 ± 1 [Fe3+] = 0.03 mM 4 ± 1 89 ± 1 7 ± 1 [Fe3+] = 0.10 mM 14 ± 1 80 ± 1 6 ± 1 [Fe3+] = 1.00 mM 37 ± 1 1 ± 1 62 ± 1 [Zn2+] = 0.10 mM 6 ± 1 84 ± 1 10 ± 1 [Zn2+] = 1.00 mM 75 ± 1 5 ± 1 20 ± 1 [Cu2+] = 0.10 mM 4 ± 2 93 ± 1 3 ± 1 [Cu2+] = 1.00 mM 60 ± 1 4 ± 1 36 ± 1
CPPD and favored the formation of (i) a-CPP phase (62 ± 1 wt %) in the presence of Fe3+, and (ii) m-CPPD phase (75 ± 1
wt %) in the presence of Zn2+. For the lowest concentrations of
Zn2+, Cu2+, or Fe3+ ions (0.10 mM), t-CPPD remained the
major phase in the precipitated samples.
All these results demonstrated a major effect of 1.00 mM of Cu2+, Zn2+, and Fe3+ on t-CPPD crystallization, but did not
allow the detection of pure crystalline phases of magnesium, zinc, iron, or copper pyrophosphate that may have precipitated, considering the limit of detection (2%) of the XRD analysis. Assuming that all the cationic additives (A) involved in the synthesis had precipitated as A-pyrophosphate salts, we would have expected a contribution of 2.6% (molar) or 2.0 to 3.1 wt % of this compound depending on the additives (Zn2+, Cu2+, or
Mg2+) or 4.0% (molar) or 3.9 wt % of iron pyrophosphate
(with Fe/Pyro = 4/3 for electrical neutrality of the solid), which would have been detectable by XRD.
Moreover, after carefully checking the unit-cell parameters calculated from the XRD pattern data, we can confirm that there is no significant difference from the unit-cell parameters of the reference CPPD phases already published.10
Further structural investigations were performed by31P
solid-state NMR analysis to provide more information on the phases that precipitated in the presence of additives via the chemical
shift 31P and relaxation time T
1(31P) data (see Section 3.3).
Indeed T1 (the longitudinal relaxation time) is a parameter,
which is sensitive to the potential presence of paramagnetic ions, such as Cu2+and Fe3+, in the precipitated CPPs.
3.2. Influence of Ionic Additives Initially Present in One of the Reagent Solutions (rs): Qualitative and
Semiquantitative XRD Study. Figure 4 shows the XRD
patterns of CPP samples synthesized with 1.00 mM of the selected ionic additives initially present within the cationic or anionic reagent solution (rs). The results of the semi-quantitative analysis (relative weight proportion of m-CPPD, t-CPPD, and a-CPP phases for all synthesized samples) of these XRD data are reported inTable 3.
We can observe that the presence of 1.00 mM of Mg2+or
S2O32− ions did not lead to significant changes in the sample
composition, which contained mainly t-CPPD (91 wt %), a-CPP (6 wt %), and m-a-CPPD (3 wt %). The results reported in
Table 3indicate the determinant effect of the presence of 1.00 mM of Fe3+, Zn2+, or Cu2+ ions on the composition of the
synthesized samples: Zn2+or Cu2+both favored the formation
of m-CPPD (71 and 78 wt %, respectively), a smaller amount of a-CPP (25 and 20 wt %, respectively) and a very low proportion of t-CPPD (4 and 2 wt %, respectively). On the other hand, Fe3+completely inhibited the crystallization of the
t-CPPD and m-CPPD phases: the samples synthesized in the presence of 1 mM of Fe3+were mostly amorphous (98 wt %).
The number of water molecules associated with this amorphous
Figure 3.XRD patterns (for 2θ = 17−45°) of the m-CPPD and a-CPP reference compounds and the samples synthesized in the presence of 1.00 mM Cu2+or Fe3+initially present in the buffer (b) solution. Solid
line: halo corresponding to a-CPP.
Figure 4.XRD patterns of m-CPPD and t-CPPD reference phases, and of samples synthesized in the initial presence of ionic additives in one of the reagent solutions (rs), leading to a 1 mM ionic additive concentration in the buffer solution at the end of the experiment.
Table 3. Relative Weight Percentage of the CPP Phases (m-CPPD, t-(m-CPPD, and a-CPP) Present in the Samples Synthesized in the Presence or Absence of Ionic Additives Initially Introduced into the Reagent Solution (rs)
ionic additive concentration in the
medium of precipitation m-CPPD(wt %) t-CPPD(wt %) (wt %)a-CPP without additive (reference) 0 ± 1 93 ± 1 7 ± 1 [S2O32−] = 1.00 mM 3 ± 1 91 ± 1 6 ± 1
[Mg2+] = 1.00 mM 4 ± 2 90 ± 1 6 ± 1
[Fe3+] = 1.00 mM 2 ± 1 0 ± 1 98 ± 1
[Zn2+] = 1.00 mM 71 ± 1 4 ± 1 25 ± 1
CPP phase (3.2 ± 0.1, for 1 mM of Fe3+(rs) sample),
determined by ATG analysis, was lower than those reported for pure a-CPP reference compound,8−10but they were still in the
range 3−4.
In addition, we observed that no crystalline phases of magnesium, zinc, iron, or copper pyrophosphates coprecipi-tated. As previously indicated for the samples precipitated using the (b) protocol, if present in the samples the A-pyrophosphate phases would have been detectable.
As in the case of ionic additives initially present in the buffer solution, presented inFigure 3, the presence of a more or less prominent diffuse halo around 2θ = 30°, especially for samples prepared in the presence of Zn2+, Cu2+, or Fe3+in the calcium
reagent solution (data not shown) testifies to the presence of an amorphous phase.
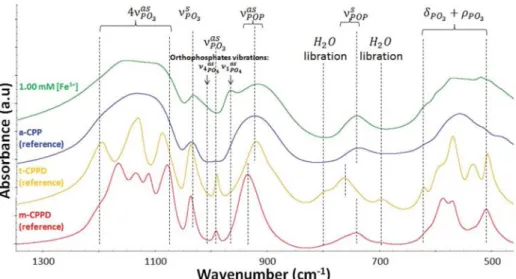
Complementary FTIR spectroscopic analysis of the samples formed in the presence of 1.00 mM Fe3+ was performed to
further investigate their composition. The spectra of this sample and that of reference a-CPP10are presented inFigure 5. All in all, the spectra were quite comparable. The presence of the νPOPas
and the νPOPs vibration modes confirmed the presence of
pyrophosphate groups in an amorphous phase. A slight increase of the absorbance at 960 cm−1(ν
1PO4
as ) and 1010 cm−1(ν 4PO4 as )
seems to indicate the presence of a small proportion of poorly or noncrystalline calcium orthophosphate.44,45 Furthermore,
the splitting of the peaks corresponding to the 4νPO3as , νPO3as , and
δPO3+ ρPO3 vibration modes confirms the presence of a small
amount of a crystalline phase of CPPD without the possibility to clearly identify which CPPD phase (triclinic or monoclinic) is present due to the low proportion of this crystalline phase in this sample (2 wt % of m-CPPD evaluated by XRD, seeTable 3), and also due to important band broadening characteristic of the presence of the a-CPP phase. Complementary analysis by Raman spectroscopy was performed and also confirms this result (data not shown).
3.3. Complementary Elemental, Morphological, and Structural Analyses. 3.3.1. Elemental Analyses.The results of the elemental analysis of samples precipitated in the absence or presence of ionic additives (A) are reported inTable 4. We note that whatever the mode of introduction (b or rs) of the cationic additive, the lowest A/Ca and A/P ratios (for 1 mM Mg2+(rs): 6.7 × 10⁻³ and 7.0 × 10⁻³, respectively) were
obtained for samples precipitated in the presence of Mg2+.
These ratios were the lowest in the case of anionic additives (A/Ca = 5.8 × 10⁻³and A/P = 5.9 × 10⁻³for 1.00 mM S
2O32−
Figure 5.FTIR spectra of reference m-CPPD, t-CPPD, and a-CPP phases and of the sample synthesized in the presence of 1 mM Fe3+present
initially in the calcium reagent solution, denoted (rs) in the main text. The different vibrational modes of the molecules, stretching (ν), bending (δ), and rocking (ρ), respectively, symmetric (s) or antisymmetric (as), are indicated.
Table 4. A/Ca, A/P, Ca/P, and (Ca+A)/P or Ca/(P+A) Molar Ratios Calculated with Concentrations of Ca, P, and Ionic Additives (A) Determined by ICP-OES Analyses of the Samples Synthesized in the Presence or Absence of the Ionic Additive Initially Present in the Reagent Solution (rs) or in the Buffer Solution (b)
ionic additive concentration in the precipitation medium A/Ca A/P Ca/P (Ca+A)/P Ca/(P+A) without additive (reference) 1.03 ± 0.03 - -1.00 mM [S2O32−] (rs) (5.8 ± 0.2) × 10−3 (5.9 ±1.1) × 10−3 1.01 ± 0.14 - 1.01 ± 0.14 5.00 mM [S2O32−] (rs) (6.0 ± 0.5) × 10−3 (6.4 ± 0.6) × 10−3 1.06 ± 0.06 - 1.06 ± 0.06 1.00 mM [S2O32−] (b) (5.9 ± 0.3) × 10−3 (6.2 ± 0.4) × 10−3 1.04 ± 0.10 - 1.03 ± 0.10 1.00 mM [Mg2+] (rs) (6.7 ± 0.6) × 10−3 (7.0 ± 0.6) × 10−3 1.04 ± 0.09 1.05 ± 0.10 -1.00 mM [Mg2+] (b) (9.5 ± 2.0) × 10−3 (9.1 ± 1.9) × 10−3 0.95 ± 0.09 0.96 ± 0.10 -1.00 mM [Fe3+] (rs) (2.7 ± 0.2) × 10−2 (3.1 ± 0.3) × 10−2 1.13 ± 0.08 1.16 ± 0.08 -1.00 mM [Fe3+] (b) (4.9 ± 0.4) × 10−2 (3.9 ± 0.5) × 10−2 0.80 ± 0.04 0.84 ± 0.05 -1.00 mM [Zn2+] (rs) (2.8 ± 0.5) × 10−2 (2.6 ± 0.4) × 10−2 0.95 ± 0.05 0.98 ± 0.06 -1.00 mM [Zn2+] (b) (2.8 ± 0.1) × 10−2 (2.6 ± 0.1) × 10−2 0.93 ± 0.05 0.95 ± 0.06 -1.00 mM [Cu2+] (rs) (2.0 ± 0.3) × 10−2 (1.9 ± 0.3) × 10−2 0.94 ± 0.06 0.96 ± 0.06 -1.00 mM [Cu2+] (b) (3.4 ± 0.2) × 10−02 (3.0 ± 0.2) × 10−02 0.90 ± 0.03 0.93 ± 0.03
-(rs)). For the other cationic additives, this ratio ranged between 1.9% and 3.9%, indicating a quite high introduction of the additive into the samples, including 100% for 1 mM of Cu2+
and Fe3+introduced in the buffer or Zn2+ introduced in the
reagent solution. These three samples had a-CPP compositions of 36, 62, and 25 wt %, respectively, the highest proportions of a-CPP found in the studied samples. Indeed, if the totality of the additive ions involved in synthesis had precipitated in pure CPP phases in which Ca/P = 1, we would obtain 2.6% (molar) of additive-pyrophosphate for Zn2+, Cu2+, and Mg2+ or 4.0%
(molar) of iron pyrophosphate (with Fe/Pyro = 4/3 for electrical neutrality of the solid).
We also observed that except in the case of Zn2+for which
the difference in sample compositions between both protocols (b and rs) was not significant, for all the other additives the A/ Ca and A/P ratios were higher when the additive was introduced in the buffer solution (b), which corresponded to higher initial concentration of additives (high A/Ca or A/P initially in the buffer solution, which then decreased as precipitation occurred) (Table 4). Comparing the ionic radii (in picometer: pm) of the cationic additives (Mg2+(72 pm),
Cu2+(73 pm), Fe3+(55 pm), or Zn2+(74 pm)) with those of
Ca2+ (100 pm), they are all smaller than calcium ions,
indicating that we should expect fairly similar behavior for these ions upon CPP precipitation, as well as no significant variation in their cell parameters by XRD analysis in the case of a limited amount of additive ions incorporated in the crystals. A Ca/P ratio lower than 1 can be expected if the cationic additives are incorporated into the CPP precipitate and this was observed, except in the cases of 1.00 mM Mg2+or Fe3+initially
introduced in the reagent solution (Table 4). This observation may be explained by the low influence of the presence of 1.00 mM Mg2+(rs) on the sample composition (90 wt % of t-CPPD,
6 wt % of a-CPP, and 4 wt % of m-CPPD) compared with the reference sample (without additive: 93 wt % of t-CPPD and 7 wt % of a-CPP) leading thus to a similar Ca/P ratio for both samples (1.04 and 1.03, respectively). On the contrary, the strongest effect on CPPD crystallization was observed in the presence of 1 mM of Fe3+(rs) (98 wt % of a-CPP and 2 wt % of
m-CPPD) and it has been reported that some orthophosphates can be associated with a-CPP phase,8which could in this case explain a Ca/P ratio slightly higher than 1.
3.3.2. Observations by Scanning Electron Microscopy. Scanning electron micrographs of the samples precipitated in presence of the various additives initially introduced in the buffer (b) or reagent solution (rs) are presented inFigure 6. We can observe that whatever the ionic additive involved, except in the case of Fe3+which will be discussed in the next
paragraph, the crystals appear to keep their acicular shapes, with a large heterogeneity in particle sizes and agglomeration states. Indeed, in the presence of additives, except in the case of Fe3+,
we observed finer particles and more needle-like crystals, which is a morphology characteristic of the m-CPPD phase, compared with the reference t-CPPD phase, the crystals of which appear thicker (parallelipipedic crystals). This feature is a general characteristic of CPPD crystals as observed in previous works by Gras et al.10These observations are consistent with the
m-CPPD/t-CPPD weight ratio determined by XRD, which was found to increase rapidly with the concentration of Mg2+, Zn2+,
or Cu2+ (Table 2 and Table 3). We also notice that the
presence of Zn2+ ions causes a marked agglomeration of the
particles of the precipitate (Figure 6). A less pronounced effect seems to appear in the presence of Cu2+. These observations
can be linked to the XRD semiquantitative results (Table 2): high agglomeration is visible for samples with a high proportion of a-CPP even if it was not the major phase (in presence of 1 mM of Zn2+and 1 mM of Cu2+initially introduced in the buffer
solution).
The case of samples precipitated in the presence of 1 mM Fe3+is considered separately, as the a-CPP phase was the major
phase in these samples (Table 2andTable 3). In agreement with the XRD data, we can see onFigure 6that the acicular morphology of the CPPD crystals was no longer visible for samples precipitated in the presence of 1.00 mM Fe3+
introduced in the calcium reagent solution (rs; 98 wt % of a-CPP), whereas a few particles with the acicular morphology
Figure 6.SEM micrographs of the crystals of the reference t-CPPD phase and of samples precipitated in the presence of 1.00 mM Mg2+,
1.00 mM Zn2+, 1.00 mM Cu2+, or 1.00 mM Fe3+introduced in the
were still visible for samples precipitated in the presence of 1.00 mM of Fe3+introduced in the buffer solution (b; 62 wt % of
a-CPP) (Figure 6andTables 2and3). The a-CPP phase showed quite well dispersed and smooth, round particles with a diameter of about 20 μm. This a-CCP phase morphology was different from that described by Gras et al.10which contained
smaller (less than 1 μm) round, agglomerated particles. Further structural investigations using solid-state NMR were performed to shed some light on the possible mechanism of action of some of these ionic additives.
3.3.3. Structural Analyses by 31P Solid-State NMR
Spec-troscopy.As explained previously, none of the characterization methods used so far allowed a clear identification of the dopants (cationic additives) in one or the other of the mineral phases identified, due principally to the low amount of dopant species. The determination of T1(31P) (spin−lattice) relaxation
times could give an answer to this important question. Generally speaking, the observed T1 in solid-state NMR are
strongly dependent on the presence of paramagnetic species, which has been shown to considerably reduce their values. Thus, this method is especially useful for paramagnetic dopants like Cu2+and Fe3+, whereas diamagnetic species such as Zn2+
and Mg2+are expected to produce no noticeable effect (such
cations are introduced in very small amounts, and the natural abundances of25 Mg and67Zn, which are quadrupolar nuclei,
are <10%).
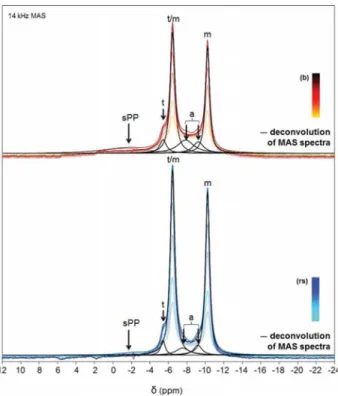
The 31P MAS spectrum of the t-CPPD reference phase is
presented inFigure 7. As previously observed by Gras et al.,9
t-CPPD (labeled t in Figure 7) is characterized by two sharp peaks located at −5.14 and −6.24 ppm. The observation of two
31P resonances is in full agreement with the crystallographic
data as reported in previous publications.9 Studying the spectrum in detail, one can observe the presence of two very minor components at −7.5 and −9.96 ppm. They correspond to a-CPP (labeled a inFigure 7) and m-CPPD (labeled m in
Figure 7), respectively (m-CPPD is also characterized by a second resonance at −6.30 ppm, which here is superimposed onto one of the peaks of the t-CPPD phase). These side phases were considered here as negligible. T1(31P) = 76.3 s for t-CPPD
(Table 5). m-CPPD is characterized by two resonance peaks centered at −5.91 and −9.68 ppm. T1(31P) = 96.0 s for
m-CPPD. In the case of a-CPP, a featureless broadened component is observed at ∼−5 ppm, exhibiting T1(31P) =
29.5 s.
The31P MAS NMR spectra of the samples obtained in the
presence of 1.00 mM Cu2+initially present in the buffer (b) or
in the reagent solution (rs) are reported in Figure 8. When comparing these spectra with those of the t-CPPD, m-CPPD, and a-CPP reference samples, it is obvious that the spectra of the Cu2+-doped samples exhibit m-CPPD as the major phase,
confirming the XRD data (Table 2 and Table 3). The 31P
isotropic chemical shifts are centered at −6.44 and −10.24 ppm, slightly shielded when compared with the m-CPPD reference (Table 5). This variation may be attributable to the presence of Cu2+cations in the sample, which was confirmed by
ICP-OES elemental analysis: Cu/Ca (rs) and Cu/P (rs) are both around 2 × 10⁻²; Cu/Ca (b) and Cu/P (b) are both
around 3 × 10⁻² (Table 4). A deconvolution of the spectra is
also presented in Figure 8. t-CPPD was present as a minor component, as well as a much broader component, which could be safely assigned to an amorphous phase. This amorphous component is rather nonsymmetric in contrast to the one observed for nondoped a-CPP (consequently, two components
were used in the final deconvolutionthey are both indicated by the notation “a” inFigure 8). We did not attempt to further analyze the shape of this particular resonance, but used it as a fixed model for spectral deconvolution and quantitative analyses (Table 5). The resulting data are in good agreement with the results obtained by semiquantitative XRD analysis (Table 2andTable 3). Even if the semiquantitative XRD data provide results in wt % and those of solid-state NMR in molar % of the CPP phases, we can globally compare both data, as the CPP phases involved in all samples have the same or quite the same molecular weight (2 water molecules for t-CPPD and m-CPPD and between 3 and 4 associated with a-CPP phase).
Finally, we note the presence of a broad component centered at ∼−2.0 ppm. The intensity of this particular component is small but measurable. It was even broader when Cu2+ was
introduced in the buffer ((b) protocol). At this stage, two distinct assignments can be proposed for this broadened component: (i) orthophosphates, such as those that can be obtained as side products of the partial hydrolysis of pyrophosphates,9 or (ii) pyrophosphates exhibiting shifted
Figure 7. 31P MAS NMR spectra (decoupled from 1H during the
acquisition) of the reference samples t-CPPD, m-CPPD, and a-CPP (synthesized without additives). The different components of the MAS spectra are labeled as follows: t (t-CPPD), m (m-CPPD), and a (a-CPP).
Table 5. T1(31P) Relaxation Time Measured by Saturation Recovery for Each Peak Identified in the31P MAS NMR Spectra of
Samples Synthesized in the Presence (or Absence) of Cu2+or Fe3+Ions Introduced in the Calcium Reagent Solution (rs) or in
the Buffer (b)a Reference Samples Figure 7 m-CPPD reference δ(ppm) −5.91 −9.68 line width (ppm) 0.68 0.63 relaxation time T1(s) 96.0 (±0.4) t-CPPD reference δ(ppm) −5.14 −6.24 line width (ppm) 0.55 0.61 relaxation time T1(s) 76.3 (±5.8) a-CPP reference δ(ppm) ∼ −5 line width (ppm) 1.1 relaxation time T1(s) 29.5 (±2.7)
Samples Precipitated in the Presence of Ionic Additive
components t t/m m sPP a 1 mM [Cu2+] (rs)
δ(ppm) −5.41 −6.44 −10.24 ∼−2.0 −7.6/−9.2 line width (ppm) 0.58 0.52 0.59 3.0 1.1/1.8 relaxation time T1(s) 2.0 ± 0.3 2.0 ± 0.3 ∼4
area (relative percentage) (%) 4 46 37 2 6/5 1 mM [Cu2+] (b)
δ(ppm) −5.40 −6.43 −10.23 ∼−1.5 −7.9/−9.2 line width (ppm) 0.89 0.59 0.53 6.4 1.4/2.2 relaxation time T1(s) 2.6 ± 0.3 2.6 ± 0.3 ∼4
area (relative percentage) (%) 6 33 26 15 13/7 1 mM [Fe3+] (rs)
δ(ppm) −9.9 ∼1 ∼−7.5
line width (ppm) 1.6 ∼4 ∼6 relaxation time T1(s) 3.3 ± 0.7 <1
area (relative percentage) (%) 7 12 81 1 mM [Fe3+] (b)
δ(ppm) −6.13 −9.98 ∼1 −7.8 line width (ppm) 0.70 0.73 ∼3 ∼6 relaxation time T1(s) <1 <1 <1
area (relative percentage) (%) 22 22 3 53 1 mM [Zn2+] (rs)
δ(ppm) −5.52 −6.55 −10.35 −7.3/−9.2 line width (ppm) 0.58 0.67 0.66 2.49/1.76 relaxation time T1(s) 43.4 ± 3.0 49.7 ± 7.3 ∼12
area (relative percentage) (%) 3 35 32 18/12 1 mM [Zn2+] (b)
δ(ppm) −5.47 −6.51 −10.31 −7.2/−9.1 line width (ppm) 0.50 0.70 0.66 1.4/1.8 relaxation time T1(s) 74.0 ± 6.2 93.7 ± 12.5
area (relative percentage) (%) 3 42 35 9/11
Components t t m m a
1 mM [Mg2+] (rs)
δ(ppm) −5.57 −6.67 −7.7 −10.35 −6.03 line width (ppm) 0.59 0.70 1.66 0.84 0.89 relaxation time T1(s) 25.8 ± 2.8 27.7 ± 3.0
area (relative percentage) (%) 43 49 5 3 1 mM [Mg2+] (b)
δ(ppm) −5.56 −6.63 −9.28 −10.33 −7.97 line width (ppm) 0.59 0.74 1.44 0.64 1.72 relaxation time T1(s) 104.4 ± 29.7 65.2 ± 6.1 35.3 ± 6.8 65.8 ± 7.9
area (relative percentage) (%) 29 53 2 16
aIsotropic chemical shifts, line widths, and relative molar % are given as well. t: t-CPPD, m: m-CPPD, a: a-CPP, sPP: shifted calcium
δiso(31P) due to the paramagnetic effect of Cu2+cations. From
the NMR point of view,31P INADEQUATE MAS experiments
should allow definite assignments,8 as this double quantum (DQ)-based experiment is sensitive to pyrophosphate groups only. We did not attempt to implement this sequence, as the intensity of the involved resonance was very small. However, such a broad component was not observed at all in the case of diamagnetic cations, namely, Zn2+ and Mg2+(Figures 10 and
11, respectively). Moreover, it is clear fromFigure 8that the broadening is more pronounced in the (b) protocol than in the (rs) protocol. We recall here that Cu/P (rs) < Cu/P (b). In summary, we suggest that the broad component centered at ∼−2.0 ppm can be assigned safely to pyrophosphate groups in relatively close vicinity to the paramagnetic centers.46Indeed,
such a component is observed on the 31P MAS NMR spectra.
Even if FTIR spectroscopy was able to distinguish orthophosphate from pyrophosphate groups (for instance, in the case of Fe3+; seeFigure 5), the broadening and overlapping
of the vibrational bands would exclude definite assignments at this stage. The complementary roles of solid state NMR spectroscopy, X-ray diffraction and vibrational spectroscopies characterization techniques are demonstrated here.
Considering the T1(31P) data, we focused here only on the
major m-CPPD phase, and found that T1(31P) ≅ 2.3 s for both
samples (on average). When compared with the reference m-CPPD phase, one observes a drastic reduction of the 31P
longitudinal relaxation time. This can be safely attributed to the presence of the paramagnetic Cu2+cations within the m-CPPD
structure. Indeed, it is well established that paramagnetic ions
usually lead to a very efficient pathway for nuclear relaxation.46−50Two relaxation mechanisms can be considered,
namely, a through-space dipolar coupling between electrons and nuclei and a through-bond electronic interaction (Fermi contact). Both are usually present. The effect of paramagnetism on the NMR resonances can be summarized as the following: (i) a loss of signal is observed for those nuclei in close vicinity to the paramagnetic centers, (ii) line widths can broaden significantly, (iii) nuclear longitudinal T1 values are usually
strongly shortened, and (iv) paramagnetic shifted peaks can be observed directly on the NMR spectrum. Very recently, McCarty and Stebbins51 performed an in-depth study of the effect of paramagnetic cations such as Ni2+ and Co2+on the 17O,25 Mg, and43Ca MAS NMR spectra of CaO, MgO, and
CaO.
Though present as a minor component, T1(31P) ≅ 4 s was
estimated for the a-CPP component. No attempt was made to derive the T1(31P) data for t-CPPD (t) and the shifted
pyrophosphates (sPP) as the corresponding intensities were intrinsically small.
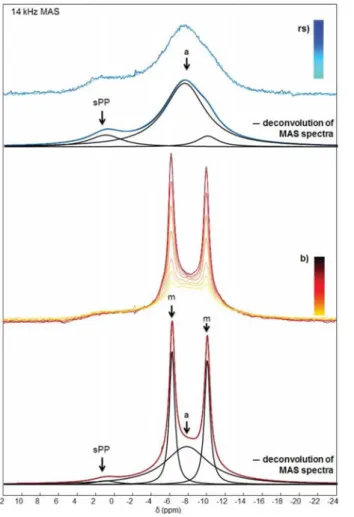
The31P MAS NMR spectra of the samples obtained in the
presence of 1 mM Fe3+initially present in the buffer (b) or in
the reagent solution (rs) are reported inFigure 9. All relevant isotropic chemical shifts and T1(31P) data are reported inTable
5. In the case of the (b) protocol, there are similarities with the results for the Cu2+-doped samples. Indeed, m-CPPD and
a-CPP were clearly obtained as major phases, but with a different molar ratio compared with the Cu2+case. This result is in good
agreement with the XRD data (Table 2andTable 3). In the case of the (rs) protocol, a broad spectrum was obtained, exhibiting two main components: shifted pyrophos-phates, sPP; and amorphous pyrophospyrophos-phates, a (Figure 9). A very small amount (∼4%) of another phase (∼−9.9 ppm) was faintly detected.
This 31P isotropic chemical shift is in agreement with the
presence of m-CPPD as a minor phase, as shown by powder XRD (Table 3).
In other words, Fe3+is able to inhibit almost completely the
crystallization of CPPD phases (m and t) when using the (rs) protocol. As already observed in the case of Cu2+-doped
samples, a drastic reduction of T1(31P) was observed for both
m-CPPD and a-CPP phases. This shows again that Fe3+cations
are inserted into the m-CPPD and a-CPP phases.
In the case of Fe3+((b) protocol), we further observe that
the content of a-CPP is much larger than in the case of Cu2+
(Figure 8). This observation is in full agreement with the semiquantitative XRD data mentioned above (62 wt % of a-CPP phase in the case of Fe3+).
The31P MAS NMR spectra of the samples obtained in the
presence of 1.00 mM Zn2+ and Mg2+ (diamagnetic species)
initially present in the buffer (b) or in the calcium reagent solution (rs) are reported inFigures 10and11, respectively. All relevant isotropic chemical shifts and T1(31P) data are reported
inTable 5. In the case of Zn2+(Figure 10), there are similarities
with the results of the Cu2+-doped samples. Indeed, m-CPPD
and a-CPP were clearly obtained as the major phases but with a different molar ratio when compared with the Cu2+case. This
result is in good agreement with the XRD data (Table 2and
Table 3). Furthermore, the molar proportions of the different phases reported in Table 5 are in good agreement with the XRD data (Table 2 andTable 3) and confirm that m-CPPD and a-CPP are indeed obtained as the major phases.
Figure 8. 31P MAS NMR spectra (decoupled from 1H during the
acquisition) of samples synthesized in the presence of 1.00 mM Cu2+
introduced in the buffer (b) or in the calcium reagent solution (rs). The relaxation delay after the train saturation of the31P channel was
incremented from the bottom to the top of the spectra (saturation− recovery). The different components of MAS spectra are labeled as follows: t (t-CPPD), m (m-CPPD), a (a-CPP), and sPP (shifted calcium pyrophosphates).
In the case of the (rs) protocol (Zn2+), the amorphous (a)
contribution is characterized by two components as observed above (Figure 10). Furthermore, a small contribution of t-CPPD is evidenced as well. Finally, a negligible resonance is observed at ∼0 ppm.
As already observed in the case of Cu2+doped samples, a
significant reduction of T1(31P) was observed for both the
m-CPPD (∼45.0 s) and a-CPP (∼12.0 s) phases (we mention here that T1(31P) = 96.0 and 29.5 s for reference m-CPPD and
a-CPP, respectively). However, this reduction is not as pronounced as in the case of the paramagnetic ions of Cu2+.
In this case, any effect of paramagnetic relaxation is excluded. We believe that Zn2+cations enter the m-CPPD structure as
well as a-CPP, leading to local defects and consequently to the subsequent decrease of T1(31P).
When comparing the spectra obtained in the case of Mg2+
with the t-CPPD, m-CPPD, and a-CPP references (Figure 11), it is obvious that the spectra of the Mg2+-doped samples exhibit
t-CPPD as the major phase and m-CPPD as a minor one in the case of the (b) protocol. This result is in good agreement with the XRD data (Tables 2and3), and the molar proportions of the different phases reported inTable 5are in good agreement
with XRD as well. The 31P isotropic chemical shifts are
centered at −5.70, −6.50, and −10.34 ppm, slightly shielded when compared with the reference phases. This variation may be attributable to the presence of Mg2+ cations which was
confirmed by ICP-OES elemental analysis: Mg/P (rs) = (7.0 ± 0.6) × 10−3; Cu/P (b) = (9.1 ± 1.9) × 10−3 (Table 4). As
already observed in the case of the Zn2+-doped samples, a
reduction of T1(31P) (in the presence of Mg2+) was observed
for t-CPPD in the (rs) protocol and m-CPPD in the (b) protocol as well. Recently, Gras et al.43 reported some similarities between the m-CPPD and t-CPPD phase structures and those of other dihydrated pyrophosphate phases involving
Figure 9. 31P MAS NMR spectra (decoupled from 1H during the
acquisition) of samples synthesized in the presence of 1.00 mM Fe3+
introduced in the buffer (b) or in the calcium reagent solution (rs). The relaxation delay after the train saturation of the31P channel was
incremented from the bottom to the top of the spectra (saturation− recovery). The different components of MAS spectra are labeled as follows: m (m-CPPD), a (a-CPP), and sPP (shifted pyrophosphates).
Figure 10.31P MAS NMR spectra (decoupled from1H during the
acquisition) of samples synthesized in the presence of 1.00 mM Zn2+
introduced in the buffer (b) or in the calcium reagent solution (rs). t (t-CPPD), m (m-CPPD), a (a-CPP).
other divalent metal cations, such as Mg2+, Mn2+, Fe2+, or Co2+,
which support our results suggesting the introduction of magnesium in the CPPD phase structures.
These experiments using the same ionic additive introduced in the buffer or in the reagent solution demonstrate that the initial concentration of the additive and its distribution in the reactor combined with the supersaturation level are crucial parameters.
Concerning the inhibition of the t-CPPD crystallization by
Fe3+ ions, there may be a competition between iron
pyrophosphate and calcium pyrophosphate precipitation, or Fe3+may be adsorbed on the crystal and block some of the
growth sites (the Fe/Ca atomic ratio ranged between 2.7% and 4.9%;Table 4).
The use of S2O32−ion as an additive has no notable effect on
the t-CPPD formation.
At this stage, it is important to recall that the m- and t-CPPD phases are those that have been identified in vivo, while we are attempting to explain some of their behaviors observed in vitro. The medium of precipitation is highly supersaturated at the beginning of the synthesis. In the presence of additives, it is possible that the most unstable phase (a-CPP) is formed first, then evolves into m- or t-CPPD. The formation of a dihydrate phase instead of another may be due to kinetics, potentially modified by the presence of additives in the precipitation medium. This seems to be consistent with the fact that in vitro, the a-CPP phase could be a precursor of the m- and t-CPPD phases. Another hypothesis is that the less stable crystalline dihydrated phase (m-CPPD) could be formed first, and then evolve into t-CPPD. In this case, the ionic additives studied here would stabilize the m-CPPD phase and therefore prevent it from evolving toward the t-CPPD phase. This assumption is consistent with the effect identified in this study for Mg2+, Zn2+,
and Cu2+ cations. These ions promote the formation of
m-CPPD instead of t-m-CPPD by replacing Ca2+in the structure.
That effect is especially strong for high initial concentrations of these ions at the beginning of the precipitation of CPP ((b) protocol). A potential excess of certain ions in arthritic joints could be a precursor and/or aggravating factor for the formation of CPPD crystals and the inflammatory response. To explore this assumption, it could be interesting to correlate medical analyses of the osteoarticular fluid compositions in osteoarthritic patients who also suffer from diseases caused by ionic imbalance, such as Menke’s or Wilson’s disease affecting copper levels in the body.52Furthermore, the used of Fe3+ions
to prevent the precipitation of CPPD crystals has yet to be explored in physiological conditions.
■
CONCLUSIONCalcium pyrophosphate dihydrate polymorphs (m-CPPD and t-CPPD: Ca2P2O7·2H2O) detected in the joints of arthritic
patients are known to be highly inflammatory. Understanding their formation and trying to minimize their development are routes to reduce the pain caused or even to cure the disease.
Two main steps were analyzed in this study to achieve this goal: the ability to produce these crystals in vitro, outside the human body, to study their nucleation and growth phenomena on the one hand, and testing ionic additives likely to have an inhibitory action on CPPD formation on the other hand.
A stirred-batch reactor under controlled pH and temperature was implemented to prepare almost pure t-CPPD, m-CPPD, and a-CPP (amorphous) phases by simultaneously adding, at controlled flow rates, a potassium pyrophosphate reagent solution, and a calcium nitrate reagent solution into an ammonium acetate buffer solution. This method is fast and reproducible and produces adequate quantities of pure products in vitro.
These phases were characterized in detail by using X-ray diffraction, FTIR spectrometry,31P solid-state nuclear magnetic
resonance, scanning electron microscopy, and elemental analysis by inductively coupled plasma spectrometry. The addition of one type of ionic additives ionic additives (Mg2+,
Cu2+, Fe3+, Zn2+, and S
2O32−) in the reactor during the
precipitation of CPPD was tested. These additives can influence the obtained phase.
Figure 11.31P MAS NMR spectra (decoupled from 1H during the
acquisition) of samples synthesized in the presence of 1.00 mM Mg2+
introduced in the buffer (b) or in the calcium reagent solution (rs). t (t-CPPD), m (m-CPPD).
When the t-CPPD phase was synthesized in the presence of ionic additives, the results showed that instead of pure t-CPPD, the m-CPPD phase formed simultaneously for all the tested ionic additives, except in the case of low concentrations of Mg2+. We also observed a dose-dependent effect: the higher the
amount of additives, the higher the proportion of m-CPPD in the obtained mixture. Furthermore, for some additives, like Zn2+, Cu2+, and Fe3+, the relative proportion of the amorphous
phase increased significantly in the mixture. The additive can also change the morphology of the obtained particles, leading to more or less agglomerated crystals. The use of S2O32−ions as
an additive has no notable effect on the formation of t-CPPD. NMR analysis has allowed us to advance some interpretation of the modes of action of the cationic additives tested that can be adsorbed or inserted in the crystal lattice. In vitro, the a-CPP phase may be a precursor of the m- and t-CPPD phases. Another hypothesis is that the less stable crystalline dihydrated phase (m-CPPD) may be formed first, and then evolve into t-CPPD. In this case, the ionic additives studied here would stabilize the m-CPPD phase and therefore prevent it from evolving toward the t-CPPD phase. As ionic additives may change the CPPD nucleation and crystal growth processes, we recently engaged to study CPPD crystallization at constant supersaturation with different CPPD seeds to understand better these effects.
This study contributes to understanding the role some trace elements can have in CPP crystal formation occurring in pseudogout and in associated diseases like hypomagnesaemia (low magnesium), Wilson’s disease (copper excess), and hemochromatosis (iron excess).
■
ASSOCIATED CONTENT*
S Supporting InformationThe Supporting Information is available free of charge on the
ACS Publications websiteat DOI:10.1021/acs.cgd.6b01128. Raman spectra of reference m-CPPD, t-CPPD, and a-CPP phases and of the sample synthesized in the presence of 1 mM Fe3+present initially in the calcium
reagent solution (PDF)
■
AUTHOR INFORMATIONCorresponding Author
*E-mail:[email protected]. Tel: +33 (0)5 34 32 34 09.
ORCID
Christèle Combes: 0000-0001-5009-1973
Notes
The authors declare no competing financial interest.
■
ACKNOWLEDGMENTSThe authors thank the Agence Nationale de la Recherche (CAPYROSIS project − ANR-12-BS08-0022-01) for the financial support of this research work and Pr F. Lioté and Pr H−K Ea from Bioscar U1132 Laboratory (Hôpital Lariboisière, Paris, France) for helping us in the selection of the biologically relevant ionic additives to be tested.
■
REFERENCES(1) McCarty, J.; Kohn, N. N.; Faires, J. S. Ann. Intern. Med. 1962, 56, 711−737.
(2) Kohn, N. N.; Hughes, R. E.; Mccarty, J.; Faires, J. S. Ann. Intern.
Med. 1962, 56, 738−745.
(3) Pritzker, K. P. H. J. Am. Geriatr. Soc. 1980, 28, 439−445. (4) Swan, A.; Heywood, B.; Chapman, B.; Seward, H.; Dieppe, P.
Ann. Rheum. Dis. 1995, 54, 825−830.
(5) Christoffersen, M. R.; Balic-Zunic, T.; Pehrson, S.; Christoffersen.
Cryst. Growth Des. 2001, 1, 463−466.
(6) Martinon, F.; Pétrilli, V.; Mayor, A.; Tardivel, A.; Tschopp, J.
Nature 2006, 440, 237−241.
(7) Haskó, G.; Cronstein, B. N. Trends Immunol. 2004, 25, 33−39. (8) Slater, C.; Laurencin, D.; Burnell, V.; Smith, M. E.; Grover, L. M.; Hriljac, J. A.; Wright, A. J. J. Mater. Chem. 2011, 21, 18783−18791.
(9) Gras, P.; Baker, A.; Combes, C.; Rey, C.; Sarda, S.; Wright, A. J.; Smith, M. E.; Hanna, J. V.; Gervais, C.; Laurencin, D.; Bonhomme, C.
Acta Biomater. 2016, 31, 348−357.
(10) Gras, P.; Rey, C.; Marsan, O.; Sarda, S.; Combes, C. Eur. J. Inorg.
Chem. 2013, 2013, 5886−5895.
(11) Cheng, P. T.; Pritzker, K. P. H. Calcif. Tissue Int. 1988, 42, 46− 52.
(12) Cheng, P. T.; Pritzker, K. P. H. J. Rheumatol. 1983, 10, 769− 777.
(13) Francis, M. D.; Graham, R.; Russell, G.; Fleisch, H. Science 1969,
165, 1264−1266.
(14) Cheng, P. T.; Pritzker, K. P. H. J. Rheumatol. 1981, 8, 772−782. (15) Christoffersen, M. R.; Christoffersen. Cryst. Growth Des. 2003, 3, 79−82.
(16) Berkovitch-Yellin, Z.; Van Mil, J.; Addadi, L.; Idelson, M.; Lahav, M.; Leiserowitz, L. J. Am. Chem. Soc. 1985, 107, 3111−3122.
(17) Hunter, G. K.; Grynpas, M. D.; Cheng, P. T.; Pritzker, K. P. H.
Calcif. Tissue Int. 1987, 41, 164−170.
(18) Staab, E.; Addadi, L.; Leiserowitz, L.; Lahav, M. Adv. Mater. 1990, 2, 40−43.
(19) Clydesdale, G.; Roberts, K. J.; Docherty, R. J. Cryst. Growth 1994, 135, 331−340.
(20) Nair, D.; Misra, R. P.; Sallis, J. D.; Cheung, H. S. J. Biol. Chem. 1997, 272, 18920−18925.
(21) Russell, R. G. G.; Rogers, M. J. Bone. 1999, 25, 97−106. (22) Rosenthal, A. K.; Gohr, C. M.; Uzuki, M.; Masuda, I. Matrix
Biol. 2007, 26, 96−105.
(23) Stenvinkel, P.; Wang, K.; Qureshi, A. R.; Axelsson, J.; Pecoits-Filho, R.; Gao, P.; Barany, P.; Lindholm, B.; Jogestrand, T.; Heimberger, O. Kidney Int. 2005, 67, 2383−2392.
(24) Mullin, J. W. In Crystallization; Butterworth-Heinemann: Boston, MA, 2001; Vol. 6, pp 254−260.
(25) Nyvlt, J.; Ulrich, J. In Admixtures in Crystallization, Böck, B.; Grössl, C., Eds.; VCH; John Wiley & Sons: New York, 2008; Vol. 4, pp 16−23.
(26) Mandel, G. S.; Renne, K. M.; Kolbach, A. M.; Kaplan, W. D.; Miller, J. D.; Mandel, N. S. J. Cryst. Growth 1988, 87, 453−462.
(27) Cadet, E.; Gadenne, M.; Capron, D.; Rochette. J. Rev. Médecine
Interne. 2005, 26, 315−324.
(28) Jones, A. C.; Chuck, A. J.; Arie, E. A.; Green, D. J.; Doherty, M.
Semin. Arthritis Rheum. 1992, 22, 188−202.
(29) Wright, G. D.; Doherty, M. Ann. Rheum. Dis. 1997, 56, 586− 588.
(30) Morrison, E. D.; Brandhagen, D. J.; Phatak, P. D.; Barton, J. C.; Krawitt, E. L.; El-Serag, H. B.; Gordon, S. C.; Galan, M. V.; Tung, B. Y.; Ioannou, G. N.; Kowdley, K. V. Ann. Intern. Med. 2003, 138, 627− 633.
(31) Yatzidis, H.; Agroyannis, B. Perit. Dial. Int. 1987, 7, 250−252. ( 3 2 ) A d i r e k k i a t , S . ; S u m e t h k u l , V . ; I n g s a t h i t , A . ; Domrongkitchaiporn, S.; Phakdeekitcharoen, B.; Kantachuvesiri, S.; Kitiyakara, C.; Klyprayong, P.; Disthabanchong, S. Nephrol., Dial.,
Transplant. 2010, 25, 1923−1929.
(33) Asplin, J. R.; Donahue, S. E.; Lindeman, C.; Michalenka, A.; Strutz, K. L.; Bushinsky, D. A. J. Am. Soc. Nephrol. 2009, 20, 1246− 1253.
(34) Yajnik, C. S.; Smith, R. F.; Hockaday, T. D.; Ward, N. I. Br Med.
J. Clin Res. Ed. 1984, 288, 1032−1034.
(35) Oyane, A.; Kim, H. M.; Furuya, T.; Kokubo, T.; Miyazaki, T.; Nakamura, T. J. J. Biomed. Mater. Res. 2003, 65A, 188−195.
(36) Jacobs, A.; Miller, F.; Worwood, M.; Beamish, M. R.; Wardrop, C. A. Br Med. J. 1972, 4, 206−208.
(37) Walters, G. O.; Miller, F. M.; Worwood, M. J. Clin. Pathol. 1973,
26, 770−772.
(38) Lindeman, R. D.; Clark, M. L.; Colmore, J. P. J. Gerontol. 1971,
26, 358−363.
(39) Halliwell, B.; Gutteridge, J. M. Mol. Aspects Med. 1985, 8, 89− 193.
(40) Scarlett, N. V. Y.; Madsen, I. C. Powder Diffr. 2006, 21, 278− 284.
(41) Madsen, I. C.; Scarlett, N. V. Y.; Kern, A. Z. Für Krist Cryst.
Mater. 2011, 226, 944−955.
(42) Fung, B. M.; Khitrin, A. K.; Ermolaev, K. J. Magn. Reson. 2000,
142, 97−101.
(43) Gras, P.; Rey, C.; André, G.; Charvillat, C.; Sarda, S.; Combes, C. Acta Crystallogr., Sect. B: Struct. Sci., Cryst. Eng. Mater. 2016, 72, 96− 101.
(44) Somrani, S.; Rey, C.; Jemal, M. J. Mater. Chem. 2003, 13, 888− 892.
(45) Combes, C.; Rey, C. Acta Biomater. 2010, 6, 3362−3378. (46) Sherriff, B. L.; Hartman, J. S. Can. Mineral. 1985, 23, 205−212. (47) Abragam, A. In The Principles of Nuclear Magnetism; Oxford University Press; Clarendon Press: Oxford, UK, 1961; Vol. 2, pp 27− 37.
(48) Grimmer, A. R.; Von Lampe, F.; Mägi, M.; Lippmaa, E. Z. Chem. 1983, 23, 343−344.
(49) Oldfield, E.; Kinsey, R. A.; Smith, K. A.; Nichols, J. A.; Kirkpatrick, R. J. J. Magn. Reson. 1983, 51, 325−329.
(50) Hayashi, S.; Ueda, T.; Hayamizu, K.; Akiba, E. J. Phys. Chem. 1992, 96, 10928−10933.
(51) McCarty, R. J.; Stebbins, J. F. J. Phys. Chem. C 2016, 120, 11111−11120.