O
pen
A
rchive
T
OULOUSE
A
rchive
O
uverte (
OATAO
)
OATAO is an open access repository that collects the work of Toulouse researchers and
makes it freely available over the web where possible.
This is an author-deposited version published in :
http://oatao.univ-toulouse.fr/
Eprints ID : 18227
To link to this article : DOI: 10.1109/NMDC.2016.7777115
URL :
http://dx.doi.org/10.1109/NMDC.2016.7777115
To cite this version : Bensoussan, Alain M-STORM Reliability model
applied to DSM Technologies. (2016) In: NMDC 2016 (Nanotechnology
Materials and Devices Conference), 9 October 2016 - 12 October 2016
(Toulouse, France).
Any correspondence concerning this service should be sent to the repository
administrator:
[email protected]
!
Abstract—Failure mechanisms described in JEDEC publication
JEP122G constitute commonly accepted models for silicon device physics of failure. Such models are generally described in term of stress parameters and/or specifically measured drift parameters; however, they consider only a single stress condition, single parameter signature and single failure mechanism at a time. When considering new disruptive technologies for deep submicron integrated circuits, the shrinkage of geometries (down and lower than the 20 nm range) induces shrinkage of electrical parameter limits and condition of use may produce multiple-stress in operation jointly producing multiple failure mechanisms concurrently. This paper is related to the generalized Reliability Model for semiconductor devices called M-STORM for Multi-phySics mulTi-stressOrs predictive Reliability Model.
I. INTRODUCTION
Well-known Quality Standards in various industry domains rely or are close to Military Standards MIL-STD [1] and JEDEC methods [2]. Now entering the 4.0 industry paradigm as the fourth Industrial Revolution (the Age of cyber and robots), quality/reliability models and tools headed by Health Monitoring (HM) leads toward more crucial and vital questions. When systems are constructed on innovative and disruptive technologies, such standards and methods are in
general obsolete and inadequate to prepare their
industrialization and qualification for just-in-time
commercialization. This is the case in particular for the Deep-Sub-Micron technologies entering progressively to the More than Moore era.
How to quantify reliability for such evolving technologies?
When considering deep submicron (DSM) integrated circuits, the shrinkage of geometries (down and lower than the 20 nm range) induces shrinkage of electrical parameter limits and condition of use may produce multiple-stress in operation jointly producing multiple failure mechanisms concurrently. In such technology, multiple failure mechanisms can be induced simultaneously and are in competition, considering each of them described by its single activation energies defined in the Standards. Existing Quality Standards are considering stress tests and related Physics of Failure (PoF) mechanisms without entanglements. Device failure rates are seen to be a sum of each existing failure rate taken individually. Bathtub curve is an idealized view of instantaneous failure rate scenario generally considered in well-known MIL, JEDEC or TELCORDIA [3] Standards. In 2013, a generalized view of the existing reliability models was presented by E. Suhir et al. [4], [5], describing probabilistic design-for-reliability (PDfR) concepts addressing a version to predict the reliability of aerospace electronics. The Boltzmann-Arrhenius-Zhurkov (BAZ) model very similar to
*Research conducted under Electronic Robustness contract Robustness Project IRT-008 managed by IRT Saint Exupery, Toulouse (France) and sponsored by: Agence Nationale de la Recherche, Airbus Operations SAS, Airbus Group Innovation, Continental Automotive France, Thales Alenia
COX model [6], was refined for the evaluation of the Probability of Failure (ProF) under operational application at given temperature and under the various stresses (not necessarily mechanical).
More recently, a complementary set of principles was proposed by J. Bernstein et al. and focused quantifying failure rates as a combination of multiple failure mechanisms thanks to the High Temperature Overstress Lifetest (HTOL) method [7], and [8]. The key novelty of the Multiple-HTOL (M-TOL) testing method proposed is its success in separating different failure mechanisms occurring on devices in such a way that actual reliability predictions can be made for any user operating conditions defined. After a brief description of the M-STORM principles, we will see how this model can be applied to any technology and in particular considering the example of the DSM Bulk CMOS will be reviewed. Advantages and drawbacks of the approach will be highlighted then.
II. M-STORM DESCRIPTION
A. Multiple stressor weights
The Arrhenius equation relates reaction rate r of transition from a reactant in state A to a product in state B is depending on temperature and the activation energy as also modeled by Transition state Theory, developed by E. Wigner in 1934 [9] and by M. Evans, M. Polanyi in 1938 [10]:
! " !#$ %&' (),$-*+. (1)
where "o is the rate prefactor, Ea the activation energy, T the
absolute temperature in Kelvin, k the Boltzmann’s constant (8.6174 10-5 eV/K).
The BAZ model determines the failure rate r for a material or a device experiencing combined action of an elevated temperature and external stresses S:
/ " 01! " /#$ %&' (*+,$-23$4. (2)
where
S
is the applied stress, #0 is the time constant and "0 thefailure rate constant defined as 1/#0, $ is a factor of loading
characterizing the role of the level of stress (the product $·S is the stress per unit volume and is measured in the same units as the activation energy Ea.
B. Multiple mechanism effects
Standards are generally related to parts and system hardware functions based on constant failure rate considering the element of interest have been manufactured and screened efficiently, operating in a given environment and assuming wearout failure rate well beyond the operating End of Life time (EOL). The common approach for assessing device reliability today is the High Temperature Operating Life (HTOL) testing
Space France, Thales Avionics, Safran Labinal Power Systems, Bordeaux University (IMS — UMR 5218), and Hirex engineering. A. Bensoussan is with More Electrical Aircraft Department, IRT Saint Exupery, Toulouse, France, (e-mail: [email protected]).
A. Bensoussan, Member, IEEE
[11], which is based on the assumption that just one dominant failure mechanism is acting on the device [7]. However, it is known that multiple failure mechanisms act on the device simultaneously [12]. The new approach M-TOL method predicts the reliability of electronic components by combining the Failure in Time (FIT) of multiple failure mechanisms [13]. Degradation curves are generated for the components exposed to accelerate testing at several different temperatures and core stress voltage. Data clearly reveals that different failure mechanisms act on the components in different regimes of operation causing different mechanisms to dominate. A linear matrix solution allows the failure rate of each separate mechanism to be combined linearly to calculate the actual reliability as measured in FIT of the system based on the physics of degradation at specific operating conditions.
III. APPLICATION TO DSM TECHNOLOGIES
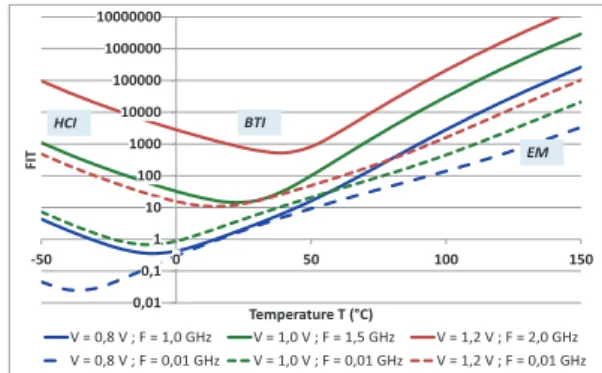
An experimental results of the M-TOL method tested on both 45 FPGA devices from Xilinx that were processed at TSMC (according to the Xilinx data sheets) is presented and is running at IRT Saint Exupery, Toulouse (France). The FPGAs are tested over a range of voltages, temperature and frequencies, and the test program is conducted by Bernstein, J., Ariel University, Ariel (Israel). Ring frequencies of multiple asynchronous ring oscillators simultaneously stressed in a single FPGA were read and recorded. Hundreds of oscillators and the corresponding frequency counters were burned into a single FPGA to allow monitoring of statistical information in real time. Since the frequency itself monitors the device degradation, there is no recovery effect whatsoever, giving a true measure for the effects of all the failure mechanisms measured in real time. The common intrinsic failure mechanisms affecting electronic devices are, Hot carrier Injection (HCI), Bias Temperature Instability (BTI), Electromigration (EM) and Time Dependent Dielectric Breakdown (TDDB). The failure mechanisms can be separated due to the difference of physical nature of each individual mechanism [8]. An example of results of three failure mechanisms superposed have been obtained on FPGA 45 nm and is shown in figure 1. The stresses applied degrade the reliability with respect to the temperature range domain. Quality Standards recommend in general to operate at low temperature (close to 25°C) to improve reliability. For such technology, this is no truer when the temperature range is reduced in excess down to negative values. Indeed in the classical approach, the two mechanisms BTI and EM decrease the extrapolated FIT observed at low temperature range because of the positive activation energies. Here the methodology quantify the contribution of the HCI (negative activation energy) compensating the effect of the other mechanisms and demonstrating worst FIT values at low negative temperature range for this DSM technology.
IV. DISCUSSION AND CONCLUSION
To this day, the users of most sophisticated electronic systems that include GaN power devices, ASIC and Deep-Sub-Micron technologies etc. are expected to rely on a simple reliability value (FIT) published by the supplier. A way to predict reliability assessment based on the system environment including space, military and commercial was presented in this paper, using the common language of Failure In Time or Failure unIT (FIT). A Multi-phySics mulTi-stressOrs
predictive Reliability Model (M-STORM) is discussed in this paper for an easy to use, to quantify and to predict probability of failure of new products and technologies.
V. ACKNOWLEDGMENT
The author would like to particularly thank Professor Joseph B. Bernstein, from Ariel University, Ariel (Israël) for his collaboration and the major comments and deep discussions we had during the manuscript preparation.
REFERENCES
[1] N. 1. R. HDBK, «NSWC-10 RELIABILITY HDBK JAN2010 45818/,» 2010. [En ligne]. Available:
http://everyspec.com/USN/NSWC/NSWC-10_RELIABILITY_HDBK_JAN2010_45818/. [Accès le 2016].
[2] JEP148B, «Reliability Qualification of Semiconductor Devices Based on Physics of Failure Risk and Opportunity Assessment,» JEDEC SOLID STATE TECHNOLOGY ASSOCIATION, Arlington, VA, December 2004.
[3] BELLCORE, SR-332, Reliability Prediction Procedure for Electronic Equipment, BELLCORE Telcordia, 2011.
[4] E. Suhir, «Probabilistic Design for Reliability,» ChipScale Rev., vol. 14, n° %16, 2010.
[5] A. Bensoussan et E. Suhir, «Design-for-Reliability (DfR) of Aerospace Electronics: attributes and challenges,» IEEE Aerospace Conference, 2-9 March 2013.
[6] D. Cox, «Regression Models and Life-Tables,» Journal of the Royal
Statistical Society. Series B (Methodological), Vol. 34, No. 2. (1972), pp., vol. 34, n° %12, pp. 187-220, 1972.
[7] J. B. Bernstein, Reliability Prediction from Burn-in Data Fit to Reliability Models, London: Elsevier AP, ISBN–10: 0-128007-47-8, 2014.
[8] J. B. Bernstein, M. Gabbay et O. Delly, «Reliability Matrix Solution to Multiple Mechanism Prediction,» Microelectronics Reliability
Journal, vol. 54, pp. 2951-2955, 2014.
[9] E. Wigner, «The transition state method,» Faraday Society (London)
Trans, vol. 34, pp. 29-41, 1938.
[10] M. Evans et M. Polanyi, «Inertia and driving force of chemical reaction,» Faraday Society (London) Trans, vol. 34, pp. 11-29, 1938.
[11] XILINX, «Reliability Report,» XILINX UG116 (v10.4), 1st April 2016.
[12] J. B. Bernstein, S. Salemi, L. Yang, J. Dai et J. Qin, Physics-of-failure based handbook of microelectronic systems, UTICA, NY: Reliability Information Analysis Center, 2008.
[13] J. Bernstein, «Reliability Prediction for Aerospace Electronics,» chez
IEEE Aerospace Conference, Big Sky (MN), 2015.
Figure 1: Reliability curves for 45nm technology showing FIT versus Temperature for Voltages above and below nominal (1.2V) and frequencies from 10 MHz (dashed line) to 2GHz (solid line).
0,01 0,1 1 10 100 1000 10000 100000 1000000 10000000 -50 0 50 100 150 F IT Temperature T (°C) V = 0,8 V ; F = 1,0 GHz V = 1,0 V ; F = 1,5 GHz V = 1,2 V ; F = 2,0 GHz V = 0,8 V ; F = 0,01 GHz V = 1,0 V ; F = 0,01 GHz V = 1,2 V ; F = 0,01 GHz HCI BTI EM