Paper ID: ETC2017-073 Proceedings of 12th European Conference on Turbomachinery Fluid dynamics & Thermodynamics ETC12, April 3-7, 2017; Stockholm, Sweden
OPEN ACCESS
Downloaded from www.euroturbo.eu 1
Copyright © by the Authors
LOCAL AND GLOBAL ANALYSIS OF A VARIABLE PITCH FAN
TURBOFAN ENGINE
A. Joksimović, S. Duplaa, Y. Bousquet, X. Carbonneau, N. Tantot
(1),
[email protected], [email protected], [email protected], [email protected]Departement of Aerodynamics and Propulsion, ISAE-SUPAERO, Université de Toulouse, 31550 TOULOUSE Cedex 4, Toulouse, France
(1)
Safran Aircraft Engines, Site de Villaroche Rond-Point René Ravaud, 77550 Moissy-Cramayel, France
ABSTRACT
The objective of this paper is development and application of a methodology for preliminary analysis of variable pitch fan (VPF), both as a separate component and as a module integrated into a short-medium range geared turbofan engine developed within European FP7 project ENOVAL. For this purpose, a high bypass ratio two spool geared turbofan engine model was constructed in software PROOSIS. A VPF performance modelling methodology was then developed using 3D steady RANS CFD produced fan maps as baseline; the CFD maps characterised five discrete fan pitch angle settings. In order to represent those maps in PROOSIS and add the pitch angle as a degree of freedom, they were transformed into the Map Fitting Tool (MFT) reference frame. Once the complete VPF turbofan model was in place, engine mission optimisation experiments were carried out. The resulting performance is characterised by a good capability to control the fan surge margin, without degrading the engine fuel consumption.
KEYWORDS
Variable Pitch fan, Turbofan, Engine Operability, System Modelling, CFD, Map Fitting Tool
NOMENCLATURE
BPR Bypass ratio SFC Specific fuel consumption MFT Map Fitting Tool SM Surge margin
Nc Corrected rotational speed SMN Surge margin at constant rotational regime OPR Overall pressure ratio VPF Variable pitch fan
TRL Technology readiness level Wc Corrected mass flow
INTRODUCTION
When talking about the fan module in particular, recent tendencies in the civilian aeronautical propulsion industry could be looked upon from two perspectives. Aiming at reducing engine thrust specific fuel consumption, the first and foremost tendency is to go towards higher bypass ratio engines, with the so called Ultra High Bypass Ratio (UHBR) engines, characterised by bypass ratio of up to 20. (ENOVAL, 2012) The reason for this can be deduced from the basic turbofan analytical considerations which show that the engine SFC decreases with increasing bypass airflow. Simultaneously, for a higher propulsive efficiency of the engine, it is of interest to reduce the bypass ejection speed, or consecutively the fan pressure ratio. (Hill and Peterson, 1992) Another typical
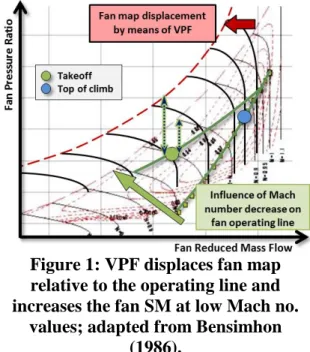
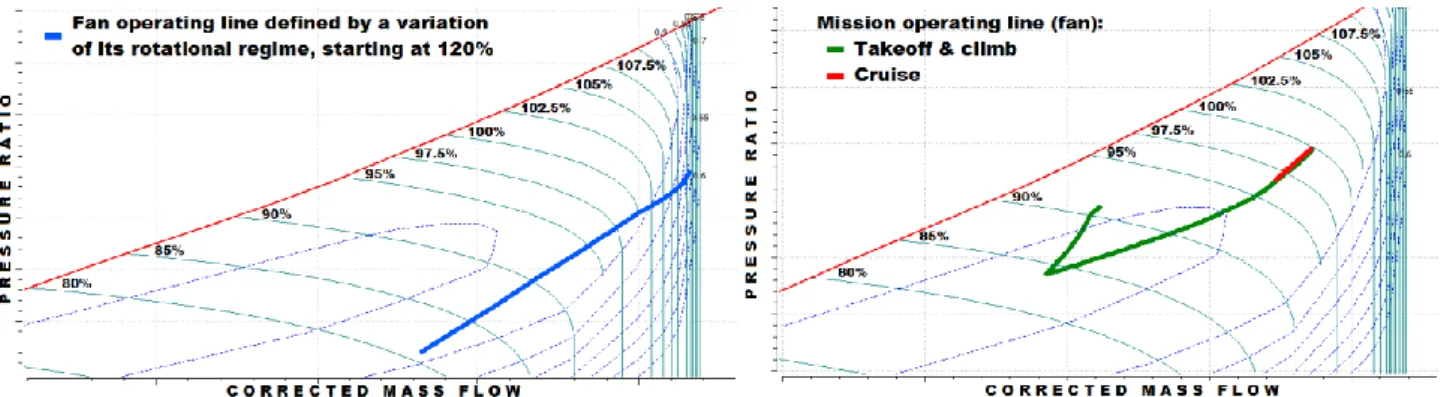
2 trend in the European research to consider here is study of variable thermodynamic cycles in order to adapt the engine behaviour to various operating points during the mission. For this purpose, devices that enable variable geometry and thermodynamics have been studied in the recent years (Sieber, 2015). The two outlined tendencies cross over in a European FP7 project ENOVAL task which deals with low pressure system of the civilian engines. In this context, the task investigated variable pitch fan (VPF) module as means to control engine operability i.e. fan surge margin. It was shown by Bensimhon (1986) that the variable pitch fan could be used for manipulating the relative position between the operating line and the fan surge line (Fig.1). This comes as an attractive feature if we take into account the previously mentioned trend to reduce fan PR, which in turn results in poor fan stability at lower
rotational regimes, most notably at low Mach numbers, i.e. takeoff or landing (Fig.1, green op. point). In other words, a VPF would imply a possibility to actively control the fan SM, either by reducing it if it is unnecessarily high, or increasing it in situations of particular relevance, e.g. takeoff or landing with cross wind.
Different VPF turbofan technologies were produced throughout the years. VPF equipped turbofan called Astafan, which aimed at improving the fuel efficiency by running at constant rotational speed was developed by Turbomeca. Its first prototype test run was in 1969, it was being developed until the late 1980-s, but it was ultimately never produced commercially. Early 1990’s saw the development of Advanced Ducted Propulsor (ADP) by Pratt Whitney and NASA. As opposed to Astafan, ADP mounted a VPF on a turbofan for noise reduction purposes. (Woodward et al., 1992) Most recently, Rolls Royce announced development of a VPF equipped turbofan called
UltraFan, possibly entering into service by 2025. According to Haselbach et al. (2014), UltraFan
VPF module would enable optimal low pressure fan operability, as well as the elimination of the need for a thrust reverser.
Despite the idea of a VPF turbofan being far from new, no references were found in the literature on modelling such a technology at a complete engine level, as opposed to the fixed geometry engines, which is commonplace. It was therefore relevant in the first place to identify fixed fan calculation methods that could be extended to accommodate the additional degree of freedom – fan pitch. When fan performance is discussed, standard methods to produce the data are either experimental or numerical (CFD). Given that the current fan/engine technology is at a low TRL, 3D steady RANS CFD approach was identified as sufficient for producing fan performance data at this level. In order to integrate this fan behaviour into a complete engine cycle, software PROOSIS was used. PROOSIS is widely used European object oriented software dedicated to turbomachinery system modelling, developed within EU project VIVACE. For more details on PROOSIS, see Alexiou and Tsalavoutas (2011). In terms of compressor (fan) and turbine modelling, PROOSIS default components are only capable of representing the configurations without variable geometry, through generic component maps. Zarati et al. (2015) used PROOSIS to explore variable cycles enabled by variable nozzle areas, but no work dealt with variable turbomachinery rotor geometry. PROOSIS users are enabled to insert their own component maps. Turbomachinery (among them fan) performance maps can be represented in a frame of reference based on work and loss coefficients, rather than the standard one (π-Wc-η-Nc). This frame of reference, called MFT for “Map Fitting Tool”, was developed by NASA, and presented in GE (1984). MFT came forward as relevant because it is extensively used in PROOSIS components; a presentation is available in Sethi
Figure 1: VPF displaces fan map relative to the operating line and increases the fan SM at low Mach no.
values; adapted from Bensimhon (1986).
3
et al. (2013). Moreover, since MFT is about an analytical representation of the maps, expressed by a series of physical parameters, it can be used first of all to complete a map by interpolation, and where needed – extrapolate performance to very high or very low speed regimes. With this capability, MFT becomes an obvious choice for being extended by the additional degree of freedom, i.e. pitch angle, in order to provide a modelling capability.
The objective of the study is twofold. The primary objective is to develop a comprehensive engine performance simulation platform adapted for analysis of a VPF equipped turbofan. For this purpose, it was envisaged to develop a PROOSIS model whose input on VPF would come from CFD. The secondary objective is to apply the developed methodology along a typical turbofan mission in order to validate the platform’s operation and to obtain a first idea of how VPF impacts the fan SM operability and fuel performance of the current engine.
MODELLING
Turbofan Engine Cycle Modelling in PROOSIS
The engine selected to be equipped with a VPF module was a short-medium range geared turbofan, designed to power an A320-type aircraft. In order to simulate the engine cycle, system modelling software PROOSIS (Alexiou and Tsalavoutas, 2011) was used. The baseline cycle specifications, that is, for the cycle with fixed geometry fan, were provided for three operating points (Takeoff, Top of Climb and Start of Cruise) by Safran Aircraft Engines (Tab.1). Given that the core performance maps were a priori unknown, the essential part of the cycle design procedure was the map scaling. In order to calculate the map scalars, a multipoint design procedure was carried out. The merit of multipoint design is the capability to take into account constraints that characterise different flight points defined by the user. As a result, the obtained map design (i.e. map scalars) is still unique; however, as opposed to the single point design, it is optimised for all the defined mission points. For the current case, three mission points were used. They were defined, along with their constraints, as follows:
Takeoff: Maximum thrust (turbine entry temperature) condition;
Top of Climb: Low pressure system optimisation, mass flow condition;
Cruise: Efficiencies and SFC optimisation condition.
Parameter Unit Takeoff Top of Climb Start of Cruise
Net Thrust N 85768 22442 19363
BPR - 15.9 15.5 16.2
OPR - 46.1 54.7 50.4
Table 1: Selected Performance Parameters of the Baseline Engine Cycle
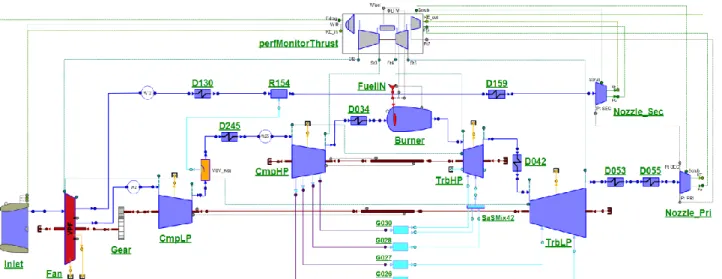
The engine schematic constructed for setting up the reference cycle is presented in Fig.2. Despite having all the necessary capabilities available (e.g. steady, transient, mission analysis), the crucial drawback of PROOSIS for this project was its lack of capability to model variable geometry turbomachinery. For this reason, it was necessary to find a way to extend the default PROOSIS component functions in order to take into account the additional degree of freedom – fan rotor pitch angle. If Re and γ effects are neglected, compressor performance variables, i.e. performance map, are a function of compressor geometry design only, see Hill and Peterson (1992). For this reason, the next step in the VPF modelling was to produce a series of fan performance maps for discrete rotor pitch angles, and at a later phase attempt to reintroduce thus described fan performance into PROOSIS for complete engine analysis.
Fan Performance – CFD Maps and MFT
For purpose of this task, Safran Aircraft Engines provided a complete VPF stage description. Computations on this geometry were performed using the commercial code NUMECA FINE/Turbo. It solves the steady three dimensional Reynolds Averaged Navier-Stokes equations based on a cell
4
centered finite volume approach on structured grids. All the numerical parameters mentioned below have been set according to previous study (Dufour 2015) that was performed on a similar axial fan and which showed good agreement between experimental measurements and numerical data. The spatial discretisation was a central scheme with a Jameson type dissipation using 2nd and 4th order derivatives of the conservative variables. Time integration was performed with an explicit four-stage Runge-Kutta scheme. Conventional techniques as multigrid method, local time step, smooth residual stepping were used to speed up the convergence of the simulations. The turbulence model used for performing the simulations is the single equation model Spalart-Allmaras.
The numerical domain consisted of an inlet region, spinner, rotor, outlet guide vane, and the two exit domains (core and bypass), see Fig.3. The structured grid was created with Autogrid V5 and is discretized using H and O topologies. The size of the first cell was set to 1μm and led to y+ < 1 near wall regions to allow a good description of the viscous effects and turbulent gradients. The domain point distribution and number of nodes are summarised in Table 2.
Number of Points Radial Direction Axial Direction Azimuthal Dir.
Rotor 141 135 73
Stator 105 169 67
INLET ROTOR STATOR
Number of Nodes 0,334*10 6 2,668*10 6 1.596*10 6
Table 2: Number of Points of the Fan Stage Numerical Domain
Figure 3: Meridional View of the Fan Stage Numerical Domain for the CFD Calculations (Left), and the Rotor Blade Pivoting Visualisation (Right), with Pivoting Axis Located at the 1/3 of the
Hub Chord
Figure 2: PROOSIS Schematic of a VPF Equipped Short-Medium Range Geared Turbofan
Inlet
Fan rotor
Fan stator
Primary outlet
5
To reduce computational cost, only one blade passage per blade row was taken into account in the numerical domain. The interface between the rotor and the stator is treated with the classic mixing plane approach. The five chosen pitch configurations to be calculated (-10°, -5°, 0°, 5°,10°) had the same mesh characteristics in terms of number of points. Considering the boundary conditions, the total pressure, the total temperature and the flow angle (axial flow) were prescribed at the domain inlet. At the primary duct outlet, a mass flow value was imposed. This value was constant all over the iso-line characteristic but it changed with the rotation speed. Considering the outlet boundary condition, the characteristic curve representing the total-to-static pressure ratio of the fan depending on the mass flow may have a positive slope at low mass flow rates. Then, a static pressure condition is not adapted as two solutions with
different mass flow rates are possible. To accurately simulate the part of the curve having a positive slope, the bypass outlet boundary condition was modelled using a throttle condition. It means that the outlet static pressure imposed by the solver depends on the mass flow rate. The imposed pressure was prescribed according to the following equation:
2 ref ref out M M P P (1)
M is the mass flow rate at the outlet. The reference
pressure (pref) was set to 101325 Pa while the reference mass flow (Mref) was set to 668 kg/s representing the design operating point mass flow. These values were chosen arbitrarily. This boundary condition permitted simulation of different operating points from choke to stall by simply increasing the value of λ. The blades, hub, and shroud walls were treated with no slip adiabatic conditions.
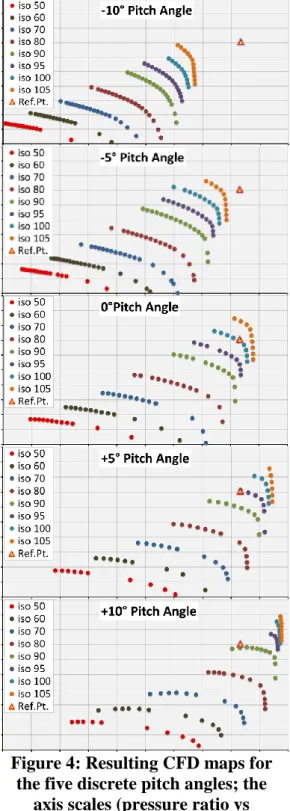
For all five configurations, performance maps were defined with 8 iso speed lines, ranging from 50% to 105% of the nominal rotation speed. For each iso speed line, the outlet boundary condition was modified to simulate the complete operating range from choke to stall. To correctly describe the near stall region, the λ value of the boundary condition would be slightly increased. When the λ value increases, the simulated operating point’s mass flow rate decreases. When the λ value becomes too high, the simulation does not reach a steady state. It would then be considered that stall region was reached. This method was applied for the 8 iso speed lines and for the 5 configurations. This set of calculations has provided what was considered to be a complete performance map. The resulting maps for the 5 pitch angles are presented in Fig.4.
PROOSIS turbomachinery components use two types of maps: the “Beta” maps, described in standard reference frame, and the “MFT” maps. For various reasons that will be outlined in the following, MFT was
Figure 4: Resulting CFD maps for the five discrete pitch angles; the
axis scales (pressure ratio vs corrected mass flow) are the same
6
adopted as the frame of reference for the current map, which is why a transformation needed to be carried out prior to integrating the resulting maps into the engine model.
Transformation of the Maps: Map Fitting Tool (MFT)
The MFT methodology takes description of the given turbomachine’s work and loss coefficients as the starting point for defining its reference frame. Namely, for each iso speed of a fan/compressor a relationship between the work and loss coefficients can be identified, or equivalently, each iso speed line of the map can be represented in terms of the work (GH) and loss (GL) coefficients. In that frame of reference, the iso speed line takes a parabolic shape. When presented in this manner, it is clear that each iso speed line is characterised by work that results in minimal losses. When these minimum loss points are identified for all the speed lines, they give basis for the so called backbone line of the compressor map. In other terms: if the compressor operates along the backbone line, it will be working with minimum losses. Compressor map points are thereby represented in terms of their offset from the backbone line. For more details on the MFT map parameters, and their relation to the standard map parameters, see GE (1984) and Sethi et al. (2013).
In order to transform the five maps, the following input data were required:
Fan map operating points given by: rotational speed regime, pressure ratio, corrected mass flow and efficiency (CFD output in this case);
Fan stage geometry parameters, i.e. characteristic cross section areas and radii;
Inlet reference conditions, i.e. pressure, temperature, humidity level and heat capacity ratio. It is of utter importance to have smooth evolutions of all the MFT parameters used in the modelling as a function of the rotational regime. Consistency of the five maps’ transformation was of utmost importance because the goal was to compile a comprehensive map whose above outlined characteristics would be presented with the additional degree of freedom – fan pitch angle.
The analytical relationship of the MFT parameters is crucial because it enables interpolation and extrapolation of the curves in order to complete a map. Taking into account that CFD calculations of a complete performance map can be time consuming, this sort of capability can be very useful for extending the available operating range of the given component. As shown previously, the five discrete pitch angle maps were spanning from 50% to 105% of the nominal rotational regime with a 5% step between 90% and 105%. In order to accommodate any potentially higher rotational regimes that might occur in the subsequent PROOSIS calculations, this range was extended/extrapolated with two additional speed lines: 110% and 115%.
Finally, for the five performance maps obtained numerically, the surge line is defined by taking the maximum pressure ratio of each rotation speed characteristic curve. In other words, even if the characteristic curve has a positive slope at low mass flow rate, this part is not taken into account (see +10° map in Fig.4).
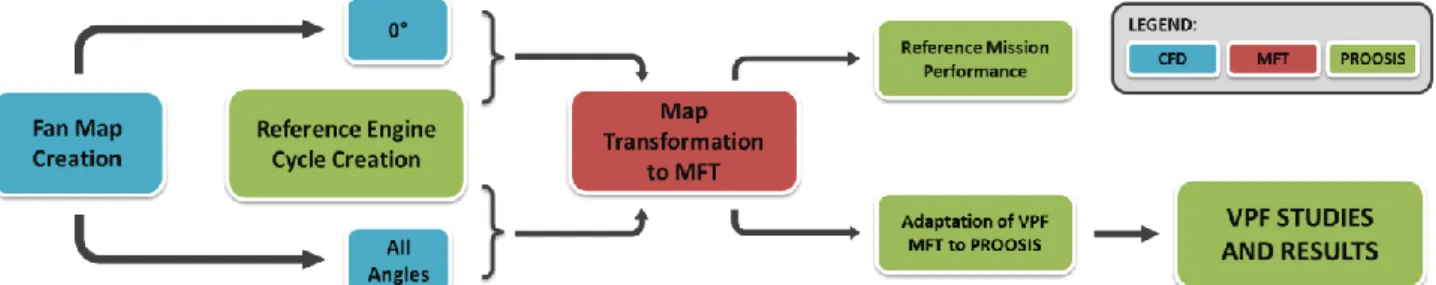
The final variable pitch fan engine modelling procedure, described as an assembly of different previously outlined modelling units, is presented in Fig.5.
Figure 5: Flow chart of the methodology developed to study a variable pitch fan turbofan engine by means of a system modelling approach.
7
VPF PERFORMANCE ANALYSIS Engine Mission
The developed methodology was applied on a mission analysis. In PROOSIS, a mission is constructed using time laws of thrust and flight conditions as input. A typical mission data for the current engine was obtained in the ENOVAL project context. This mission profile is illustrated in Fig.6 in terms of percentage difference from the top of climb condition (Tab.3).
Figure 6: Engine Mission Specification in Terms of Flight Conditions and Net Thrust, Given Relative to the Top of Climb Specification; the Approach and Landing Phases Had to Be
Omitted from the Final Calculations for Technical Reasons
Altitude Mach Number Net Thrust
Top of Climb 10000 m 0.78 22300 N
Table 3: Top of Climb Flight Conditions for the Current Engine Mission
When discussing the engine mission at hand, a particular limitation of the model must be pointed out – the obtained cycle could not operate below roughly 80% of the nominal fan rotational regime (Fig.7, left). A possible explanation of this behaviour was that the best obtainable high pressure compressor map that could be provided for the purposes of this project (for confidentiality reasons) did not sufficiently match the great rotational speed discrepancy between the low pressure and high pressure core, which characterises the engine cycle at hand. For this reason, the approach and landing phases had to be omitted from the final simulation, since mission calculations failed at the top of landing, when attempting to reach low rotational regimes on the fan map.
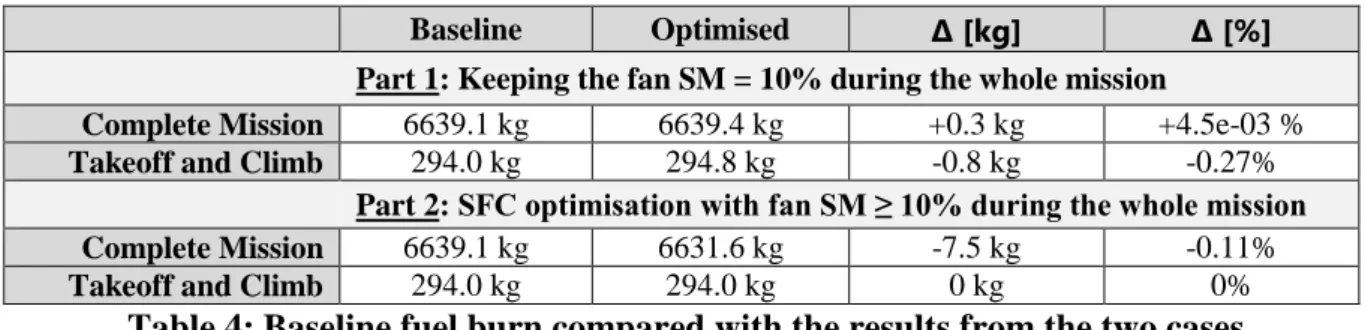
The final baseline mission (baseline being with the fan geometry fixed at 0° pitch) represented by the fan map operating line is shown in Fig.7 (right). In order to avoid redundancy, the calculated baseline fuel burn will be presented in Table 4, where it will be compared to the fuel burned by the optimised cycles. The corresponding fan surge margin time evolution is given in Fig.8. The surge margin parameter that was considered in this work is the surge margin at constant rotational regime, denoted by SMN.
Figure 7: Fan Operating Line Unable to Go Below 80% (Left), and Final Obtained Operating Line for the Baseline Mission: Green-Takeoff and Climb; Red-Cruise (Right)
8
Figure 8: Baseline Fan (Fixed Pitch) SM in Percent, as a Function of the Mission Time
As it can be seen in Fig.8, the baseline fan surge margin is characterised by low SM of 7 to 10% at the very early takeoff, and high SM peaking at 15% during climb, which levels out at around 13% during cruise. From this baseline trend, the interest in VPF in terms of fan SM was identified:
To reduce the unnecessarily high SMN to a prescribed minimal value;
To increase SMN to the same safe minimum during the early takeoff.
Optimisation Studies
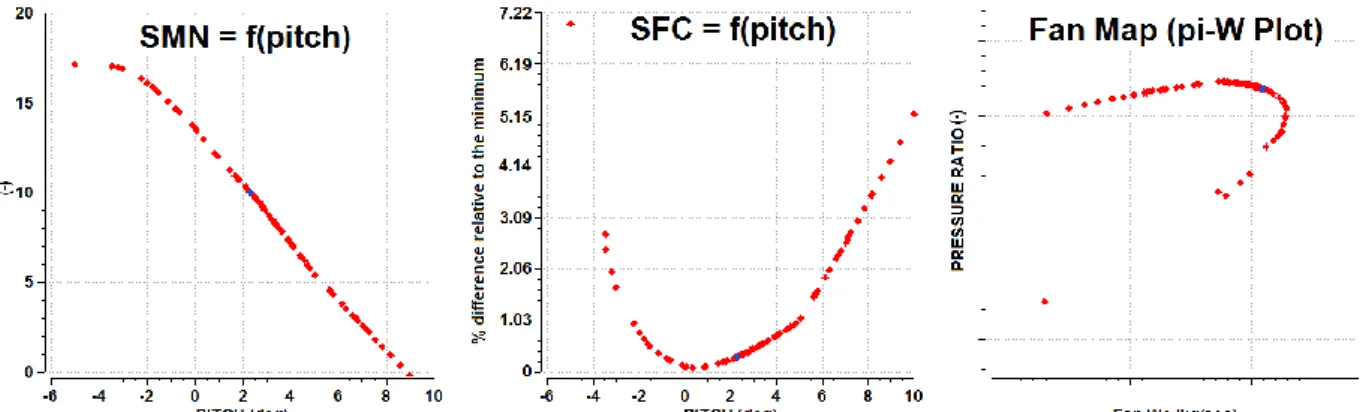
As mentioned in the modelling section, the second part of development work in PROOSIS consisted of expanding the existing component equations, functions and tables in order to accommodate the additional variable, fan rotor blade pitch. The principal aspect consisted of assembling a coherent VPF MFT map file, which encompassed all the five individual CFD maps transformed into MFT. The rest of the work would then consist of expanding the PROOSIS interpolation functions to use the pitch as an additional interpolation parameter. Additionally, this enabled construction of optimisation experiments where the fan pitch could be used as a decision variable. Additionally, the optimisation experiments had to be assembled to enable mission optimisations with pitch angle as the decision variable. In practice this was performed by using the existing point optimisation capability of PROOSIS (see an illustration in Fig.9) combined with the mission calculation presented in Fig.7 (right).
Figure 9: Single Point Optimisation with Fan Pitch as Decision Variable, with Optimised Point Given in Blue; Due to PROOSIS Limitations, a Fan Map Cannot Be Plotted for a
Variable Pitch Case, Which is Why the π-W Was Plotted Separately (Right)
The basic outline of the developed mission optimisation experiment is summarised as follows:
The mission is discretised into given number of points along the time axis, corresponding to the points presented in Fig.6;
Optimisation simulation is then performed sequentially for every mission point;
Each subsequent point is initialised by the previous point results;
9
In this manner, this study was split in two parts, with their respective objective functions given as follows:
Part 1: SMN kept at a constant value of 10%;
Part 2: Optimisation of SFC, with SMN ≥ 10% constraint.
In practical terms, the goal of Part 1 was to observe the VPF engine behaviour if the SMN was to be kept at a fixed value (10%) during the whole mission. The goal of Part 2 (Optimisation) was to assess how much the engine SFC can be further optimised while not allowing the SMN to go below 10%.
DISCUSSION
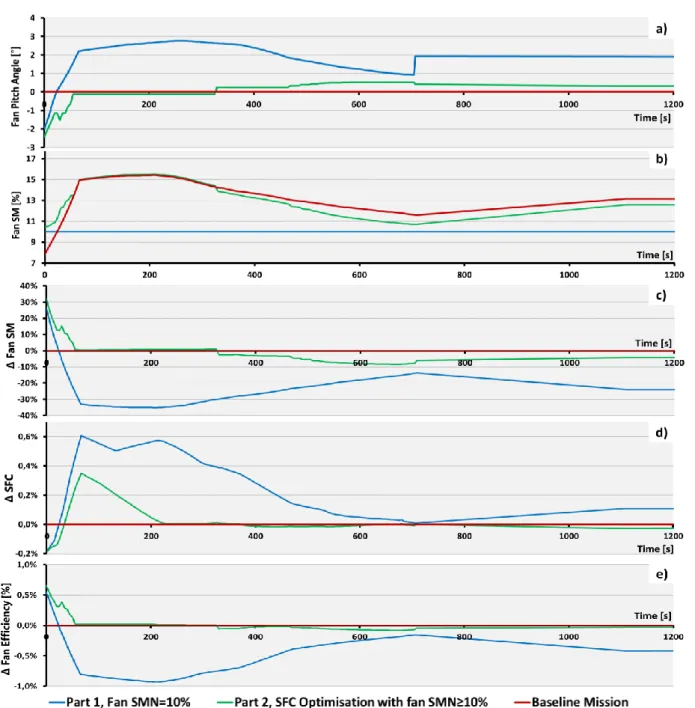
The relevant results of the two optimisations, compared to the corresponding baseline mission performance (Fig.10) are discussed in the following. The reader is reminded that the baseline performance was obtained with the CFD fan map at the nominal (0°) pitch angle. Also note that the
Figure 10: Parameter time evolutions resulting from the two studies, compared to the baseline mission: a) Fan pitch angle, b) Fan SM, c) Fan SM relative to the baseline, d)
10
mission time on the x-axis in Fig.10 is truncated at t = 1200s to improve the clarity of the visualisation. In fact, no significant variation of the presented parameters is observed after this time, which justifies this particular focus on takeoff and climb.
For the baseline mission (given as red curve in Fig.10) where no fan pitch angle variation is considered, the fan SM is higher than 10% except at the early takeoff where its value drops up to 8% (Fig.10b). Part 1 aims at keeping a constant SM value of 10% (Fig.10b), which could mean a reduction of up to 35% relative to the baseline (Fig.10c). To obtain this constant value of SM, the fan pitch angle should be increased up to approx. +3°; on the other hand, at the early takeoff it should be reduced up to -2° (Fig.10a). All intermediate pitch angle variations take place between these two angle values. Compared with the baseline, the consequence is a small increase of SFC: up to 0.4% during the first 700s (except during early takeoff where SFC can be reduced up to -2%) and up to 0.1% during the rest of the mission. In terms of the fuel burnt during the mission, the consumption increase is negligible. (Tab.4)
When it is sought to optimise the SFC with keeping the SM equal to or higher than 10%, the Part 2 (SFC optimisation) demonstrates that there exists some improvement space. In fact, Fig.10d shows that the SFC can be largely reduced during the takeoff and climb phases, compared to Part 1. Thus optimised SFC value remains slightly lower than the baseline during the rest of the mission, i.e. from approx. t = 1000s, all the way until the mission end at t = 26580s. This minor SFC improvement (in other words, very close to the baseline value) is intuitive, because the baseline cycle is designed in order to operate with optimal SFC during the cruise. Furthermore, when this SFC reduction relative to Part 1 is attained, a re-increase of the fan SM is observed (Fig.10b). One remarks that in this case, where the SFC is optimised, it is possible to remain at a SM value higher than the baseline one during the takeoff (Fig.10b). For this optimisation the fan pitch angle varies between -2° and +0.5° (Fig.10a). The same way as it had been found in Part 1, the global impact of the Part 2 optimisation on the fuel burn is negligible (Tab.4).
It is pointed out that an anomaly was observed in terms of the SFC behaviour (Fig.10d), notably between t=50s and t=200s where the fan SM did not change relative to the baseline (Fig.10b), but some degradation of the SFC took place nevertheless. This anomaly is of additional interest since no significant change in fan efficiency was observed during this time period (Fig.10e). The question of how an SFC minimisation optimisation actually led to its increase remains open for the time being, and will be investigated within a further continuation of this work. Nevertheless, even if it had behaved as one might have expected (no change relative to the baseline, or a slight reduction), it would not have had a major impact on the mission fuel burn reduction, which at this moment is -7.5kg. (Table 4)
On the whole, it is observed that the main interest of VPF is the possibility to increase the SM during early takeoff, and during the rest of the mission, it is possible to reduce the SM value if necessary. Although the fan SM can be controlled successfully, the VPF does not seem to be capable of providing a simultaneous improvement in the engine SFC. Simultaneously, this does not come as a disadvantage, because it was also observed that the SM control capability does not have a deteriorating impact on the engine fuel burn.
Baseline Optimised Δ [kg] Δ [%]
Part 1: Keeping the fan SM = 10% during the whole mission
Complete Mission 6639.1 kg 6639.4 kg +0.3 kg +4.5e-03 %
Takeoff and Climb 294.0 kg 294.8 kg -0.8 kg -0.27%
Part 2: SFC optimisation with fan SM ≥ 10% during the whole mission
Complete Mission 6639.1 kg 6631.6 kg -7.5 kg -0.11%
Takeoff and Climb 294.0 kg 294.0 kg 0 kg 0%
11
CONCLUSIONS
VPF was identified primarily as a candidate to ensure a continuous engine safety for nominal configurations characterised by high engine BPR and low fan PR, which would imply compromised fan surge stability at low Mach numbers. For UHBR engines the fan will generate the majority of the thrust, which is why the necessity for continuous fan stability is essential. From the performed work carried out by means of a methodology that combines system modelling in PROOSIS with CFD calculations, it can be seen that VPF can meet the fan surge margin control necessity, in this particular case illustrated by fixing it at prescribed value of 10% throughout the entire mission. Furthermore, the predicted VPF control seems to imply no penalties in fuel burn (calculated through SFC only), which is an important constraint for the contemporary civilian engine industry, as well as the future developments.
For a comprehensive conclusion, it remains yet to be seen how a VPF would impact the safety and fuel performance during the approach and landing phase of the mission, which was not possible to simulate during the current work due to technical limitations. Moreover, at a later phase the presented conclusion on the VPF usefulness in terms of operability and fuel burn would necessarily have to be compared to other technological aspects that are not discussed here, such as system integration, structural complexity, reliability and maintainability, additional drag and added weight.
From the performance and fan stability analysis perspective, further course of action which would solidify and complement the findings presented in this paper should take into account the following few guidelines:
Ensure that the compressor and turbine high pressure core component maps are well adapted to the engine cycle to be modelled in PROOSIS in order to be able to simulate and analyse the entire engine operating range;
Since the choice of the fan pitch angle variation range can have an impact on the computation time, the selected fan pitch angle range should be reconsidered. A narrower fan blade pivoting range, between -5° and +5° seems to be better suited for the purposes of a cycle such as this one.
ACKNOWLEDGEMENTS
The work presented in this paper was carried out within the framework of European Union project ENOVAL (Engine Module Validator), funded by Seventh Framework Program under Grant Agreement no. 604999. The authors would also like to acknowledge the support provided by Safran Aircraft Engines and Empresarios Agrupados.
REFERENCES
Alexiou, A., Tsalavoutas, T., Introduction to Gas Turbine Modelling with PROOSIS, (2011), EAI S.A.
Bensimhon, V., (1986), Fonctionnement hors adaptation des turbomachines, Masson, Paris Dufour G., Garcia-Rosa N., Duplaa S.,(2015), Validation and Flow Structure Analysis in a
Turbofan Stage at Windmill, Proceedings of the Institution of Mechanical Engineers Part A Journal of Power and Energy 229(6):571-583
ENOVAL Proposal, Part B, (2012)
GE Company, (1984), Extended Parametric Representation of Compressor Fans and Turbines,
Volume I; CMGEN User’s Manual, NASA-CR-174645
Haselbach, F., Newby, A., Parker, R., (2014), Concepts & Technologies for the Next
Generation of Large Civil Aircraft Engines, 29th Congress of the International Council of the Aeronautical Sciences, ICAS2014_0078
Hill, P., Peterson, C., (1992), Mechanics and Thermodynamics of Propulsion, Addison-Wesley Publishing Company, USA.
12
Sethi, V., Doulgeris, G., Nind, A., Doussinault, M., Cobas, P., Rueda, A., (2013), The Map
Fitting Tool Methodology: Gas Turbine Compressor Off-Design Performance Modeling, Journal of
Turbomachinery Vol.135, 061010–1-15
Sieber, J., (2015), European Technology Programs for Eco-Efficient Ducted Turbofans, ISABE-2015-20029
Woodward, R.P., Bock, L.A., Hidelberg, L.J., Hall, D.G., (1992), Far-Field Noise and Internal
Modes from a Ducted Propeller at Simulated Aircraft Takeoff Conditions, 30th Aerospace Sciences Meeting and Exhibit, Reno
Zarati, K., Duplaa, S., Carbonneau, X., Tantot, N., (2015), Engine Performance and Surge