Any correspondence concerning this service should be sent
to the repository administrator: [email protected]
This is an author’s version published in:
http://oatao.univ-toulouse.fr/24731
Official URL
DOI : https://doi.org/10.1109/ISBI.2019.8759404
Open Archive Toulouse Archive Ouverte
OATAO is an open access repository that collects the work of Toulouse
researchers and makes it freely available over the web where possible
To cite this version:
Villain, Edouard and Wendt, Herwig and
Basarab, Adrian and Kouamé, Denis On Multifractal Tissue
Characterization in Ultrasound Imaging. (2019) In: 16th IEEE
International Symposium on Biomedical Imaging (ISBI 2019), 8 April
2019 - 11 April 2019 (Venice, Italy).
ON
MULTIFRACTAL TISSUE CHARACTERIZATION IN ULTRASOUND IMAGING
Edouard Villain, Herwig Wendt, Adrian Basarab, Denis Kouam´e
IRIT, CNRS UMR 5505, University of Toulouse, Toulouse, France
[email protected],{herwig.wendt, basarab, kouame}@irit.fr
ABSTRACT
Tissue characterization based on ultrasound (US) images is an extensively explored research field. Most of the exist-ing techniques are focused on the estimation of statistical or acoustic parameters from the backscattered radio-frequency signals, thus complementing the visual inspection of the con-ventional B-mode images. Additionally, a few studies show the interest of analyzing the fractal or multifractal behavior of human tissues, in particular of tumors. While biological experiments sustain such multifractal behaviors, the observa-tions on US images are rather empirical. To our knowledge, there is no theoretical or practical study relating the fractal or multifractal parameters extracted from US images to those of the imaged tissues. The aim of this paper is to investigate how multifractal properties of a tissue correlate with the ones estimated from a simulated US image for the same tissue. To this end, an original simulation pipeline of multifractal tissues and their corresponding US images is proposed. Simulation results are compared to those in an in vivo experiment.
Index Terms— Ultrasound imaging, multifractal analy-sis, tissue characterization
1. INTRODUCTION
Ultrasound (US) imaging is an extensively used imaging modality providing structural information about human tis-sues for number of clinical applications. To complement this structural information, several studies proposed to extract quantitative parameters from conventional B-mode images or raw radiofrequency (RF) data. These works are commonly addressed as tissue characterization or quantitative US. Most of them are based on the estimation of statistical or spectral-based parameters from image regions extracted from different tissues (e.g., [1]) or on the estimation of acoustic parameter maps such as the attenuation coefficient (e.g., [2]).
Based on biological studies showing that certain tissues such as tumors have a multifractal behavior in space and time (e.g., [3]), several existing works proposed to extract the frac-tal or multifracfrac-tal signature of the tissues from US images and to use it for segmentation, characterization or classification purpose (e.g., [4–7]). However, to the best of our knowledge, no theoretical or practical analysis of the good agreement
be-tween the multifractal behavior of the tissues and the multi-fractal signature estimated from US images exists.
Starting from this observation, the aim of this paper is to propose an US simulation pipeline with available ground truth of tissue multifractal characteristics. From this tissue, we generate the corresponding US images. The proposed simulation allows the estimation of the multifractal spectrum from the tissue reflectivity map and from different US imag-ing modes (RF, envelope and B-mode) and to compare them with the ground truth. It thus gives an insight about the rele-vance of the estimated multifractal spectrum from US images. To obtain estimates for the multifractal spectra, use is made of the current state-of-the-art wavelet leader multifractal for-malism [8, 9]. The results obtained with this model lead us to conclude that an important part of the multifractal charac-teristics of the simulated tissues is preserved in US (RF and envelope) images, but B-mode images bear no multifractal ressemblance with simulated tissues; similar findings are ob-tained in a thyroid in vivo experiment.
The remainder of this paper is organized as follows. tion 2 provides a brief summary on multifractal analysis. Sec-tion 3 details the proposed US simulaSec-tion procedure. The sim-ulation and experimental results are regrouped in Section 4, and conclusion and perspectives are presented in Section 5.
2. METHODOLOGY: MULTIFRACTAL ANALYSIS 2.1. Local regularity and multifractal spectrum
Multifractal analysis. Multifractal analysis is a modeling and analysis paradigm that enables texture in an imageF (x) to be characterized based on the fluctuations of its local regu-larity indexh(x) > 0, referred to as the H¨older exponent: the smaller (larger)h(x), the rougher (smoother) F (x) around location x [8, 9]. This caracterization is achieved by means of the so-named multifractal spectrumD(h), which provides a global description of the geometric repartition ofh(x) in space and is defined as the Haussdorf dimension of the sets of points x with identical exponent h(x) = h. Theoretically, D(h) could be any function on the positive real axis taking values in(0, 2) ∪ {−∞}. Yet, it is in practice often sufficient to approximate it as a parabola, i.e.,
Fig. 1. Multifractal spectrum. D(h) (center) is defined as the fractal dimension of the iso-H¨older sets of the image (sketched in red for a 1D slice andh = 0.2, left) and can be approximated with a parabola with parameters(c1, c2).
see Fig. 1 for an illustration. Practical multifractal analysis thus essentially consists in estimating the parameters in this approximation:c1, which quantifies the average regularity of F and accounts for self-similarity, whereas c2≤ 0 quantifies the regularity fluctuations and accounts for multifractality [9]. Multifractal models. Several works proposed the use of the seminal fractional Brownian motion (fBm), the only Gaussian self-similar model process with stationary incre-ments, for modeling US images [6, 10, 11]. FBm is controlled by one single parameter, the self-similarity parameterH, and has regularityh(x) = H everywhere, hence c1= H, c2= 0, andD(h) = δ(h − H). Yet, c2was observed to be strictly negative for US images, c2 < 0 [7, 12]. This calls for the use of multifractal models that are more flexible to account for the non Gaussian and complex, intermittent regularity fluctuations observed in in vivo data. For further details about multifractal models, see, e.g., [8] and references therein.
2.2. Estimation of the multifractal spectrum
Wavelet leaders. The current state-of-the-art procedure for estimating D(h) relies on the wavelet leaders of dis-crete wavelet transform (DWT) coefficients and will be used here. The DWT coefficients of F are defined as inner products d(m)F (j, k) = hF, ψ
(m)
j,ki, m = 0, . . . , 3 with an (L1-normalized) orthonormal basis of 2D wavelets [13]. They can be defined as the dilated (to scale 2j) and translated (to position k2j) tensorial products ψ(0)(x) = φ(x1)φ(x2), ψ(1)(x) = ψ(x1)φ(x2), ψ(2)(x) = φ(x1)ψ(x2), ψ(3)(x) = ψ(x
1)ψ(x2) of the scaling function φ(x) and mother wavelet ψ(x) for a 1D multiresolution analysis, ψ(m)j,k(x) , 2−jψ(m)(2−jx − k). The wavelet leaders are then defined as the largest DWT coefficients, across all finer scales and within a small spatial neighborhood 3λj,k [8]: ℓ(j, k) = supm∈(1,2,3),λ′⊂3λj,k|2
jγd(m) F (λ
′)|, where λ j,kis the dyadic cube of side length2j centered at k2j,3λ
j,k = S
n1,n2={−1,0,1}λj,k1+n1,k2+n2 the union of this cube with its eight neighbors, andγ > 0 is a parameter that can be tuned to match minimum regularity conditions onF and will not be further discussed here. For technical details, see, e.g., [8, 9]. Multifractal formalism. It is well documented that the
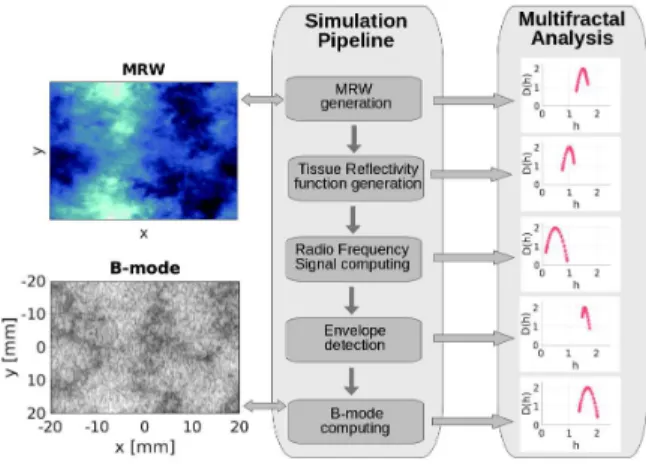
Fig. 2. Schematic view of the proposed simulation pipeline: i) generation of MRW image with prescribed mul-tifractal properties; ii) TRF generation from randomly placed random scatterers with variance controlled by the MRW im-age; iii) convolution of the TRF with a system PSF to obtain RF image; iv) detection of the envelope of each RF signal; v) B-mode image obtained by log-compression; multifractal analysis is conducted at each level of the simulation pipeline.
empirical q-th order moments of wavelet leaders behave as power-laws with respect to analysis scales2j for multi-fractal processes, Pkℓ(j, k)q ∼ 2jζ(q) in the limit of fine scales. It can be shown that the so-termed scaling expo-nents ζ(q) characterizing these power laws are tied to the multifractal spectrum via a Legendre transform: L(h) = infq(2 + qh − ζ(q)) ≥ D(h). This theoretical link permits to define simple and robust estimators for multifractal pa-rameters. In particular, the power-law behavior ofq-th order moments can be rewritten in terms of the cumulants of or-derp ≥ 1, Cp(j) = Cump(ln ℓ(j, k)), of the log-leaders ln ℓ(j, k): Cp(j) = c0p+ cpln 2j. This has classically lead to the estimation ofc1andc2by linear regressions of the aver-age and sample variance ofln ℓ(j, k) as functions of ln 2j[8]. Finally, it can be shown that the coefficients c1 and c2 in this relation are precisely the coefficients of the parabolic approximation forD(h) in (1).
3. US IMAGE SIMULATION PIPELINE The proposed US simulation aims at investigating the rela-tionship between the multifractal parameters of a tissue and the ones extracted from the resulting simulated image. Thus, the simulation pipeline follows the standard strategy used in US literature, but use is made of a tissue reflectivity func-tion that is computed from a synthetic image mimicking a tis-sue with known multifractal ground truth, and the multifractal spectrum is estimated independently for each simulated im-age. The pipeline is illustrated in Fig. 2 and detailed next.
(a) c1estimation
(b) c2estimation
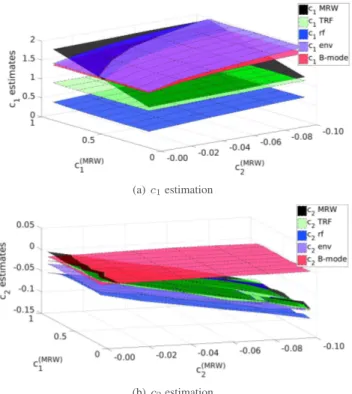
Fig. 3. Average values ofc1andc2estimates over100 trials for several simulations with controlled multifractal properties.
i) Multifractal image. The first step consists in generating an image with controlled multifractal properties. In this pa-per, this is achieved using multifractal random walk (MRW). MRW mimicks the multifractal properties of the celebrated Mandelbrot multiplicative cascades, and its multifractal spec-trum is given byD(h) = 2 + (h − c1)2/(2c2), see [14,15] for technical details and definitions. It is chosen here for its ease of numerical synthesis and independent tuning of multifrac-tal parameters. Synthesis procedures were implemented by ourselves as described in [16] and are available upon request. ii) Tissue reflectivity function (TRF). The second step consists in generating a TRF, mimicking the scattering map, i.e., the presence of small particles (scatterers) in the human body that diffuse the propagating US waves. This TRF is computed from the MRW image as follows. First, scatterer positions are drawn at random from a uniform distribution in the field of view, in order to obtain US images with speckle characteristics close to those obtained in practical situations (see, e.g., scatterer map generation examples available within Field II simulator [17]). Then each scatterer is assigned a random amplitude, drawn from a zero mean Gaussian distri-bution with variance prescribed by the value of the MRW im-age pixel closest to its position. Finally, the scatterer map is interpolated on a rectangular grid, yielding a regularly sam-pled TRF enabling fast processing for the remaining simula-tion steps.
(a) c1estimation
(b) c2estimation
Fig. 4. Average and standard deviation values for estimates ofc1(forc2= −0.06 fixed) and c2(forc1= 0.5 fixed).
iii) RF signal. Next, the TRF is convolved with a realistic point spread function generated with Field II simulator [17], resulting into an RF image.
iv) Envelope. The RF image is further axially demodu-lated, resulting into an envelope image.
v) B-mode image. Finally, the RF image is log-compressed to obtain the standard B-mode image used in clinical routine. An example of an MRW image and the resulting final B-mode image is shown in Fig. 2 (left).
4. RESULTS 4.1. Simulation results
Collections of MRW images with various multifractal param-eters were simulated as described above. The value for the self-similarity parameter was set toc1 ∈ (0.1, 0.2, . . . , 0.9), and for the multifractality parameter toc2∈ (−0.1, −0.08, . . . , −0.02, 0), covering a large variety of realistic multifrac-tal properties. For each combination(c1, c2), 100 indepen-dent realizations of MRW of size512 × 512 were synthesized and used in the simulation pipeline. The parametersc1and c2were estimated for MRW, TRF, RF, envelope and B-mode images, respectively, as detailed in Sec. 2, using Daubechies1 wavelets,j1 = 3, j2 = 6 and γ = 2; values reported for c1correspond to the primitive of the image. Results reported
(a) (b) (c) (d)
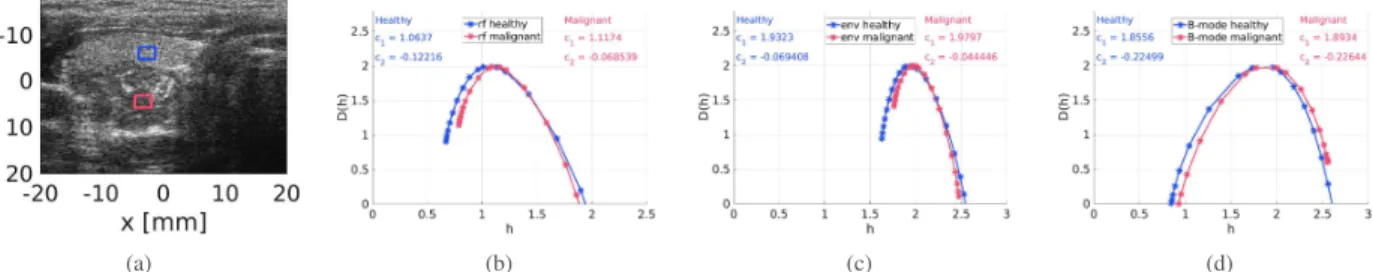
Fig. 5. (a) B-mode image representing a thyroid with a malignant tumor, with blue (healthy tissue) and red (tumor) rectangles highlighting the analysed patches. (b-d) Multifractal spectra estimated from the respective RF, envelope and B-mode images.
below correspond to averages and standard deviations of esti-mates computed over independent realizations.
Fig. 3 plots average estimates for the self-similar pa-rameter c1 (top) and the multifractal parameterc2 (bottom) obtained for MRW, TRF, RF, envelope and B-mode images, respectively, as a function of the values for(c1, c2) prescribed for MRW. Estimations for MRW perfectly match the pre-scribed values, confirming the accuracy of the wavelet leader multifractal formalism [8]. As far as the simulated TRF and US images are concerned, Fig. 3 yields the following con-clusions: For the B-mode image, neitherc1norc2estimates reveal changes in the multifractal properties of the MRW tissue model. For the TRF, RF and envelope images, the val-ues estimated for the parameter c1 capturing self-similarity is also insensitive to changes in the value that is prescribed for MRW. However, the estimated values for the parameter c2that measures multifractality strongly correlate with those prescribed for MRW.
Fig. 4 proposes a more quantitative analysis and plots the average and standard deviation values for c1 (with constant c2= −0.06) and for c2(with constantc1= 0.5). The results confirm that the estimates for the multifractality parameterc2 for the simulated TRF, RF and envelope images strongly cor-relate with the values prescribed forc2. In other words, these images enable us to measure the multifractality of the syn-thetic tissue. This is not the case for the B-mode image, for whichc2≈ 0. The results also show that the estimates for c1 for any (TRF, RF, envelope and B-mode) simulated image are not coherent with the values forc1prescribed for the MRW underlying the simulation. One potential explanation for this observation could be that the independent random amplitudes of the scatterers in the TRF generation process bury the self-similarityc1of MRW.
4.2. Illustration for experimental data
We complement the simulation study with a result on an in vivoimage acquired from a patient with a malignant thyroid tumor. Multifractal spectra were estimated for two image patches extracted from the tumor and the healthy thyroid tis-sue, respectively. To match the simulation, the patches were
interpolated to images of size512 × 512, with isotropic ax-ial and lateral resolution of≈ 6.5µm. The B-mode image and these two patches are shown in Fig. 5(a). In this ex-periment, only the US modes (RF, envelope and B-mode) were available. Thus, three pairs (healthy vs. tumor) of mul-tifractal spectra were estimated and are plotted in Fig. 5(c-d). We observe that the spectra estimated from the B-mode image are not highlighting any difference between the two tissues. However, the spectra estimated on RF and envelope images have different shapes for the healthy and pathologi-cal tissues. These different shapes are reflected by different valuesc2< 0, which is precisely the parameter that was ob-served to correlate with the multifractal properties of tissues in the above simulations. These differences could hence indi-cate a change in multifractality for the tissues. The position of the modes of the spectra, quantified byc1, are observed to co-incide - hence to be not discriminative - for the US images for both tissues, in coherency with the above simulation results.
5. CONCLUSION AND PERSPECTIVES Multifractal analysis for US images aims at providing addi-tional, quantitative information about the human tissues and has proven useful in classification or tissue characterization tasks. This work studied the relevance and interpretability of the estimated multifractal properties with respect to those of the tissues themselves through a simulation case. Its main originality comes from the simulation of US data from images with available multifractal ground truth, enabling the compar-ison of multifractal parameters estimated for US image with those of the multifractal ground truth, and assessing their cor-relation. In this model we observed that (i) while self-similar properties can be buried, the truly multifractal behavior is pre-served in US images compared to the simulated tissues and (ii) B-mode images bear no multifractal ressemblance with simulated tissues. Results on real-world US images of tissue lead to similar conclusions. Our study opens several perspec-tives including a theoretical analysis of the simulation results, evaluation of the impact of deconvolution algorithms giving access to the TRF, and the analysis of in vivo data sets.
6. REFERENCES
[1] M. L. Oelze and J. Mamou, “Review of quantitative ul-trasound: Envelope statistics and backscatter coefficient imaging and contributions to diagnostic ultrasound,” IEEE Transactions on Ultrasonics, Ferroelectrics, and Frequency Control, vol. 63, no. 2, pp. 336–351, Feb 2016.
[2] A. L. Coila and R. Lavarello, “Regularized spectral log difference technique for ultrasonic attenuation imag-ing,” IEEE Transactions on Ultrasonics, Ferroelectrics, and Frequency Control, vol. 65, no. 3, pp. 378–389, March 2018.
[3] M. Molski and J. Konarski, “Tumor growth in the space-time with temporal fractal dimension,” Chaos, Solitons & Fractals, vol. 36, no. 4, pp. 811 – 818, 2008. [4] M. A. Mohammed, B. Al-Khateeb, A. N. Rashid, D. A.
Ibrahim, M. K. A. Ghani, and S. A. Mostafa, “Neural network and multi-fractal dimension features for breast cancer classification from ultrasound images,” Comput-ers& Electrical Engineering, vol. 70, pp. 871 – 882, 2018.
[5] R. Zhou, Y. Luo, A. Fenster, J. D. Spence, and M. Ding, “Fractal dimension based carotid plaque characteriza-tion from three-dimensional ultrasound images,” Med-ical & BiologMed-ical Engineering & Computing, Jul 2018. [6] O. S. Al-Kadi, “Fractals for biomedical texture
analy-sis,” in Biomedical Texture Analysis, A. Depeursinge, O. S. Al-Kadi, and J. Mitchell, Eds. Academic Press, 2017, pp. 131 – 161.
[7] M. Djeddi, A. Ouahabi, H. Batatia, A. Basarab, and D. Kouam´e, “Discrete wavelet for multifractal texture classification: application to medical ultrasound imag-ing,” in 2010 IEEE International Conference on Image Processing, Sept 2010, pp. 637–640.
[8] H. Wendt, P. Abry, and S. Jaffard, “Bootstrap for empiri-cal multifractal analysis,” IEEE Signal Processing Mag-azine, vol. 24, no. 4, pp. 38–48, 2007.
[9] H. Wendt, S. G. Roux, P. Abry, and S. Jaffard, “Wavelet leaders and bootstrap for multifractal analysis of im-ages,” Signal Processing, vol. 89, no. 6, pp. 1100–1114, 2009.
[10] D.-R. Chen, R.-F. Chang, C.-J. Chen, M.-F. Ho, S.-J. Kuo, S.-T. Chen, S.-J. Hung, and W. K. Moon, “Classifi-cation of breast ultrasound images using fractal feature,” Clinical imaging, vol. 29, no. 4, pp. 235–245, 2005. [11] W.-L. Lee, Y.-C. Chen, and K.-S. Hsieh, “Ultrasonic
liver tissues classification by fractal feature vector based
on m-band wavelet transform,” IEEE Transactions on Medical Imaging, vol. 22, no. 3, pp. 382–392, 2003. [12] R. Lopes and N. Betrouni, “Fractal and multifractal
analysis: A review,” Medical Image analyis, vol. 13: 634-49, 2009.
[13] S. Mallat, A Wavelet Tour of Signal Processing, 3rd ed. Academic Press, 2008.
[14] E. Bacry, J. Delour, and J.-F. Muzy, “Multifractal ran-dom walk,” Phys. Rev. E, vol. 64: 026103, 2001. [15] P. Abry, P. Chainais, L. Coutin, and V. Pipiras,
“Mul-tifractal random walks as fractional wiener integrals,” IEEE Transactions on Information Theory, vol. 55, pp. 3825–3846, 2009.
[16] L. Chevillard, R. Robert, and V. Vargas, “A stochastic representation of the local structure of turbulence,” Eu-rophysics Letters, vol. 89, p. 54002, March 2010. [17] J. Jensen, “Simulation of advanced ultrasound systems
using Field II,” in IEEE International Symposium on Biomedical Imaging: Nano to Macro, 2004, April 2004, pp. 636–639 Vol. 1.