O
pen
A
rchive
T
oulouse
A
rchive
O
uverte
(OATAO)
OATAO is an open access repository that collects the work of some Toulouse
researchers and makes it freely available over the web where possible.
This is
an author'sversion published in:
https://oatao.univ-toulouse.fr/23083Official URL :
https://doi.org/10.1007/s00414-016-1466-5
To cite this version :
Any correspondence concerning this service should be sent to the repository administrator:
Nougarolis, Florence and Mokrane, Fatima-Zohra and Sans, Nicolas and Rousseau, Hervé
and Dedouit, Fabrice and Telmon, Norbert Bone age estimation based on multislice computed
tomography study of the scapula. (2016) International Journal of Legal Medicine, 131 (2).
547-558. ISSN 0937-9827
OATAO
Bone age estimation based on multislice computed tomography
study of the scapula
Florence Nougarolis l,2,3 · Fatima-Zohra Mokrane 1•3 • Nicolas Sans4 •
Hervé Rousseau3
• Fabrice Dedouit1•2•3 • Norbert Telmon1•2
Abstract Progress in medical imaging bas opened new areas of research in forensic anthropology, especially in the context of the study of bone age assessment. The study of bone age bas become a useful tool for age estimation at death or age of young adult migrants in an anthropological context. We retrospectively evaluated multislice computed tomography (MSCT) explorations focused on scapulae of 232 individuals (123 males; 109 females) aged between 8 and 30 years old. Computed tomography (CT) scans were viewed in axial and multiplanar reconstructed images using OsiriX 5.9 (64 bit)®. The ossification centers of the scapula studied were as follows: acromial, sub-coracoid, glenoid, coracoid, coracoid apex, and inferior angle epiphyses. Fusion status was scored based on a five--stage system (stage 1: no ossification, stage 2: visualization of an ossification center, stage 3: partial ossification, stage 4: full ossification associated to an epiphy seal scar, and stage 5: fu ll
181 Florence Nougarolis
florence.nouga [email protected]
1 Laboratoire d' Anthropologie Moléculaire et Imagerie de Synthèse (AMIS), UMR 5288 CNRS, Faculté de Médecine, 37 Allées Jules Guesde, 31073 Toulouse, France
2 Service de Médecine Légale, Centre Hospitalier Universitaire Toulouse Ra ngueil, 1 Avenue du Professeur Jean Poulhès, TSA 50032, 31059 Toulouse, France
3 Service de Radiologie, Centre Hospitalier Universitaire Toulouse Rangueil, 1 Avenue du Professeur Jean Poulhès, TSA 50032, 31059 Toulouse, France
4 Service de Radiologie, Centre Hospitalier Universitaire Toulouse Purpan Hôpital Pierre Paul Riquet, 330 Avenue de Grande Bretagne, 3 1059 Toulouse, France
ossification without epiphyseal scar). Intra-observer vari ability was excellent, and inter-observer variability was good, demonstrating the reliability of this MSCT staging system. The fusion of scapular ossification centers was sta ti stically associated with age (p<0.001) but not with sex
(p > 0.05). In conclusion, MSCT of the scapula is an effi
cient method for age assessment, which is complementary to preexisting methods particularly for specifying the 18-year threshold. Further studies with larger groups are needed to support our results.
Keywords Age assessment • Scapula • Forensic •
Anthropology • Multislice computed tomography
Introduction
The study of age assessment represents a significant part of forensic anthropological activity. Interest in the study of skel etal age markers is increasing due to growing requests to fo rensic practitioners to provide more accurate age estimation, one of the important factor s helping in identification. Immigration is at the center of political, ethical, economic, and social debate in Europe. Forensic age estimation of living young adults bas become an important focus ofinterest during recent years; growing migration into Europe and between European countries bas led to an increased number of for eigners who cannot provide evidence for their exact date of birth. Indeed, young foreign people often have no identifica tion document proving their correct birth dates. E stablishing the age of majority is therefore fundamental in orderto deter mine which system bas to be applied: the juvenile or the adult one. As well as immigration implications, forensic age esti mation is also used to determine whether a suspected offender is subject to juvenile or adult criminal law. The relevant age
thresholds for judicial and administrative proceedings lie be-tween 14 and 21 years old in most countries [1].
According to the recommendations of the Arbeitsgemeinschaft für Forensische Altersdiagnostik (AGFAD) (study group for forensic age diagnostics), age assessments in criminal pro-ceedings should be based on general physical examination, X-ray examination of the hand, and odontological examina-t i o n b y a d e n examina-t i s examina-t , i n c l u d i n g d e n examina-t a l s examina-t a examina-t u s a n d orthopantomogram. In order to improve diagnostic reliabili-ty, these methods should always be used in combination, en-suring that each part is performed by forensically trained and experienced experts of the relevant disciplines [2,3]. If the bony fusion of the hand and wrist is complete, an additional computed tomography (CT) examination of the clavicles is recommended, in order to demonstrate that the person has reached the age of 18 or 21 [1,2,4,5]. Age assessment prop-erly performed helps to enhance legal certainty by ensuring equal treatment of persons with or without valid identity doc-uments. On one hand, they help prevent perpetrators from wrongfully benefiting from false claims to be younger than they really are. On the other hand, they supply exonerating evidence for persons who are erroneously suspected of mak-ing false statements about their age [6].
Several studies demonstrated this last year’s utility of staging system methods, using bone cross-sectional imaging, with CT or magnetic resonance imaging (MRI). Ekizoglu and Wittschieber demonstrated the interpretation issues related to radiographic incidence. Their studies demonstrated that the as-sessment of medial clavicle ossification by CT must be realized on thin-slice CT examinations, with an experienced observer [5, 7–9]. Other bone structures were also tested in age estimation, like radiographic study on cervical spine [10]. MR studies tend to increase in frequency, according to cross-sectional imaging increasing performances. Different bone structures were stud-ied, like the medial clavicle, distal tibia and calcaneus [11,12], iliac crest [13], proximal tibial epiphysis [14], hand-wrist [15], and distal femur [16–18], but also the third molar [19].
The scapula is a flat triangular bone that lies over the pos-terior surface of the rib cage and forms the pospos-terior part of the shoulder girdle. At its upper lateral corner, it exhibits a cuplike depression (glenoid fossa) that forms a socket for the head of the humerus. The posterior surface of the bone is divided by a nearly horizontal ridge (scapular spine) extending laterally to form the acromion, a projection which overhangs the glenoid fossa. The anterior surface just medial to the glenoid fossa has a beak-like projection (coracoid process) that acts as an attach-ment for muscles and ligaattach-ments. The scapula is a bone partic-ularly adapted to skeletal age determination. It has several centers for ossification, uniting in various parts of the bone in a particular sequence at different ages. First, the primary center appears in the first year of life; then, seven secondary centers begin to appear at 8 years old. Fusion is generally
completed at 23 years old [20]. These points give to the
scapula particular importance in skeletal age estimation during
growth periods [20]. Scapular development analysis appears
useful for providing answers to judicial authorities.
To our knowledge, there is no three-dimensional study which has evaluated the scapula ossification centers as a method for age assessment. Obviously, the skeletal maturation of the scap-ula has already been studied anthropologically on dry bones [20,21] but not radiologically on living persons. Eight scapular ossification centers were described by Scheuer and Black [20]. Study using dry bones leads to important knowledge regard-ing ossification centers. The primary ossification center for the coracoid usually appears within the first years of life [22], and fusion to the scapula generally occurs at around 14–15 years
[23]. Among the secondary ossification centers, the sub
coracoid center appears between 8 and 10 years [24,25], with complete fusion achieved by 16–17 years for both sexes [26]. The glenoid center appears at around 14–15 years [26–28] and completes its fusion between 17 and 18 years [20]. The epiph-ysis for the apex of the coracoid process appears between 13 and 16 years and merges by the age of 20 [26,28,29]. The acromial epiphysis appears between 14 and 16 years old, and fusion occurs by 18–20 years old [30–34]. The inferior angle of the scapula develops from a secondary ossification center, which appears at around 15–17 years old and merges by 23 years old [24,26,28,29,31–33]. It is a small epiphysis that merges directly at the angle of the scapula and then sends a small tongue along the medial border. The epiphysis of the
coracoid process angle appears at around 14–15 years and
merges at the age of 20 years [26,28,29]. This epiphysis was not analyzed in our study because of the difficulty of identifying this structure on CT examinations. This center is angular and very difficult to identify. The vertebral border epiphysis is frag-ile, long, and multipartite and arises from several bone islands,
which merge secondarily. These islands appear at around 15–
17 years old, and fusion is completed by 23 years old [24,26, 28,31,33,35]. All ossification centers were studied, except the vertebral border because it was hardly identified on different CT examinations done on living persons.
The aim of the present study was the elaboration of a CT staging system based on the analysis of fusion of the ossifica-tion centers of the scapula of living human subjects in order to estimate bone age in a population ranging from the 8th to the 31st year of life. This permits us to assess if this age marker is a potentially useful tool for age estimation by evaluating the reliability of the staging.
Materials and methods
SampleWe carried out a retrospective study of clinical thoracic multislice computed tomography (MSCT) explorations performed between
March 2013 and January 2015 in the University Hospital of Toulouse, southwest France. MSCT explorations were obtained through a local picture archiving and communication system (PACS) (McKesson Medical Imaging Group, Richmond, BC, Canada). Patients underwent MSCT examinations for various reasons, such as thoracic trauma or cardiopulmonary disease. A total of 263 MSCT examinations were included in this study (144 males, 119 females). Patients were aged from 7.4 to 30.6 years old (8th and 31st year of life, respectively). We analyzed 159 right scapulas and 104 left scapulas. Age distribution of these subjects by sex is shown in Table1.
Thirty-one MSCT explorations with bilateral scapular study were used to evaluate statistical side differences. For these cases, left scapula CT examinations were excluded from the final analysis.
The data and images were recorded anonymously. Data were recorded for the individuals including sex, date of birth, date of the examination, and CT acquisition parameters. According to French law, the results of medical imaging ex-aminations may be used retrospectively without the patient’s consent when the examinations have been carried out for clin-ical purposes and when they have been recorded anonymously (Article 40-1, Law 94-548 of 1 July 1994).
The inclusion criteria consisted of the following:
– Absence of pathological modification of the shoulder: no tumor, no direct acute trauma, no infection, arthritis, nor dysplasia.
– Suitable CT scan parameters: visualization of the entire shoulder, slice thickness < 2 mm, and overlapping recon-struction interval < 1 mm.
– For each year of age between 8 and 30 years old, we randomly selected approximately five men and five women.
The socioeconomic level of individuals and ethnic origin was not taken into account, as it was not available.
MSCT examinations
MSCT was performed on Sensation-16 (Siemens, Erlangen, Germany) and Brilliance-16 (Philips Brilliance, Philips Medical Systems, Amsterdam, The Netherlands) systems. The image matrix was 512 × 512 pixels for the Sensation-16 and 1024 × 1024 pixels for the Brilliance-16. The following
parameters were used: tube voltage, 120 kV; effective mAs, 120. Different parameters of slice thicknesses and reconstruc-tion secreconstruc-tion thicknesses were used in our study. These ele-ments are detailed in Table2.
CT analysis
CT scans were saved in DICOM format (Digital Imaging and Communications in Medicine), and postprocessing was per-formed with OsiriX® 5.9 (64 bit). Multiplanar reconstructions (MPR) were performed along the axis of the ossification cen-ters in the sagittal, coronal, and axial planes. This assessment was performed by a radiologist, after 6-month experience in forensic and anthropological radiology. Intra-observer vari-ability was tested, after a lap time of 2 months between the evaluations. Also, in order to evaluate the inter-observer var-iability, 20 CT examinations selected randomly were also studied by an experienced radiologist. Each radiologist was totally blinded to patient identification data and the other ra-diologist results.
CT staging
We analyzed six ossification centers of the scapula, according to the detailed descriptions of Scheuer and Black: the acromial epiphysis, coracoid epiphysis and sub-coracoid epiphysis, glenoid epiphysis, apex of the coracoid epiphysis, and inferior angle epiphysis. They undergo fusion during adolescence and early adulthood. An illustration of these ossification centers is
shown in Fig.1. The staging system was developed based on
five CT developmental stages. The six ossification centers were evaluated separately in MPR mode. The staging
classi-fication of Schmeling et al. [36] was used to evaluate the
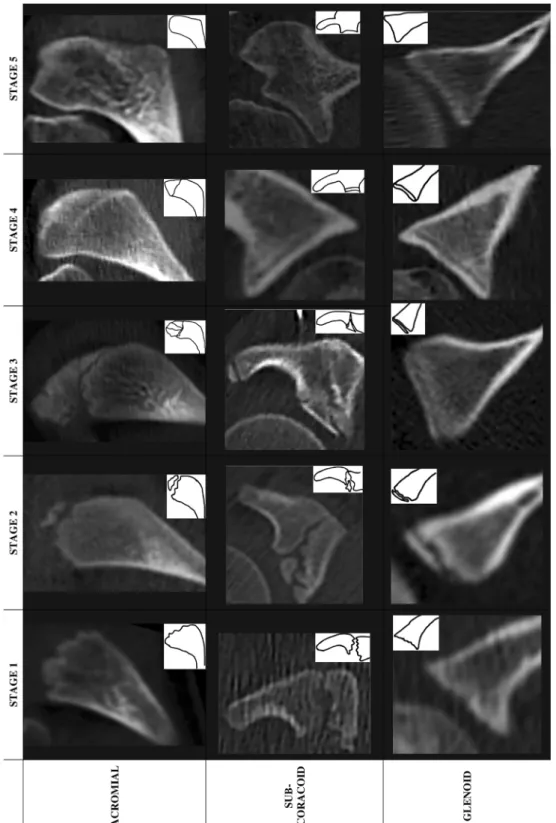
ossification status for all epiphyseal centers of the scapula except for the coracoid epiphysis. Indeed, this center usually appears within the first year of life (consequently, there was no stage 1 and only stages 2 to 5 were designated). The staging appeared as follows (Fig.2):
– Stage 1: ossification center not ossified
– Stage 2: ossification center ossified and epiphyseal carti-lage not ossified
– Stage 3: epiphyseal cartilage partially ossified
– Stage 4: epiphyseal cartilage fully ossified and epiphyseal scar visible
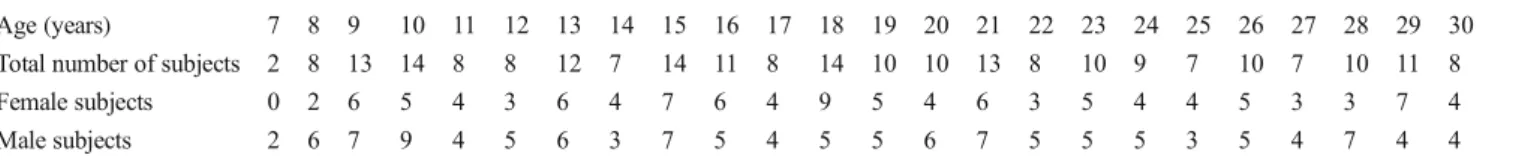
Table 1 Age (years) distribution of subjects by sex
Age (years) 7 8 9 10 11 12 13 14 15 16 17 18 19 20 21 22 23 24 25 26 27 28 29 30
Total number of subjects 2 8 13 14 8 8 12 7 14 11 8 14 10 10 13 8 10 9 7 10 7 10 11 8
Female subjects 0 2 6 5 4 3 6 4 7 6 4 9 5 4 6 3 5 4 4 5 3 3 7 4
– Stage 5: epiphyseal cartilage fully ossified and epiphyseal scar no longer visible
Statistical analysis
Statistical analysis was performed using R 3.1.3
soft-ware [37]; Cohen’s kappa nonparametric test was used
to evaluate intra- and inter-observer variability and side
differences [38, 39]. Descriptive statistical analysis was
performed to determine the mean age, standard devia-tion, and age range with a 95 % confidence interval for each epiphyseal center. We then used variance analysis (ANOVA) to determine if there was a significant differ-ence between sex groups for each epiphyseal center.
Results
PopulationA total of 232 patients were included, including 123 males and 109 females, with an age range of 8 to 30 years old. This large age range was chosen because it included the different thresh-old ages of criminal liability. The ethnic origin of the
retrospectively selected patients was not taken into consider-ation because only the patients’ names and dates of birth were available in the local PACS.
Intra- and inter-observer variability
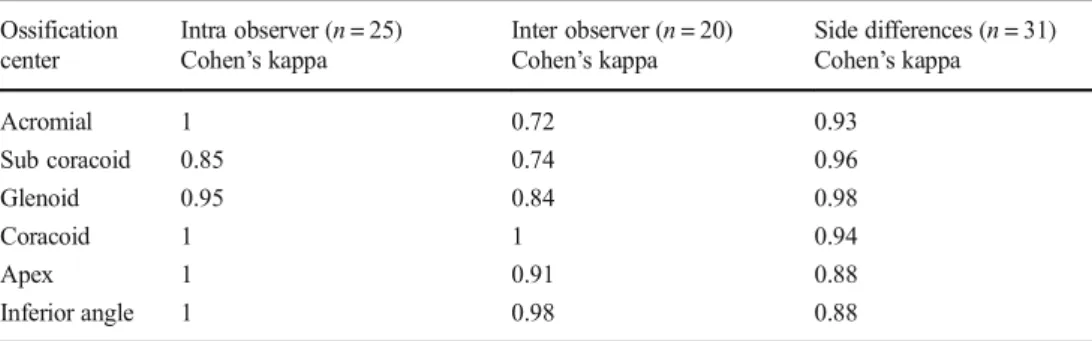
Intra-observer variability was tested on a sample of 25 random-ly selected CT examinations. A time lapse of 2 months was observed between the two reports for each case. Inter-observer variability was tested on a sample of 20 CT examina-tions. Cohen’s kappa nonparametric test revealed excellent intra-observer reproducibility and good inter-observer repro-ducibility (Table3). Indeed, intra-observer variability was be-tween 0.85 and 1 (excellent), while inter-observer variability was between 0.72 and 1 (good).
Side differences
The influence of the side differences of the scapula was also tested in our study. Among the 159 right scapulas included in our study, 31 patients had also their left scapulas included in their CT scans and were used to study side differences. For these cases, left sides were excluded from the final analysis, to avoid redundancy.
Cohen’s kappa nonparametric test confirmed the absence of statistically significant differences between right and left
Table 2 Multislice computed tomography (MSCT) reconstruc tion parameters
Slice thickness/interval (mm) 1.0 0.5 1.0 1.0 2.0 1.0
Number of MSCT investigations 45 (19.4 %) 91 (39.2 %) 96 (41.4 %)
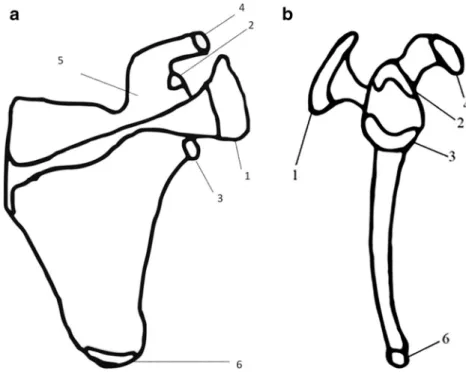
Fig. 1 Illustration of a scapula: anterior view (a) and sagittal view (b), showing the location of the primary and secondary ossification centers studied. 1, acromial; 2, sub coracoid; 3, glenoid; 4, coracoid apex; 5, cor acoid; 6, inferior angle
b
sides in relation to chronological age and degree of cation for each epiphyseal center and each stage of ossifi-cation (31 patients: 31 right scapulas and 31 left scapulas) (p > 0.05) (Table3).
Correlation between age and ossification stage
For both sexes and for each epiphyseal center, study of vari-ance demonstrated that there was a good correlation between
Fig. 2 CT reconstructions and schematic illustrations of the ossification center aspects for each stage. a CT reconstructions and schematic illustrations of the ossification aspects for acromial, sub coracoid, and
glenoid centers for each stage. b CT reconstructions and schematic illustrations of the ossification aspects for apex of coracoid, coracoid, and inferior angle centers for each stage
ACROMIAL
age and the stage of ossification, for each epiphyseal center. A summary of the data for the age of epiphyseal union of each epiphyseal center by sex is presented in Table4. This result was significant with p < 0.001. Also, there was no significant impact due to sex (p > 0.05). Illustratively, Fig.3shows, for
each ossification center, minimum age, maximum age, age range, and mean age with their standard deviations, without sex identification.
For each epiphyseal center, some CT scans were not
ana-lyzable. These data are detailed in Table4. However, these
Fig. 2 (continued)
APEX
CORACOID CORACOID INFERIOR
ANGLE
\
•
t STAGE 1 1 STAGE2~
'
~·
\
_ .a:, ~-...l
·
k
.-:
1
-,,.
-,-•
-
.,
._
'
~
L
STAGE3,
("-_
1
1
;:·
·\~
..
STAGE4_J
1 STAGES-1
'.'...,.-.
~-A~
~
1
,,,
~
·..
.
"
·,
, •.
/
.
'
✓
-cases were not important. For example, for acromial center, only six female CT scans and three male CT scans were not analyzable (nine cases on 232 total in-clusions). For inferior angle ossification center, none of the cases was excluded.
The main reason of this lack of analysis was the fact that acromion was near the limits of acquisition field and was not analyzable correctly, especially with MPR.
Acromial ossification center (Table4, Fig.3a)
The youngest individual in which stage 2 (beginning of ossification) was observed was 9.8 years for female group and 7.4 years for male group. The oldest individ-ual in which stage 2 was observed was 13.6 years for female group and 14.6 years for male group. For both
sexes, patients identified as stage 2 were younger than 18 years old. The oldest individual in which stage 3 was observed was 18.9 years for female group and 18 years for male group.
Sub coracoid ossification center (Table4, Fig.3b)
The youngest individual in which stage 2 was observed was 9.2 years for female group and 8.5 years for male group. The oldest individual in which stage 3 was ob-served was 14.5 years for female group and 15.8 years for male group.
For both sexes, patients identified as stage 3 were younger than 18 years old. The oldest individual in which stage 4 was observed was 30.5 years for female group and 29.3 years for male group.
Table 3 Results for intra observer variability, inter observer variability, and side’s differences
Ossification center
Intra observer (n = 25)
Cohen’s kappa Inter observer (n = 20)Cohen’s kappa Side differences (n = 31)Cohen’s kappa
Acromial 1 0.72 0.93 Sub coracoid 0.85 0.74 0.96 Glenoid 0.95 0.84 0.98 Coracoid 1 1 0.94 Apex 1 0.91 0.88 Inferior angle 1 0.98 0.88
Table 4 Age distribution for each stage
Minima maxima [mean (years) ± standard deviation]
F female, M male, NA not applicable, n number of cases for each ossification center
~
Sex NA 1 2 3 4 5 0 F 6 8.5 -10.4 9.4 ± 0.9] 9.8 -13.6 () 1.5 ± .6] 9.2-18.9 [ 3.4 ± 2.5 15-16. [ 5.6±0. 14.6-30.6 [23 ± 4.6 Acromial (4) (5) (23) {2) (69) (n) M 3 7.9 -9.4 [(7) 8.6=
0.5] 7.4 -14.6 (6) [11.5 ± 3 9.2-17.9[ (35) 2.7±2.4 16.3-29.6 ((3) 20.9 ± 7.5] 15.2-30.6 (69) (23.7 ± 4.1] F 3 8.5 -9.9 [9.3=
0.7] 9.2 -]0_5 [9.9 ± 0.5) 9.2 -14.5 [12.2=
1.7) 11.4 -30.5 [21.2=
6.1) 11.6 -30.6 [21.8=
5) ub-corncoid (4) (5) (14) (18) (65) (n) M 0 . .4. JO(14) . 9±0.9) 8.5 -10.(4) 8 [9.8 ± l] 9.5 -15.8 (2[7) 12.6=
1. ) 15.7 · 29.3 (16) (20.9=
4.8] 5 -30.6 (62) [23.5=
4.3] F 3 8.5 -12.7 [10.2 ± 1.1] 9.2 - 9.2 [9.2=
OJ 11.2 -16.6 [13.9 ± 1.5) 13.9 - 19.2 (15.6=
2.3] 11.4 -30.6 [23=
4. 7) Glenoid (14) ()) ( 6) (5) (70) (n) M 0 .5 -12.(26) 9 [10 ± .3] 1.5 . 12(.5 2) 2 : 0.7] 7.9 -15.8 (2[0) 13.6 ± 2] 15.1 -25.2 (1[12) 9.3=
3.1 16.3 -30(.63) 6 24 =4. F 2X
S.5 -10.7 [9.9 ± 0.8) 8.8-14.1 [11.3=
1.8) 13.6 - 14.5 (14=
0.5] 11.4 -30.6 [21.8 ± 5.2] Corncoid (7) (-4) (4) (82) (n) M 1 7.4 - 11.5 [9.6 ± 1.1) 10.8 -15.2 [12.8 ± 1.3) 14.1 -15.7 [14.9=
1.2] 14.6 -30.6 [22.8 ± 4.6] {23) (17) {2) (80) F 1 8.5 -13.6 [ 0.4=
1.5] 9.2 -12.7 [I .7 ± 1.8) 1.2. 16.6 [ 3.8=
1. J 13.9 - 13.9 [13.9 ± OJ 13 -3 .6 [22. ± 4.7] Apex of corncoid (13) (3) ( 8) (1) (73) (n) M 1 7.4 - 15.2 [ o.=
1. l 9.6 -13.6 [10.9 ± 1.9] 0.4 · 15.8 [ 3.=
1. 1 16.6-19.7 [18.2 ± 2.2] 15.1 -30.6 (23.4 ± 4.3) (25) (4) (18) {2) (73) F 0 8.5 - 18.4 [11.8 ± 2.4] 11.6 -17.6 (15.1 ± 1.8) 13.2 -18.8 [16.5 ± 1.6] 18.9- 22.3 (19.9=
1.1] 18.4-30.6 [25 ± 3.7] Inftrior angle (28) (12) (.0) (9) (49) (n) M 0 . 4- 5.4 (41[ 11 ) ± 2.2] 13.5 - 16.9 (15(8) .7 ± 1.1) 13.5 -20. (9) [16.4 ± 2.3] 7 . - 19.1 ((18.2 4) ± 0.7] 18.2 -30.6 (61) [24.6 ± 3.6)Glenoid ossification center (Table4, Fig.3c)
The youngest individual in which stage 2 was observed was 9.2 years for female group and 11.5 years for male group. The oldest individual in which stage 3 was observed was 16.6 years for female group and 15.8 years for male group.
For both sexes, patients identified as stage 3 were younger than 18 years old. The oldest individual in which stage 4 was observed was 19.2 years for female group and 25.2 years for male group.
Coracoid ossification center (Table4, Fig.3d)
The youngest individual in which stage 2 was observed was 8.5 years for female group and 7.4 years for male group. The oldest individual in which stage 4 was observed was 14.5 years for female group and 15.7 years for male group.
For both sexes, patients identified as stage 4 were younger than 18 years old. The oldest individual in which stage 5 was observed was 30.6 years for both groups.
Coracoid apex ossification center (Table4, Fig.3e)
The youngest individual in which stage 2 was observed was 9.2 years for female group and 9.6 years for male group. The oldest individual in which stage 3 was observed was 16.6 years for female group and 15.8 years for male group.
For the male group, patients identified as stage 3 were younger than 18 years old (the oldest individual in which stage 3 was observed was 15.8 years). However, for female group, the oldest individual in which stage 3 was observed was 16.6 years. And the oldest individual in which stage 4 was observed was 13.9 years, but this result has to be carefully considered because of the small effective in this group (n = 1). Inferior angle ossification center (Table4, Fig.3f)
The youngest individual in which stage 2 was observed was 11.6 years for female group and 13.5 years for male group. The oldest individual in which stage 2 was observed was 17.6 years for female group and 16.9 years for male group.
For both sexes, patients identified as stage 2 were younger than 18 years old. The oldest individual in which stage 3 was observed was 18.8 years for female group and 20.1 years for male group.
Discussion
Determination of age in a living person is a subject of ongoing research in forensic anthropology. This problem arose with increasing migratory flow and the reception of unaccompa-nied young people claiming to be minors on arrival in
European countries. The actual age or chronological age is the time between the birth of a person and a specific date. It is the determination of this age that is sought in medico-legal reports required by the legal authorities. Age printed on doc-uments that could have been changed or stolen could be dif-ferent from chronological age. In consequence, forensic phy-sicians are frequently asked by the authorities to estimate the age of a living person requesting asylum and claiming to be younger than 18 years old. Indeed, above this age, they are liable to be returned to their country of origin. Forensic age estimation is also used to determine whether a suspected of-fender is subject to juvenile or adult criminal law. The relevant age thresholds for judicial and administrative proceedings lie
between 14 and 21 years old in most countries [36].
Estimation of the correct age of the charged person is impor-tant during criminal proceedings. Verified documentation of the date of birth is the only way to determine the exact chro-nological age of a person. However, if the person does not possess his or her own identification documents, it is very important to verify whether this person should be accepted as juvenile or adult. Biological age is the aging of a person, taking into account all biological and physiological parame-ters. There is no single and objective criterion allowing an overall assessment of the degree of biological aging of an individual. Evaluation is a multifactorial process, based on the quantitative assessment of several parameters, which de-termine the maturity of an individual using morphological and morphometric methods. Among these methods, bone age, dental age, and puberty are subsets of biological age determi-nation. Bone age is the stage of skeletal maturation. Its deter-mination is based on the analysis of growth plate activity, visible on epiphyses.
Recent progress in medical imaging has opened new direc-tions of research in forensic anthropology, especially in the context of bone age study. Several studies for estimation of bone age with CT analysis have been performed. Studies using CT staging were performed on the medial clavicle ex-tremity [4,7,40,41], first rib [42], pars basilaris of the occip-ital bone, and spheno-occipoccip-ital synchondrosis [43,44]. Use of CT examinations is more appropriate for studying bones than ultrasound (US) or MRI. Indeed, the US method is accurate and X-ray free, but it remains operator dependent. Also, it only allows a relatively superficial evaluation of bones due to limited penetration depth of ultrasonic waves [13,45,46]. MRI is a powerful tool, especially for identifying and studying growth plates. However, this technique has a lower spatial resolution than CT regarding fusion of ossification centers. Nevertheless, this limitation can be overcome by higher
Fig. 3 Box and whisker plots showing all CT stages in relation to age for the six ossification centers. Box represents inter quartile range, thick black horizontal line represents median, t bars represent extremes, and asterisks and circles represent outliers
a
" N C 0 Ne
ACROMIAL(n=232) GLENOID (n=232)B
CORACOID APEX (n=232)b
0 Nd
f
" NB
SUB CORACOID (n=232)=
CORACOID (n=232)B
a
•
INFERJORANGLE (n=232)magnetic field strengths [16]. Moreover, access to MRI is currently difficult, mainly due to limited time availability of the machines. Finally, costs of MRI studies are higher than those with other techniques (CT and US). However, the de-velopment of new methods for age assessment with cross-sectional imaging increased in the last years. These methods are also useful for sporting competitions [13,15,47,48].
Comparison of our results to literature data, like Scheuer and Black [20], demonstrated that there are noticeable differ-ences. In fact, age ranges for the various epiphyses of the scapula show later ages, particularly with the glenoid epiphy-sis. This difference could be explained at least partially by the fact that material was different. Indeed, Scheuer and Black used dry bones, while actual studies use clinical situations of living subjects.
– For the acromion epiphysis, an earlier emergence and complete fusion are observed compared to Scheuer and Black and estimated respectively to 2 and 3 years. – For the coracoid apex epiphysis, we observed an earlier
appearance by 3 years and an earlier fusion by 4 years. – For the coracoid epiphysis, complete fusion was observed
approximately in accordance with literature data. – For the glenoid epiphysis, we observed an earlier
appear-ance by 4 years and complete fusion was observed ap-proximately in accordance with literature data.
– For the inferior angle, emergence was identical, while fusion was earlier by 4 years.
– For the sub-coracoid epiphysis, time of onset was identi-cal and fusion was later by around 5 years.
Statistical comparison between these results could not be made. This is due mainly to the fact that the examination techniques were different. Only comparison between studies
using the same imaging methods is possible [49]. The
com-plete fusion of the epiphyses appears earlier in radiographic studies than in those carried out on dry bone [50].
Concerning sex difference in the developmental timing of
scapula, the study of Coqueugniot and Weaver [51] realized
on dry bone demonstrated for the acromion epiphysis a delay of 1 or 2 years for two states of fusion: partial union and complete union. The results of Coqueugniot and Weaver for the coracoid epiphysis are not comparable because they con-sider sub-coracoid and coracoid secondary centers together with the coracoid epiphysis.
In our study, side differences were studied for 31 patients. In most studies in which the side difference has been evaluat-ed, there was no significant statistical difference [36, 49, 52–55]. Our results accorded with literature data.
Meijerman and Mühler recommended a slice thickness of 1 mm, to avoid creation of incorrect images [55,56]. In our study, 58.6 % of CT scans (136/232) were made with these criteria. The other 41.4 % CT examinations of our study were
done using a slice thickness of 2 mm, which is acceptable because of the overlapping interval (1 mm). For this reason, these CT examinations were included in our study.
Besides, CT examinations in clinical practice are done using slice thicknesses of 2 mm with overlapping interval of 1 mm, which allows a good structural visualization, associated to an acceptable X-ray exposure. All CT examinations used in our study are derived from clinical CT examinations.
The observer’s experiences are known to have a bias effect
on data [9]. The radiological assessment for this study was
performed by a radiologist with a little experience in anthro-pological studies. However, intra-observer variability was ex-cellent (0.85 to 1) and inter-observer variability was also good (0.72 to 1). This point highlights the absence of evident tech-nical issues in scapula ossification center assessment.
Another limitation concerns the mean ages for stages 1 and 5: youngest appearance for stage 1 and oldest appearance for stage 5. These points could not be taken into account due to the fact that lower and upper limits were chosen. Indeed, we exclude individuals younger than 7.4 or older than 30.6 years old, because we estimate that they would all be classified stage 1 and stage 5, respectively. This point explains also the fact that there is no stage 1 for coracoid center, which normally appears within the first year of life.
CT scapula can probably not be considered like an option for prospective age estimation. The first reason is exposure to radiation. Nowadays, even if it seems unrealistic to practice an additional scapula CT examination to study age, new tech-niques such as low-dose CT scans are more and more devel-oped and will allow, in a next future, a very low radiation exposure [57,58]. The second reason is its inferiority com-pared to classical hand/wrist X-ray usually employed in those age segments between 10 and 18 years. Indeed, X-ray hand/ wrist region has a lower exposure to radiation and is cheaper and much easier to apply and to evaluate. Also, there is no need of posttreatment reconstructions using classical X-rays. A recent study showed that Greulich and Pyle’s method was globally valid on a sample of contemporary French young people. However, up to 48 months, difference between the estimated bone age and the real age could be seen for some individuals [59]. If a thoracic CT scan was performed (for a clinical reason) on this population, the use of scapula’s method will allow a greater precision in age estimation. And even if CT of scapula is not an option, CT of the medial clavicle will often also include the superior part of the scapula (such as the acromion process and coracoid process). By this way, we could combine these two methods using the same CT scan acquisition.
Results of our study did not show that any ossification center appears after 18 years old. However, the use of some ossification stages allows more precise age estimation. For example, all people with a coracoid ossification center less than stage 4 were aged less than 18 years old and for acromial
ossification center less than stage 2 were aged less than 18 years old.
The main limitation of our study was the lack of informa-tion about ethnic origin and socioeconomic level of the indi-viduals. Reference methods in the field of age determination are established on samples of young healthy individuals of known age, growing up in a non-deficient environment, with a high socioeconomic level [6,60,61]. Schmeling et al. [1,3] demonstrated that socioeconomic level plays a much greater role on bone maturation speed compared to ethnicity. A poor
socioeconomic level slows bone maturation [55]. If methods
obtained from children with a good socioeconomic level are applied to individuals from disadvantaged backgrounds, there is a risk of underestimating their actual age. This underestima-tion, if it is a source of error in the assessment of age, is not an ethical problem itself as the error occurs for the benefit of the individual.
Conclusion
This first work carried out on CT reconstructions confirmed that the scapula presents anatomical interest in estimating bone age. The five stages defined by Schmeling et al. to de-scribe ossification of the medial epiphysis of the clavicle on the basis of conventional radiographs can also be observed on
scapula CT examinations [36]. Whatever is the epiphyseal
center and whatever is the sex, all stage 2 is under the 18-year-old threshold. Even if none of the ossification stages investigated in this study first appears after age of 18, study of these epiphyseal centers, particularly using a retrospective method, could be very useful. This assessment still needs to be used in complement of the preexisting age assessment methods. Obviously, further studies with larger groups are needed to support our results.
References
1. Schmeling A, Olze A, Reisinger W et al (2003) Statistical analysis and verification of forensic age estimation of living persons in the Institute of Legal Medicine of the Berlin University Hospital Charité. Leg Med Tokyo Jpn 5(Suppl 1):S367 371
2. Schmeling A, Grundmann C, Fuhrmann A et al (2008) Criteria for age estimation in living individuals. Int J Legal Med 122:457 460. doi:10.1007/s00414 008 0254 2
3. Schmeling A, Reisinger W, Loreck D et al (2000) Effects of ethnic ity on skeletal maturation: consequences for forensic age estima tions. Int J Legal Med 113:253 258
4. Schulze D, Rother U, Fuhrmann A et al (2006) Correlation of age and ossification of the medial clavicular epiphysis using computed
tomography. Forensic Sci Int 158:184 189. doi:10.1016/j.
forsciint.2005.05.033
5. Wittschieber D, Ottow C, Vieth V et al (2015) Projection radiogra phy of the clavicle: still recommendable for forensic age diagnostics in living individuals? Int J Legal Med 129:187 193. doi:10.1007 /s00414 014 1067 0
6. Schmeling A, Olze A, Reisinger W, Geserick G (2001) Age esti
mation of living people undergoing criminal proceedings. Lancet
358:89 90. doi:10.1016/S0140 6736(01)05379 X
7. Ekizoglu O, Hocaoglu E, Inci E et al (2015) Forensic age estimation by the Schmeling method: computed tomography analysis of the medial clavicular epiphysis. Int J Legal Med 129:203 210. doi:10.1007/s00414 014 1121 y
8. Ekizoglu O, Hocaoglu E, Inci E et al (2015) Estimation of forensic age using substages of ossification of the medial clavicle in living individuals. Int J Legal Med 129:1259 1264. doi:10.1007/s00414 015 1234 y
9. Wittschieber D, Schulz R, Vieth V et al (2014) Influence of the examiner’s qualification and sources of error during stage determi nation of the medial clavicular epiphysis by means of computed
tomography. Int J Legal Med 128:183 191. doi:10.1007/s00414
013 0932 6
10. Cameriere R, Giuliodori A, Zampi M et al (2015) Age estimation in children and young adolescents for forensic purposes using fourth cervical vertebra (C4). Int J Legal Med 129:347 355. doi:10.1007 /s00414 014 1112 z
11. Saint Martin P, Rérolle C, Dedouit F et al (2014) Evaluation of an automatic method for forensic age estimation by magnetic reso nance imaging of the distal tibial epiphysis a preliminary study focusing on the 18 year threshold. Int J Legal Med 128:675 683. doi:10.1007/s00414 014 0987 z
12. Saint Martin P, Rérolle C, Dedouit F et al (2013) Age estimation by magnetic resonance imaging of the distal tibial epiphysis and the calcaneum. Int J Legal Med 127:1023 1030. doi:10.1007/s00414 013 0844 5
13. Wittschieber D, Vieth V, Timme M et al (2014) Magnetic resonance imaging of the iliac crest: age estimation in under 20 soccer players.
Forensic Sci Med Pathol 10:198 202. doi:10.1007/s12024 014
9548 5
14. Krämer JA, Schmidt S, Jürgens K U et al (2014) The use of mag
netic resonance imaging to examine ossification of the proximal tibial epiphysis for forensic age estimation in living individuals.
Forensic Sci Med Pathol 10:306 313. doi:10.1007/s12024 014
9559 2
15. Dvorak J, George J, Junge A, Hodler J (2007) Application of MRI of the wrist for age determination in international U 17 soccer com
petitions. Br J Sports Med 41:497 500. d oi:1 0.1136
/bjsm.2006.033431
16. Krämer JA, Schmidt S, Jürgens K U et al (2014) Forensic age
estimation in living individuals using 3.0 T MRI of the distal femur. Int J Legal Med 128:509 514. doi:10.1007/s00414 014 0967 3
17. Dedouit F, Auriol J, Rousseau H, et al (2012) Age assessment by magnetic resonance imaging of the knee: a preliminary study. Forensic Sci Int 217:232.e1 7. doi: 10.1016/j.forsciint.2011.11.013 18. Saint Martin P, Rérolle C, Pucheux J et al (2015) Contribution of distal femur MRI to the determination of the 18 year limit in foren
sic age estimation. Int J Legal Med 129:619 620. doi:10.1007
/s00414 014 1020 2
19. Guo Y, Olze A, Ottow C et al (2015) Dental age estimation in living individuals using 3.0 T MRI of lower third molars. Int J Legal Med
129:1265 1270. doi:10.1007/s00414 015 1238 7
20. Scheuer L, Black S (2004) The juvenile skeleton. Academic Press, San Diego, p 250 265
21. Cardoso HFV (2008) Age estimation of adolescent and young adult male and female skeletons II, epiphyseal union at the upper limb and scapular girdle in a modern Portuguese skeletal sample. Am J Phys Anthropol 137:97 105. doi:10.1002/ajpa 20850
22. Ogden JA, Phillips SB (1983) Radiology of postnatal skeletal development. VII. The scapula. Skeletal Radiol 9:157 169
23. Andersen H (1963) Histochemistry and development of the human
shoulder and acromio clavicular joints with particular reference to the early development of the clavicule. Acta Anatomica 55:124 165 24. Basmajian JV, Slonecker CE, Grant JCB (1989) Grant’s method of
anatomy: a clinical problem solving approach, 11th ed. Williams and Wilkins, Baltimore
25. Frazer J (1920) The anatomy of the human skeleton. Anat Hum
Skelet 131:155 160
26. Hodges PC (1933) An epiphyseal chart. Am J Roentgenol
30(6):809
27. Johnston FE (1961) Sequence of epiphyseal union in a prehistoric Kentucky population from Indian Knoll. Hum Biol 33:66 81 28. Birkner R (1978) Normal radiologic patterns and variances of the
human skeleton: an X ray atlas of adults and children. Urban and Schwarzenberg, Baltimore Munich
29. Flecker H (1932) Roentgenographic observations of the times of
appearance of epiphyses and their fusion with the diaphyses. J Anat 67:118 164.3
30. Macalister A (1893) Notes on acromion. J Anat Physiol 27:
244.1 251
31. Stevenson PH (1924) Age order of epiphyseal union in man. Am J
Phys Anthropol 7:53 93. doi:10.1002/ajpa.1330070115
32. Camp JD, Cilley E (1931) Diagrammatic chart showing time of
appearance of the various centers of ossification and period of union. Am J Roentgenol 26:905
33. Mckern TW, Stewart TD (1957) Skeletal age changes in young
American males analysed from the standpoint or age identification. Environmental Protection Research Division. Quatermaster Research Development Center, US. Army, Technical Report EP 45, Natick
34. Last RJ (1955) Anatomy: regional and applied. Am J Med
Sci 229:707
35. Girdany B, Golden R (1952) Centers of ossification of the skeleton. Am J Roentgenol Radium Ther Nucl Med 68:922 924
36. Schmeling A, Schulz R, Reisinger W et al (2004) Studies on the
time frame for ossification of the medial clavicular epiphyseal car tilage in conventional radiography. Int J Legal Med 118:5 8. doi:10.1007/s00414 003 0404 5
37. Development Core Team R (2015) R: a language and environment
for statistical computing., GBIF.ORG
38. Cohen J (1960) A coefficient of agreement for normal scales. Educ Psychol Meas 20:37 46
39. Ferrante L, Cameriere R (2009) Statistical methods to assess the reliability of measurements in the procedures for forensic age esti mation. Int J Leg Med 123:277 283
40. Franklin D, Flavel A (2015) CT evaluation of timing for ossification of the medial clavicular epiphysis in a contemporary Western Australian population. Int J Legal Med 129:583 594. doi:10.1007 /s00414 014 1116 8
41. Kellinghaus M, Schulz R, Vieth V et al (2010) Enhanced possibil ities to make statements on the ossification status of the medial clavicular epiphysis using an amplified staging scheme in evaluat ing thin slice CT scans. Int J Legal Med 124:321 325. doi:10.1007 /s00414 010 0448 2
42. Moskovitch G, Dedouit F, Braga J et al (2010) Multislice computed tomography of the first rib: a useful technique for bone age assess
ment. J Forensic Sci 55:865 870. doi:10.1111/j.1556
4029.2010.01390.x
43. Minier M, Dedouit F, Mokrane F T et al (2012) Estimation de l’âge fœtal par étude scanographique de la pars basilaris de l’os occipital. R e v M é d e c i n e L é g a l e 3 : 1 5 1 1 5 6 . d o i :1 0 . 1 0 1 6 / j . medleg.2012.07.001
44. Bassed RB, Briggs C, Drummer OH (2011) Age estimation using
CT imaging of the third molar tooth, the medial clavicular
epiphysis, and the spheno occipital synchondrosis: a multifactorial
approach. Forensic Sci Int 212:273.e1 5. doi: 10.1016/j.
forsciint.2011.06.007
45. Schmidt S, Schmeling A, Zwiesigk P et al (2011) Sonographic
evaluation of apophyseal ossification of the iliac crest in forensic age diagnostics in living individuals. Int J Legal Med 125:271 276. doi:10.1007/s00414 011 0554 9
46. Schmidt S, Schiborr M, Pfeiffer H et al (2013) Sonographic exam ination of the apophysis of the iliac crest for forensic age estimation in living persons. Sci Justice J Forensic Sci Soc 53:395 401. doi:10.1016/j.scijus.2013.05.004
47. Vieth V, Schulz R, Brinkmeier P et al (2014) Age estimation in U 20 football players using 3.0 tesla MRI of the clavicle. Forensic Sci Int 241:118 122. doi:10.1016/j.forsciint.2014.05.008
48. Schmidt S, Vieth V, Timme M et al (2015) Examination of ossifi
cation of the distal radial epiphysis using magnetic resonance im aging. New insights for age estimation in young footballers in FIFA tournaments. Sci Justice J Forensic Sci Soc 55:139 144. doi:10.1016/j.scijus.2014.12.003
49. Schulz R, Mühler M, Reisinger W et al (2008) Radiographic staging of ossification of the medial clavicular epiphysis. Int J Legal Med 122:55 58. doi:10.1007/s00414 007 0210 6
50. Krogman WM, Iscan MY (1986) The human skeleton in forensic
medicine. Charles C. Thomas, Springfield
51. Coqueugniot H, Weaver TD (2007) Brief communication:
infracranial maturation in the skeletal collection from Coimbra, Portugal: new aging standards for epiphyseal union. Am J Phys Anthropol 134:424 437. doi:10.1002/ajpa.20683
52. Schulz R, Mühler M, Mutze S et al (2005) Studies on the time frame for ossification of the medial epiphysis of the clavicle as revealed by CT scans. Int J Legal Med 119:142 145. doi:10.1007/s00414 005 0529 9
53. Cameriere R, Cingolani M, Giuliodori A et al (2012) Radiographic analysis of epiphyseal fusion at knee joint to assess likelihood of having attained 18 years of age. Int J Legal Med 126:889 899. doi:10.1007/s00414 012 0754 y
54. Kreitner KF, Schweden FJ, Riepert T et al (1998) Bone age deter mination based on the study of the medial extremity of the clavicle.
Eur Radiol 8:1116 1122. doi:10.1007/s003300050518
55. Meijerman L, Maat GJR, Schulz R, Schmeling A (2007) Variables
affecting the probability of complete fusion of the medial clavicular epiphysis. Int J Legal Med 121:463 468. doi:10.1007/s00414 007 0189 z
56. Mühler M, Schulz R, Schmidt S et al (2006) The influence of
slice thickness on assessment of clavicle ossification in foren
sic age diagnostics. Int J Legal Med 120:15 17. doi:10.1007
/s00414 005 0010 9
57. Meyer M, Haubenreisser H, Raupach R et al (2014) Initial results of a new generation dual source CT system using only an in plane comb filter for ultra high resolution temporal bone imaging. Eur Radiol 25:178 185. doi:10.1007/s00330 014 3406 4
58. Newell JD, Fuld MK, Allmendinger T et al (2015) Very low dose
(0.15 mGy) chest CT protocols using the COPDGene 2 test object and a third generation dual source CT scanner with corresponding third generation iterative reconstruction software. Invest Radiol 50:
40 45. doi:10.1097/RLI.0000000000000093
59. Zabet D, Rérolle C, Pucheux J et al (2015) Can the Greulich and Pyle method be used on French contemporary individuals? Int J
Legal Med 129:171 177. doi:10.1007/s00414 014 1028 7
60. Pyle SI, Hoerr NL (1955) Radiographic atlas of skeletal
development of the knee. Charles C. Thomas Company, Springfield
61. Greulich WW, Pyle SI (1959) Radiologic atlas of skeletal develop ment of the hand and wrist. Stanford University Press Palo Alto, California