an author's https://oatao.univ-toulouse.fr/22890
https://doi.org/10.1016/j.compstruct.2019.02.070
Paroissien, Eric and Lachaud, Frédéric and Silva, Lucas Filipe Martins da and Seddiki, Salah Hammidi A comparison between macro-element and finite element solutions for the stress analysis of functionally graded single-lap joints. (2019) Composite Structures, 215. 331-350. ISSN 0263-8223
1 A comparison between macro-element and finite element solutions for the stress analysis of functionally graded single-lap joints
Eric Paroissien1,*, Frédéric Lachaud1, Lucas F.M. da Silva2, Salah Seddiki1
1
Institut Clément Ader (ICA), Université de Toulouse, ISAE-SUPAERO, INSA, IMT MINES ALBI, UTIII, CNRS, 3 Rue Caroline Aigle, 31400 Toulouse, France
2
Department of Mechanical Engineering, Faculty of Engineering, University of Porto, Portugal
*To whom correspondence should be addressed: Tel. +33561338438, E-mail: [email protected]
Abstract – The interest in functionally graded adhesive (FGA) joints has been increasing in recent years. For example, FGAs offer the opportunity to optimize the strength of multi-material bonded joints by locally tailoring the adhesive properties and without modifying the design of the adherends to be joined. The development of dedicated stress analyses to predict the stress distribution is then of the highest interest to control the strength of such joints. The Finite Element (FE) method is able to address the stress analysis of FGA joints but is computationally costly. Simplified stress analyses have then been developed. The objective of this paper is to assess the prediction of simplified stress analyses, solved through the macro-element (ME) technique, with respect to those of FE models. It is shown that the predictions of ME models are in a sufficient agreement with the FE models to be employed at a pre-sizing stage. The influence of the overlap length is then investigated by the means of the simplified
2 stress analyses. A noticeable result is the existence of an overlap length for which the adhesive peak shear stress is minimal, in the 1D-bar kinematics framework.
Key words: functionally graded adhesive; single-lap bonded joint; stress analysis; finite
3 NOMENCLATURE AND UNITS
Aj extensional stiffness (N) of adherend j
Bj extensional and bending coupling stiffness (N.mm) of adherend j
Dj bending stiffness (N.mm2) of adherend j
Ea adhesive peel modulus (MPa)
Ea,min adhesive shear modulus (MPa)
Ea,max adhesive shear modulus (MPa)
Ej adherend Young’s modulus (MPa) of adherend j
Fe element nodal force vector
Fe,therm elementary nodal force vector equivalent to thermal load
Ga adhesive shear modulus (MPa)
Ga,max maximal adhesive shear modulus (MPa)
Ga,min minimal adhesive shear modulus (MPa)
KBBa elementary stiffness matrix of a bonded-bars element
KBBe elementary stiffness matrix of a bonded-beams element
Kbar,j elementary stiffness matrix of a bar for the adherend j
L length (mm) of bonded overlap
Mj bending moment (N.mm) in adherend j around the z direction
𝑀𝑗Δ𝑇 thermal bending moment (N.mm) in adherend j around the z direction Nj normal force (N) in adherend j in the x direction
𝑁𝑗Δ𝑇 thermal normal force (N) in adherend j in the x direction S adhesive peel stress (MPa)
Smax maximal adhesive peel stress (MPa)
T adhesive shear stress (MPa)
4 Ue element nodal displacement vector
Vj shear force (N) in adherend j in the y direction
b width (mm) of the adherends
ea thickness (mm) of the adhesive layer
eaME thickness (mm) of the adhesive layer used in the ME formulation
eaFE thickness (mm) of the adhesive layer used in the FE model
f magnitude of applied tensile force (N)
fME magnitude of applied tensile force (N) used in the ME formulation
hj half thickness (mm) of adherend j
kI adhesive elastic stiffness (MPa/mm) in peel
kII adhesive elastic stiffness (MPa/mm) in shear
ku spring element stiffness (N/mm) along the x-axis
kv spring element stiffness (N/mm) along the y-axis
n number of elements in the adhesive thickness
n_BE number of bar or beam elements
n_ME number of macro-elements
r element longitudinal slenderness s length of the smallest element
uj displacement (mm) of adherend j in the x direction
vj displacement (mm) of adherend j in the y direction overlap length (mm) of a macro-element
T variation of temperature (K)
u slipping displacement (mm)
v opening displacement (mm)
5
j coefficient of thermal expansion (K-1) of adherend j
characteristic argument (mm-1) in 1D-bar analysis
j bending angle (rad) of the adherend j around the z direction 𝜒𝐴 adherend stiffness unbalance parameter (-)
(x,y,z) global reference system of axes
BBa bonded-bars
BBe bonded-beams
FE Finite Element
FGA functionally graded adhesive
HA homogeneous adhesive
JE joint element
ME macro-element
ODE ordinary differential equation TEPS Taylor expansion in power series
6
1. Introduction
The adhesive bonding technology is attractive since it offers high mechanical performance in terms of stiffness, static strength and fatigue strength [1-3]. In addition, this joining technology is particularly suitable to the joining of adherends made of dissimilar materials. The presence of the adhesive layer all along the overlap allows a continuous load transfer between the adherends, contrarily to mechanical fastenings where the load transfer takes place at the fastener location. However, adhesive stress gradients are present at both overlap ends due to the deformability of the adhesive and adherends, so that the load transfer is mainly restricted to small lengths at both overlap ends. Design solutions exist to homogenize the adhesive stress distribution along the overlap. For example, the specimen design for the thick adherend shear test [4] leads to a homogenization of adhesive shear stress distribution, due to the increase of the ratio between the adherend membrane stiffness relatively to the adhesive shear stiffness. In the case of joining adherends made of dissimilar materials, the adhesive stress peak is more pronounced at one overlap end than at the other one. In such a case, an idea to reduce the adhesive peak stresses is to vary the adhesive properties all along the overlap, referring to the functionally graded adhesive (FGA) joints [5-8].
The interest in FGAs has increased in recent years [9-10]. FGA joints involve a continuous variation of the adhesive properties along the overlap allowing for the homogenization of the stress distribution and load transfer. FGAs offer the opportunity to optimize the strength of multi-material bonded joints, by locally tailoring the adhesive properties and without modifying the design of adherends to be joined.
The development of dedicated stress analyses to predict the stress distribution is then of the highest interest to tailor the strength of such joints. The Finite Element (FE) method is able to address the stress analysis of FGA joints [9,11]. However, FE analyses are computationally costly, so that simplified stress analyses would be useful to allow for extensive parametrical
7 studies, optimization processes and fast decision-making at the pre-sizing stage. In 2014, Carbas et al. published a first analytical approach for 1D-bar stress analysis of FGA joints [6], based on the shear-lag model by Volkersen [12] for homogeneous adhesive (HA) joints. In the case of HA joints, the simplifying hypotheses involved lead to linear ordinary differential equations (ODEs). In the case of FGA joints, the ODEs are not linear anymore since the adhesive properties depend on the location along the overlap. Carbas et al. then presented a resolution scheme based on Taylor expansion in power series (TEPS). This stress analysis is restricted to half of the overlap length of balanced joints with a linear graduation of the adhesive shear modulus. Stein et al. presented a 1D-bar analysis as well as a sandwich-type 1D-beam analysis using TEPS resolution able to address unbalanced bonded joints under any adhesive properties graduations [13-14]. In 2017, Stapleton et al. used a joint element (JE) for the stress analysis of FGA joints under various geometrical configurations, including non-linear material behavior [15]. A JE is a 4-nodes brick element allowing for the modelling of two bonded adherends [15-17]. Over a similar period of time, the first and third authors of the present papers and co-workers have been working on the development of the macro-element (ME) technique for the simplified stress analysis of bonded, bolted and hybrid (bonded/bolted) joints made of dissimilar and possibly laminated beams [18-24]. The JE and ME are based on the same modelling approach. In 2018, Paroissien et al. published a 1D-bar and 1D-beam analysis of FGA joints subjected to combined thermal and mechanical loads, the resolution schemes of which make use of TEPS and of the ME technique [8].
The objective of this paper is to present a comparison between the predictions of adhesive stress distributions from the ME technique and the FE method in single-lap FGA joints. Firstly, simplified stress analyses based on ME technique in 1D-bar and 1D-beam framework are explained. The detailed mathematical description can be found in [8]. In a second part, the 1D and 3D FE models are presented and validated through dedicated convergence studies.
8 The 1D FE models are developed following the 1D-bar kinematics and the 1D-beam kinematics, and termed 1D-bar FE models and 1D-beam FE models. Bar or beam elements are then used to model the adherend, while spring elements model the adhesive layer. 3D models are also studied where 3D-brick elements are used to model the adherends. The adhesive layer is modelled either with brick elements in the 3D FE volume model (VM) or with interface elements in the 3D FE cohesive zone model (CZM). The adhesive stress distribution along the overlap predicted by the 1D ME, 1D FE and 3D FE models are then compared. As an application of the ME models, the influence of the overlap length on the adhesive peak stresses of FGA joints is presented and compared to those of homogeneous adhesive (HA) joints. In this paper, a simply-supported single-lap joint subjected to in-plane tensile loading with a force f=5 kN and a uniform variation of temperature T=+50°C is considered (Figure 1), involving a balanced joint and an unbalanced joint cases. The balanced case corresponds to the joining of two adherends made in steel. The unbalanced case differs from the balanced one by the material of the lower adherend only: aluminium instead of steel. A parabolic graduation of adhesive properties is considered such as:
𝐸𝑎(𝑥) = 𝐸𝑎,𝑚𝑎𝑥 − (𝐸𝑎,𝑚𝑎𝑥− 𝐸𝑎,𝑚𝑖𝑛) (𝑥𝐿 2 − 1) 2 (1) 𝐺𝑎(𝑥) = 𝐺𝑎,𝑚𝑎𝑥 − (𝐺𝑎,𝑚𝑎𝑥− 𝐺𝑎,𝑚𝑖𝑛) (𝑥𝐿 2 − 1) 2 (2)
where L is the length of the overlap, Ea,max (Ea,min) is the maximal (minimal) adhesive peel
modulus in the graduation and Ga,max (Ga,min) is the maximal (minimal) adhesive shear
modulus in the graduation. The ratio between the maximal (minimal) adhesive peel modulus and the maximal (minimal) adhesive shear modulus through is chosen, for simplicity purpose, as constant for this paper and equal to 2(1+a), where a is the adhesive Poisson’s ratio. It is
indicated that this choice is not a restriction imposed by the modelling, since the models are fully parametrical. In this work, the adhesive peel modulus is then represented by the adhesive
9 Young’s modulus. These geometrical and material configurations are the same as those used in [8] inspired by [6,14]. The material and geometrical parameters are provided in Table 1 to Table 3.
Figure 1. Simply supported single-lap involving the geometrical parameters, boundary conditions and in-plane loading.
Table 1. Geometrical parameters of joint configurations
b (mm) ea (mm) e1=e2 (mm) L (mm) l1=l2 (mm)
25 0.2 2 25 75
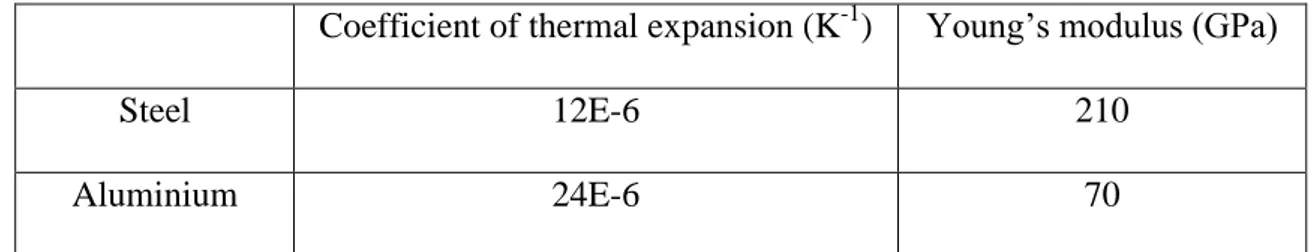
Table 2. Material parameters of adherends.
Coefficient of thermal expansion (K-1) Young’s modulus (GPa)
Steel 12E-6 210
Aluminium 24E-6 70
Table 3. Adhesive material properties. Ea,max (MPa) Ea,min (MPa) a
6500 2500 0.36 L l2 l1 ea e2 e1 x,u y,v +, width: b f v=0 u=0, v=0 T
10
2. Description of simplified stress analyses of FGA single-lap joints
2.1. Overview of the macro-element technique and application
The ME technique is inspired by the FE method and differs in the sense that the interpolation functions are not assumed. Indeed, they take the shape of solutions of the governing ODEs system, coming from the constitutive equations of the adhesive and adherends and from the local equilibrium equations, related to the simplifying hypotheses. A straightforward consequence is that only one ME is sufficient to model the full length of the bonded overlap (Figure 2). The main work is thus the formulation of the elementary stiffness matrix of the ME. The ME technique can be regarded as a mathematical procedure allowing for the resolution of the system of ODEs, under a less restricted application field of simplifying hypotheses, in terms of geometry, material behaviours, kinematics, boundary conditions and loads. Dedicated 4-nodes bonded-bars (BBa) and bonded-beams (BBe) have been formulated [18-24]. Once the stiffness matrix of the complete structure is assembled from the elementary stiffness matrices and the boundary conditions are applied, the minimization of the potential energy provides the solution, in terms of adhesive stress distributions along the overlap, internal forces and displacements in the adherends at any abscissa along the joint. The boundary conditions and loading are applied through the Augmented Lagrangian method [25-26]. Besides, an algorithm based on the Newton-Raphson iterative procedure has been developed to support nonlinear material behaviors of the adhesive and adherends [21-24]. In the case of nonlinear computation, the overlap length needs to be meshed with n_ME MEs along the overlap length (only) to allow for the update of the material properties within the iterative procedure (Figure 2). The meshing of the overlap length is used for the FGA joints. In this paper, a uniform mesh was chosen, so that the length of each ME is L/n_ME. The actual graduation of the adhesive properties is then approximated by a stepped function. The
11 adhesive peel and shear modulus assigned to the ith ME is taken equal to the value of the modulus graduation function at the abscissa located at the middle of the ME:
𝐸𝑎(𝑥𝑖 = (𝑖 −12)𝑛_𝑀𝐸𝐿 ) = 𝐸𝑎,𝑚𝑎𝑥 − (𝐸𝑎,𝑚𝑎𝑥− 𝐸𝑎,𝑚𝑖𝑛) ( (𝑖−12)𝑛_𝑀𝐸𝐿 𝐿 2 − 1) 2 (3) 𝐺𝑎(𝑥𝑖 = (𝑖 −12)𝑛_𝑀𝐸𝐿 ) = 𝐺𝑎,𝑚𝑎𝑥 − (𝐺𝑎,𝑚𝑎𝑥− 𝐺𝑎,𝑚𝑖𝑛) ((𝑖− 1 2) 𝐿 𝑛_𝑀𝐸 𝐿 2 − 1) 2 (4)
In this paper, the ME technique is applied to a particular configuration, under a particular set of boundary conditions and loading. However, this is not a restriction once again. Hereafter, the subscript j=1 (j=2) is related to the upper (lower) adherend. The computations were performed thanks to house-made computer programs developed on MATLAB. They are available on [8] related to a previous paper [27].
n_ME bar or beam
element bar or beam
element model for
HA joint
macro-element
bonded-bars or bonded-beams element
model for FGA joint or nonlinear material L l 2 l 1 e a e 2 e 1 x,u y,v +, width: b f f f v=0 v=0 u=0, v=0 u=0, v=0 neutral lines T
12 Figure 2.ME model for a single-lap joint using HA, FGA or nonlinear behavior, including the
geometrical parameters, boundary conditions and loading.
2.2. Hypotheses and governing equations
2.2.1 Bonded-bars element: 1D-bar kinematics
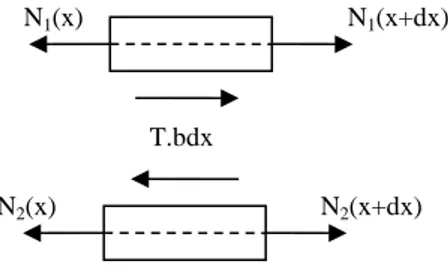
The following hypotheses were taken (i) the adherends are linear elastic materials simulated as bars, (ii) the adhesive layer is simulated by an infinite number of linear elastic shear springs linking both adherends, and (iii) the shape of graduation of the adhesive layer shear modulus is considered. As a result, it is supposed that all the adhesive stress components vanish except the in-plane shear. The local equilibrium of both adherends (Figure 3) provides the following equations:
𝑑𝑁𝑗
𝑏𝑑𝑥 = (−1)𝑗𝑇(𝑥), 𝑗 = 1,2 (5)
where b is the overlap width, Nj the normal force in the adherend j and T the adhesive shear
stress. It refers to the local equilibrium employed by Volkersen [12].
Figure 3.Free body diagram of infinitesimal pieces included between x and x+dx of both adherends in the overlap region. Subscript 1 (2) refers to the upper (lower) adherend.
The total strain is equal to the mechanical strain plus the thermal strain such as:
𝑑𝑢𝑗
𝑑𝑥 = 𝑁𝑗
𝐴𝑗, 𝑗 = 1,2 (6)
where Aj is the membrane stiffness of the adherend j, given by:
N1(x+dx)
N1(x)
T.bdx
N2(x+dx)
13
𝐴𝑗 = 𝐸𝑗𝑏𝑒𝑗 (7)
where ej is the thickness of the adherend j and Ej the Young’s modulus of the adherend. The
displacement uj(x) is the normal displacement of points located at the abscissa x on the neutral
line of adherend j.
The constitutive equation for the adhesive layer is provided by: 𝑇 = 𝐺𝑎𝑢2𝑒−𝑢1
𝑎 = 𝑘𝐼𝐼Δ𝑢 (8)
with:
Δ𝑢 = 𝑢2 − 𝑢1 (9)
where ea is the adhesive thickness, Ga the adhesive shear modulus and kII=Ga/ea the adhesive
shear relative stiffness. u is the differential displacement of the adherend interface.
2.2.2 Bonded-beams element: 1D-beam kinematics
The model is based on the following hypotheses: (i) the thickness of the adhesive layer is constant along the overlap, (ii) the adherends are simulated by linear elastic Euler-Bernoulli laminated beams and (iii) the adhesive layer is simulated by an infinite number of elastic shear and transverse springs linking both adherends. The eccentricity of the load path inherent to the single-lap joint configuration leads to a nonlinear secondary bending at both overlap ends [28]. To take into account this nonlinear effect without employing a dedicated iterative algorithm, the approach by Luo and Tong was selected [29]. The local equilibrium selected for the formulation element is then related to the one used by Luo and Tong [29]. It allows for a coupling between the normal force and the bending moment, which leads to a dependency of the ME elementary stiffness matric KBBe on the applied tensile force termed fME for the ME
formulation. The global equilibrium of the single-lap joint leads then to:
14 This equation is required to apply the Luo and Tong approach of the geometrically nonlinearities. Besides, it is easily possible to take into account the adhesive thickness in the local equilibrium bending equation as suggested by Hart-Smith [30]. The ME elementary stiffness matrix KBBe is then dependent on fME and the adhesive thickness, termed eaME for the
ME formulation. As a result, the ME formulation presented provides four different models, since fME=f or fME =0 and eaME=ea or eaME=0.
The constitutive equations for the adhesive layer are provided by: 𝑆 = 𝐸𝑎 𝑒𝑎[𝑣1− 𝑣2] = 𝑘𝐼Δ𝑣 (11) 𝑇 = 𝐺𝑎 𝑒𝑎[𝑢2− ℎ2𝜃2− (𝑢1+ ℎ1𝜃1)] = 𝑘𝐼𝐼Δ𝑢 (12) with: Δ𝑢 = 𝑢2 − 𝑢1− ℎ2𝜃2− ℎ1𝜃1 (13) Δ𝑣 = 𝑣1− 𝑣2 (14)
where Ea is the adhesive peel modulus and kI=Ea/ea the adhesive peel relative stiffness. v is
representative of the opening displacement of the adherend interface.
The local equilibrium of both adherends (Figure 4) provides the six following equations:
𝑑𝑁𝑗 𝑑𝑥 = (−1) 𝑗cos 𝜃 𝑗𝑏𝑇, 𝑗 = 1,2 (15) 𝑑𝑉𝑗 𝑑𝑥 = (−1)𝑗+1𝑏𝑆 + (−1)𝑗sin 𝜃𝑗𝑏𝑇, 𝑗 = 1,2 (16) 𝑑𝑀𝑗 𝑑𝑥 + 𝑉𝑗 + cos 𝜃𝑗𝑏 (ℎ𝑗+ 𝑒𝑎𝑀𝐸 2 ) 𝑇 − sin 𝜃𝑗𝑁𝑗 = 0, 𝑗 = 1,2 (17) with: ℎ𝑗 =𝑒2𝑗, 𝑗 = 1,2 (18)
where Vj is the shear force in the adherend j, Mj the bending moment in the adherend j, j the
15 Figure 4.Free body diagram of infinitesimal pieces included between x and x+dx of both
adherends in the overlap region. Subscript 1 (2) refers to the upper (lower) adherend. These previous ODEs are nonlinear. The same hypotheses as those used by Luo and Tong were employed in this paper. First, it is supposed that the adherend bending angles are small allowing for the 1st order Taylor expansion of sine and cosine functions. Moreover, the product of the adhesive shear stress with the adherend bending angle is neglected. Under these both first assumptions, the Eqs. (15-17) become:
𝑑𝑁𝑗 𝑑𝑥 = (−1) 𝑗𝑏𝑇, 𝑗 = 1,2 (19) 𝑑𝑉𝑗 𝑑𝑥 = (−1)𝑗+1𝑏𝑆, 𝑗 = 1,2 (20) 𝑑𝑀𝑗 𝑑𝑥 + 𝑉𝑗 + 𝑏 (ℎ𝑗 + 𝑒𝑎𝑀𝐸 2 ) 𝑇 − 𝜃𝑗𝑁𝑗 = 0, 𝑗 = 1,2 (21)
The following algebraic transformation is applied to each parameters related to the subscript j (i.e.: Nj, Vj, Mj, uj, vj, qj, hj) quoted X: (𝑋𝑋+ −) = Λ ( 𝑋1 𝑋2) = (1 1 1 −1) ( 𝑋1 𝑋2) (22) x y + N1+dN1 M1+dM1 V1+dV1 V2+dV2 N2+dN2 M2+dM2 M1 V1 V2 M2 N1 N2 S.bdx T.bdx T.bdx 1 1 2 1 ea/2
16 It is then assumed that:
𝑁−
2 (𝜃1∓ 𝜃2) ≪ 1, 𝑗 = 1,2 (23)
Considering the Eq. (10) and Eq. (23), the Eqs. (19-21) become finally:
𝑑𝑁+ 𝑑𝑋 = 0 (24) 𝑑𝑉+ 𝑑𝑋 = 0 (25) 𝑑𝑀+ 𝑑𝑋 = −𝑉++ 𝑘𝐼𝐼𝑏ℎ+𝑢−+ ( 1 2𝑘𝐼𝐼𝑏(ℎ++ 𝑒𝑎𝑀𝐸) 2+𝑓𝑀𝐸 2 ) 𝜃++ ( 1 2𝑘𝐼𝐼𝑏(ℎ++ 𝑒𝑎𝑀𝐸)ℎ−) 𝜃− (26) 𝑑𝑁− 𝑑𝑋 = 2𝑘𝐼𝐼𝑏𝑢−+ 𝑘𝐼𝐼𝑏(ℎ++ 𝑒𝑎𝑀𝐸)𝜃+ + 𝑘𝐼𝐼𝑏ℎ−𝜃− (27) 𝑑𝑉− 𝑑𝑋 = 2𝑘𝐼𝑏𝑤− (28) 𝑑𝑀− 𝑑𝑋 = −𝑉−+ 𝑘𝐼𝐼𝑏ℎ−𝑢−+ ( 1 2𝑘𝐼𝐼𝑏(ℎ++ 𝑒𝑎𝑀𝐸)ℎ−) 𝜃++ ( 1 2𝑘𝐼𝐼𝑏ℎ−2 + 𝑓𝑀𝐸 2 ) 𝜃− (29)
The constitutive equations can then be written as: 𝑁𝑗 = 𝐴𝑗𝑑𝑢𝑗 𝑑𝑥 − 𝐵𝑗 𝑑𝜃𝑗 𝑑𝑥 , 𝑗 = 1,2 (30) 𝑀𝑗 = −𝐵𝑗𝑑𝑢𝑗 𝑑𝑥 + 𝐷𝑗 𝑑𝜃𝑗 𝑑𝑥 , 𝑗 = 1,2 (31) 𝜃𝑗 = 𝑑𝑣𝑗 𝑑𝑥 (32)
where Aj is the membrane stiffness of adherend j, Bj the coupling membrane-bending stiffness
of adherend j, Dj the bending stiffness of adherend j (see Appendix A).
The algebraic transformation defined in Eq. (22) is applied so that the Eqs. (30-32) become:
𝑑𝑢+ 𝑑𝑋 = 1 2( 𝐷1 Δ1+ 𝐷2 Δ2) 𝑁++ 1 2( 𝐷1 Δ1− 𝐷2 Δ2) 𝑁−+ 1 2( 𝐵1 Δ1+ 𝐵2 Δ2) 𝑀++ 1 2( 𝐵1 Δ1− 𝐵2 Δ2) 𝑀− (33) 𝑑𝑣+ 𝑑𝑋 = 𝜃+ (34) 𝑑𝜃+ 𝑑𝑋 = 1 2( 𝐵1 Δ1+ 𝐵2 Δ2) 𝑁++ 1 2( 𝐵1 Δ1− 𝐵2 Δ2) 𝑁−+ 1 2( 𝐴1 Δ1+ 𝐴2 Δ2) 𝑀++ 1 2( 𝐴1 Δ1− 𝐴2 Δ2) 𝑀− (35) 𝑑𝑢− 𝑑𝑋 = 1 2( 𝐷1 Δ1− 𝐷2 Δ2) 𝑁++ 1 2( 𝐷1 Δ1+ 𝐷2 Δ2) 𝑁−+ 1 2( 𝐵1 Δ1− 𝐵2 Δ2) 𝑀++ 1 2( 𝐵1 Δ1+ 𝐵2 Δ2) 𝑀− (36)
17 𝑑𝑣− 𝑑𝑋 = 𝜃− (37) 𝑑𝜃− 𝑑𝑋 = 1 2( 𝐵1 Δ1− 𝐵2 Δ2) 𝑁++ 1 2( 𝐵1 Δ1+ 𝐵2 Δ2) 𝑁−+ 1 2( 𝐴1 Δ1− 𝐴2 Δ2) 𝑀++ 1 2( 𝐴1 Δ1+ 𝐴2 Δ2) 𝑀− (38) where j=AjDj-BjBj≠0.
2.3. Formulation of elementary stiffness matrices
The elementary stiffness matrices of BBa and BBe elements, termed KBBa and KBBe
respectively, correspond to the linear relationships between the vector of nodal forces Fe and
the vector nodal displacements Ue. Terming the length of the ME, the definition of
elementary stiffness matrices KBBa and KBBe are provided in Eq. (39) and Eq. (40)
respectively. ( −𝑁1(0) −𝑁2(0) 𝑁1(Δ) 𝑁2(Δ) ) = 𝐾𝐵𝐵𝑎 ( 𝑢1(0) 𝑢2(0) 𝑢1(Δ) 𝑢2(Δ)) ⟺ 𝐹𝑒 = 𝐾𝐵𝐵𝑎𝑈𝑒 (39) ( −𝑁1(0) −𝑁2(0) 𝑁1(Δ) 𝑁2(Δ) −𝑉1(0) −𝑉2(0) 𝑉1(Δ) 𝑉2(Δ) −𝑀1(0) −𝑀2(0) 𝑀1(Δ) 𝑀2(Δ) ) = 𝐾𝐵𝐵𝑒 ( 𝑢1(0) 𝑢2(0) 𝑢1(Δ) 𝑢2(Δ) 𝑣1(0) 𝑣2(0) 𝑣1(Δ) 𝑣2(Δ) 𝜃1(0) 𝜃2(0) 𝜃1(Δ) 𝜃2(Δ)) ⟺ 𝐹𝑒 = 𝐾𝐵𝐵𝑒𝑈𝑒 (40)
In the case of the 1D-bar kinematics, the closed-form expressions for the components of KBBa
18 𝐾𝐵𝐵𝑎=1+𝜒1 𝐴 𝐴2 Δ ( 𝜂Δ tanh 𝜂Δ+ 1 𝜒𝐴 1 − 𝜂Δ tanh 𝜂Δ − 𝜂Δ sinh 𝜂Δ− 1 𝜒𝐴 𝜂Δ sinh 𝜂Δ− 1
1 −tanh 𝜂Δ𝜂Δ tanh 𝜂Δ𝜂Δ + 𝜒𝐴 sinh 𝜂Δ𝜂Δ − 1 −sinh 𝜂Δ𝜂Δ − 𝜒𝐴
−sinh 𝜂Δ𝜂Δ −𝜒1 𝐴 𝜂Δ sinh 𝜂Δ− 1 𝜂Δ tanh 𝜂Δ+ 1 𝜒𝐴 1 − 𝜂Δ tanh 𝜂Δ 𝜂Δ sinh 𝜂Δ− 1 − 𝜂Δ sinh 𝜂Δ− 𝜒𝐴 1 − 𝜂Δ tanh 𝜂Δ 𝜂Δ tanh 𝜂Δ+ 𝜒𝐴 ) (41) where: 𝜂2 = 𝐺 𝑒( 1 𝑒1𝐸1+ 1 𝑒2𝐸2) (42) 𝜒𝐴 =𝐴2 𝐴1 (43)
In the case of the 1D-beam kinematics, the components of KBBe cannot be determined
analytically and several methodologies have been suggested depending on the simplifying hypotheses [8,18,20-21]. In the present paper, a methodology based on the exponential matrix was used [8,24] to solve the system of linear ODEs formed by Eqs. (24-29) and Eqs. (33-38 , written as 𝑑𝑋𝑑𝑉= 𝐴𝑉 where A is 12x12 matrix with real constant components and the unknown vector V is such that tV=(u1 u2 v1 v2 1 2 N1 N2 V1 V2 M1 M2). With this formulation
methodology, the predictions in terms of adhesive stresses, adherend displacements and internal forces are given at nodes. A mesh is then required to obtain distributions at any abscissa along the overlap. As a result, this formulation methodology is suitable when FGA or nonlinear adhesives are used but less efficient in the case of HA or linear adhesives in terms of distribution predictions. However, this methodology allows for an easy formulation of BBe under various hypotheses in terms of local equilibrium or constitutive behavior. Finally, the elementary stiffness matrix of the bar element, modelling the adherend j outside the overlap is:
𝐾𝑏𝑎𝑟,𝑗 =𝐴𝑗
𝑙𝑗( 1 −1
−1 1 ) , 𝑗 = 1,2 (44)
In the case of the 1D-beam kinematics, the corresponding beam element is formulated following the same methodology as for the BBe (Appendix C in [8]).
19
2.4. Uniform variation of temperature
As classically done in the FE method, a nodal force vector equivalent to the thermal loading was added at the left-hand side of Eqs. (39-40). The nodal force vector equivalent to the thermal loading is computed from the elementary nodal force vector equivalent to thermal load, given in Eq. (45) and Eq. (46) for the 1D-bar and 1D-beam kinematics [8]:
𝐹𝑒,𝑡ℎ𝑒𝑟𝑚 = ( −𝐴1𝛼1 −𝐴2𝛼2 𝐴1𝛼1 𝐴2𝛼2 ) Δ𝑇 (45) 𝐹𝑒,𝑡ℎ𝑒𝑟𝑚 = ( −𝑁1Δ𝑇 −𝑁2Δ𝑇 𝑁1Δ𝑇 𝑁2Δ𝑇 0 0 0 0 𝑀1Δ𝑇 𝑀2Δ𝑇 −𝑀1Δ𝑇 −𝑀2Δ𝑇) (46)
where 𝑁𝑗Δ𝑇 the thermal normal force in the adherend j and 𝑀𝑗Δ𝑇 is the thermal bending moment in the adherend j (see Appendix A). In the case of a lay-up characterized by a mirror symmetry, 𝑀𝑗Δ𝑇 = 0 (as well as B
j=0).
2.5. Convergence study
A convergence study was performed on the adhesive peak stresses as function on the number of MEs n_ME, assuming FGA properties. For the 1D-bar kinematics, the balanced joint under a pure mechanical loading was considered. For the 1D-beam kinematics, the unbalanced joint under a pure mechanical loading was considered, using the ME formulation hypotheses fME=f
20 and eaME=0. The conclusions for all the other configurations are the same. The maximal
adhesive stresses were then recorded as a function of the number of ME. They were then normalized by their corresponding values at n_ME=1000. The normalized adhesive peak stresses are provided as functions of n_ME in Figure 5 and Figure 6, for the bar and 1D-beam kinematics respectively. For both kinematics, it is shown that the adhesive peak stresses tend to a finite value. Moreover, for the 1D-beam kinematics, the curves related to peel stresses and shear stresses are very close. In the present paper, the number of MEs is then selected equal to 500 for L=25 mm leading to a mesh density of 20 MEs per mm.
Figure 5. Maximal adhesive shear stresses (Tmax) normalized by its value for n_ME=1000 as a
function of the number of MEs for the 1D-bar ME model of the balanced case under a pure mechanical loading. 0.9 1 1.1 1.2 1.3 1.4 1.5 1.6 0 200 400 600 800 1000 ad h e si ve st re ss n o rm al ize d b y t h e v al u e at n _M E= 1000
number of MEs (n_ME)
21 Figure 6. Maximal adhesive shear (Tmax) and peel (Smax) stresses stress normalized by its value
for n_ME=1000 as a function of the number of MEs for the 1D-beam ME (fME=f and eaME=0)
model of the unbalanced cases under a pure mechanical loading.
3. Description of Finite Element models of FGA single-lap joints
3.1. Overview
Two different types of FE models are presented. The first type of FE models are designed to be representative for the ME models in terms of hypotheses. Both 1D-bar and 1D-beam kinematics are then considered leading to one 1D-bar FE model and one 1D-beam model. The second type of FE models are refined 3D models considered as a relevant approximation of the physical reality. The inclusion or not of the adhesive thickness in the local equilibrium bending equations was considered. As a result, the adhesive layer was modelled either with 3D bricks elements or with 3D interface elements; the corresponding 3D FE models are then termed 3D FE volume model (VM) and 3D FE cohesive zone model (CZM) respectively. The geometry, boundary conditions and loading are provided in Figure 1 and Table 1 to Table 3. The FE models were developed using the SAMCEF v171 FE code (SIEMENS).
0.9 1 1.1 1.2 1.3 1.4 1.5 0 200 400 600 800 1000 ad h e si ve p e ak str e ss n o rm al ize d b y t h e v al u e at n _M E= 1000
number of MEs (n_ME)
Tmax Smax
shear
22
3.2. 1D FE models
3.2.1 Modelling
To be as close as possible the modelling hypotheses of ME models, the 1D FE models were built from bar or beam elements for the adherends and spring elements for the adhesive layer. The nodes associated with bar or beam elements were located at the actual neutral line of adherends. The nodes associated with the spring elements were located at the actual interfaces of adherends. For each adherend along the overlap, rigid body elements were used to link the nodes of the neutral lines and to the nodes of the adherend interface. A scheme of the 1D FE models is provided in Figure 7, including the prescribed displacements and loading.
It is then possible to take into account the geometrical effect of the adhesive thickness by setting eaEF=ea instead of eaEF=0 (Figure 7). Linear or nonlinear computation can be used.
The bar and beam elements are based on degree 3 interpolating functions under the Euler-Bernoulli kinematics. The overlap length of adherends was then regularly meshed with n_BE. The stiffnesses of springs ku and kv are directly related to the mesh density along the overlap [31]. For a spring element located at an abscissa x along the overlap, the stiffnesses are computed from the actual value of adhesive peel and shear modulus at the abscissa x, the adhesive thickness ea, the width b and the mesh density L/n_BE such as:
𝑘𝑣(𝑥) = 𝑚(𝑥)𝑛_𝐵𝐸𝐿 𝑏𝐸𝑎𝑒(𝑥) 𝑎 = 𝑚(𝑥) 𝐿 𝑛_𝐵𝐸𝑏𝑘𝐼(𝑥) (47) 𝑘𝑢(𝑥) = 𝑚(𝑥)𝑛_𝐵𝐸𝐿 𝑏𝐺𝑎(𝑥) 𝑒𝑎 = 𝑚(𝑥) 𝐿 𝑛_𝐵𝐸𝑏𝑘𝐼𝐼(𝑥) (48) where m(0<x<L)=1 and m(x=0)=m(x=L)=1/2.
23 Figure 7. Principle scheme for the 1D FE models.
3.2.2 Convergence study
The adhesive stresses predicted by the 1D FE models are expected to be dependent on the number of spring elements. A convergence study was then undertaken. The results of the balanced case under a pure mechanical loading are presented under the 1D-beam kinematics, such as eaEF=ea and geometrically linear computation. The same conclusions for the other
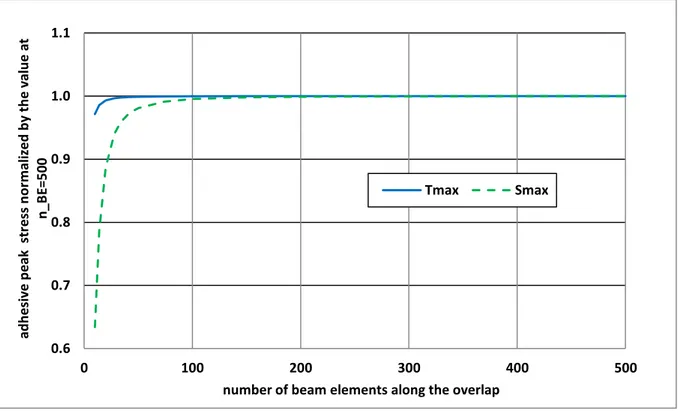
possible configurations hold. For each mesh configuration associated to n_BE, the adhesive peak stresses are then recorded and normalized by their corresponding values at n_BE=500. The normalized adhesive peak stresses are given as a function of n_BE in Figure 8. It is shown that the maximal adhesive stresses tend to finite values. In the present paper, the
bar or beam element
rigid body element L l 2 l 1 e a e 2 e 1 x,u y,v +, width: b f f v=0 u=0, v=0 neutral lines eaEF e 1/2 e2/2 spring element interface lines T eaEF=ea or 0
24 number of bar or beam elements is then chosen equal to 500 for L=25 mm leading to a mesh density of 20 elements per mm.
Figure 8. Maximal adhesive shear (Tmax) and peel (Smax) stresses stress normalized by its value
for n_BE=500 as a function of the number of MEs for the geometrical linear 1D-beam FE (eaFE=ea) model of the unbalanced case under a pure mechanical loading.
3.3. 3D FE models
3.3.1 Modelling
To assess the prediction accuracy of ME models, refined 3D FE models were developed for linear or nonlinear geometrically cases. The adherends were meshed with 3D linear brick 8-nodes elements (24 degrees of freedom per element). The selected elements have one internal mode to improve the behaviour under bending. The normal integration scheme was chosen. The mesh of the 3D-model consists in an extrusion in the width direction of the FE model mesh. However, as the (xy) plane at half width is a symmetry plane (Figure 1), only one-half
0.6 0.7 0.8 0.9 1.0 1.1 0 100 200 300 400 500 ad h e si ve p e ak st re ss n o rm al ize d b y t h e v al u e at n _B E= 500
number of beam elements along the overlap
25 of the single-lap joint was modelled and symmetry conditions were applied. The adhesive layer was modelled according to different ways. For the 3D FE VM, the same brick elements as the adherends were used for the adhesive layer. For the 3D FE CZM, the adhesive layer was modelled by interface elements without any geometrical thickness. In order to additionally reduce the number of elements, a distributed mesh strategy was employed, leading to the creation of various useful mesh domains. Indeed, according to [8], the adhesive stress distribution along the overlap predicted by the ME models in the single-lap joint configuration is characterized by high stress gradients at both overlap ends for both HA and FGA joints. It is indicated that for FGA joints, and contrary to the HA joints, it is not always the case as highlighted by Stein et al. [14]. As a result, the mesh was more refined at both overlap ends than at the middle of the overlap (Figure 9). Outside the overlap, the mesh was distributed along the length direction, so that the mesh was more refined near the overlap region. The mesh was distributed along the adherend thickness between the interface with the adhesive layer and its neutral line. Above the neutral line towards the adherend free surface, the mesh is regular. The mesh of the single-lap joint was then designed according to the following rules: (i) coincident meshes between the mesh domains, (ii) transition ratio equal to one between the mesh domains, (iii) element aspect ratio lower than 10, (iv) regular mesh in the width direction, (v) the aspect ratio of the smallest element in the adherend – located at the interface with the adhesive at the overlap end (Figure 9) – equal to one, (vi) regular mesh in the adhesive thickness along the adhesive thickness for the 3D FE VM. Under these rules, the mesh of 3D FE CZM is driven by the thickness of the smallest adherend element at the interface layer s and by the element longitudinal slenderness r (ratio between the maximal and the minimal length in the mesh distribution), while the mesh of 3D FE VM is driven by the number of element in the adhesive thickness n, s and r (Figure 9).
26 Figure 9. Illustration of the mesh distribution strategy.
3.3.2 Convergence study
In order to justify the 3D FE models as well as the associated choice of mesh parameters n, s and r, a convergence study of adhesive peak stresses is presented. The single-lap unbalanced FGA joint under a combined mechanical and thermal loading was considered. Nonlinear geometrical computations were carried out for various combinations of n, s and r and the adhesive peak stresses were recorded along the line of adhesive layer mid-plane located in the
nelements in the adhesive thickness smallest adherend element r * s s
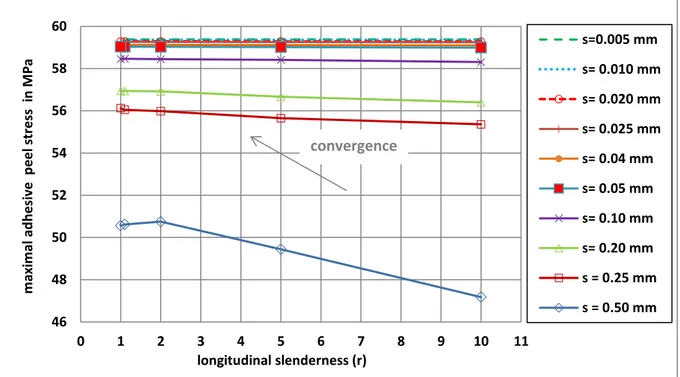
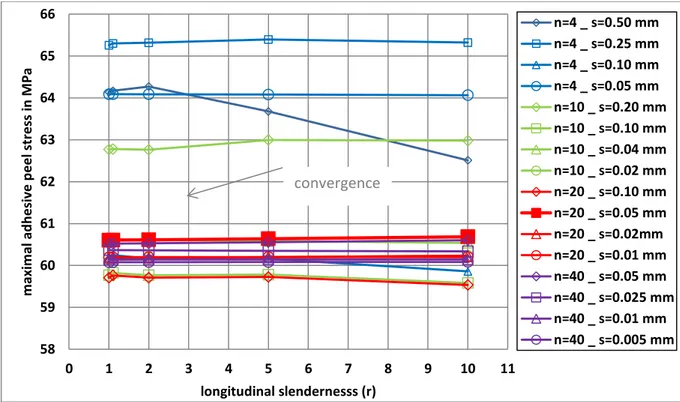
27 symmetry plane. Firstly, for the 3D FE CZM, the maximal adhesive shear and peel stresses as functions of s and r are provided in Figure 10 and Figure 11, respectively. It is then shown that a convergence is obtained from a combination of s=0.05 mm and r=5. These parameters were fixed for this paper. Secondly, for the 3D FE VM, the maximal adhesive shear and peel stresses as a function of n, s and r are provided in Figure 12 and Figure 13, respectively. The adhesive stresses were taken along the neutral line of the adhesive layer. The choice n=20, s=0.05 mm and r=5 is sufficient to obtain converged values. These parameters were fixed for this paper.
Figure 10. Maximal adhesive shear stress as a function of longitudinal slenderness r for various smallest element size s predicted by the nonlinear geometrically 3D FE CZM model
of the unbalanced single-lap FGA joint under combined mechanical and thermal loadings.
56 57 58 59 60 0 1 2 3 4 5 6 7 8 9 10 11 maximal adh es iv e shear stre ss in M P a longitudinal slenderness (r) s = 0.005 mm s= 0.010 mm s= 0.020 mm s= 0.025 mm s= 0.04 mm s= 0.05 mm s= 0.10 mm s= 0.20 mm s= 0.25 mm s= 0.50 mm convergence
28 Figure 11. Maximal adhesive peel stress as functions of longitudinal slenderness r for various
smallest element size s predicted by the nonlinear geometrically 3D FE CZM model of the unbalanced single-lap FGA joint under combined mechanical and thermal loadings.
Figure 12. Maximal adhesive shear as functions of the number of elements in the adhesive thickness n and of the longitudinal slenderness r for various smallest element size s predicted
46 48 50 52 54 56 58 60 0 1 2 3 4 5 6 7 8 9 10 11 m axi m al ad h e si ve p e e l st re ss in M Pa longitudinal slenderness (r) s=0.005 mm s= 0.010 mm s= 0.020 mm s= 0.025 mm s= 0.04 mm s= 0.05 mm s= 0.10 mm s= 0.20 mm s = 0.25 mm s = 0.50 mm 48 49 50 51 52 53 54 55 56 57 58 0 1 2 3 4 5 6 7 8 9 10 11 m axi m l ad h e si ve sh e ar st re ss i n M Pa longitudinal slenderness (r) n=4 _ s=0.50 mm n=4 _ s=0.25 mm n=4 _ s=0.10 mm n=4 _ s=0.05 mm n=10 _ s=0.20 mm n=10 _ s=0.10 mm n=10 _ s=0.04 mm n=10 _ s=0.02 mm n=20 _ s=0.10 mm n=20 _ s=0.05 mm n=20 _ s=0.02 mm n=20 _ s=0.01 mm n=40 _ s=0.05 mm n=40 _ s=0.025 mm n=40 _ s=0.01 mm n=40 _ s=0.005 mm convergence convergence
29 by the nonlinear geometrically 3D FE VM model of the unbalanced single-lap FGA joint
under combined mechanical and thermal loadings.
Figure 13. Maximal adhesive peel stress as functions of the number of elements in the adhesive thickness n and of the longitudinal slenderness r for various smallest element size s predicted by the nonlinear geometrically 3D FE VM model of the unbalanced single-lap FGA
joint under combined mechanical and thermal loadings.
4. Comparison of ME and FE models predictions
4.1. Comparison of 1D-bar ME model with 1D-bar FE model
The maximal adhesive shear stress Tmax as well as the differences on Tmax predicted by the
1D-bar ME model relatively to those predicted by the 1D-1D-bar FE model are provided in Table B-1 (Appendix B). A maximal relative difference of 0.32% was obtained for the FGA joint whereas it is equal to 0.00% for the HA joints. This small difference between the FGA and HA joints could be explained by the fact that, for FGA joints, the adhesive modulus of the ME
58 59 60 61 62 63 64 65 66 0 1 2 3 4 5 6 7 8 9 10 11 m axi m al ad h e si ve p e e l st re ss i n M Pa longitudinal slendernesss (r) n=4 _ s=0.50 mm n=4 _ s=0.25 mm n=4 _ s=0.10 mm n=4 _ s=0.05 mm n=10 _ s=0.20 mm n=10 _ s=0.10 mm n=10 _ s=0.04 mm n=10 _ s=0.02 mm n=20 _ s=0.10 mm n=20 _ s=0.05 mm n=20 _ s=0.02mm n=20 _ s=0.01 mm n=40 _ s=0.05 mm n=40 _ s=0.025 mm n=40 _ s=0.01 mm n=40 _ s=0.005 mm convergence
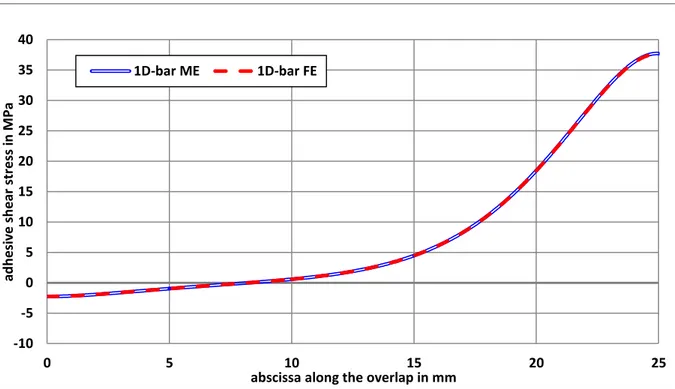
30 is assessed at the centre of each ME and not at the extremity. Moreover, in terms of distribution along the overlap, the predictions of 1D FE and 1D ME models appear as superimposed, as illustrated in Figure 14,for the unbalanced case under combined mechanical and thermal loadings, for example. It can be concluded that a very good agreement is obtained.
Figure 14. Adhesive shear stress distribution along the overlap from the 1D-bar ME and FE models for the FGA unbalanced joint under combined mechanical and thermal loadings.
4.2. Comparison of 1D-beam ME models with 1D-beam FE models
In the frame of the 1D-beam kinematics, the ME model presented cover four different sets of hypotheses involved in the formulation of the ME elementary stiffness matrix: (i) eaME=0 and
fME=0, (ii) eaME=0 and fME=f, (iii) eaME=ea and fME=0 and (iv) eaME=ea and fME=f. To perform
the comparisons, the four different sets of hypotheses were applied to the 1D-beam FE model: (i) eaFE=0 and linear geometrical, (ii) eaFE=0 and nonlinear geometrical, (iii) eaFE=ea and
-10 -5 0 5 10 15 20 25 30 35 40 0 5 10 15 20 25 ad h e si ve sh e ar st re ss i n M Pa
abscissa along the overlap in mm 1D-bar ME 1D-bar FE
31 linear geometrical and (iv) eafE=ea and nonlinear geometrical, respectively. The maximal
adhesive shear stress Tmax and peel stress as well as the differences on Tmax and Smax predicted
by the 1D-beam ME model relatively to those predicted by the related 1D-beam FE model are reported in Table B-2 (Appendix B). The ME formulation hypothesis eaME=ea and fME=f leads
to the largest relative differences, while the ME formulation hypothesis eaME=0 and fME=0
leads to the lowest. Within a set of ME formulation hypotheses, the relative differences on the adhesive peak stress are of the same order of magnitude, whatever the adhesive properties, the joint configuration or the applied loadings chosen. Moreover, it appears that the consideration of the adhesive thickness in the local equilibrium bending moment equation (eaME=0 or
eaME=ea) is more influent on the shear stresses than on the peel stresses, independently on the
geometrical nonlinearities: around 1% if eaME=0 while around 3% if eaME=ea. The geometrical
nonlinearities have more impact on the peel stresses than on the shear stresses independently of the hypothesis of eaME: around 1% without geometrical nonlinearities while around 7%
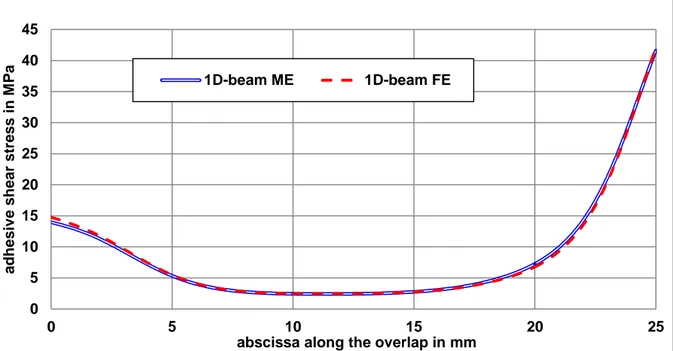
with geometrical nonlinearities. It is reminded that the ME models provide only an approximation regarding the geometrical nonlinearities effect. The comparison of adhesive shear and peel stress distributions along the overlap for the FGA unbalanced joint and for the ME formulation hypothesis eaME=ea and fME=f (largest relative differences) under combined
mechanical and thermal loadings are provided in Figure 15 ad Figure 16. A very good agreement is obtained.
32 Figure 15. Adhesive shear stress distribution along the overlap from the 1D-beam ME
(eaME=ea and fME=f) and FE (eaFE=ea and nonlinear geometrical) models for the FGA
unbalanced joint under combined mechanical and thermal loadings.
Figure 16. Adhesive peel stress distribution along the overlap from the 1D-beam ME (eaME=ea
and fME=f) and FE (eaFE=ea and nonlinear geometrical) models for the FGA unbalanced joint
under combined mechanical and thermal loadings.
0 5 10 15 20 25 30 35 40 45 0 5 10 15 20 25 adh es iv e shear stres s in M P a
abscissa along the overlap in mm
1D-beam ME 1D-beam FE -10 -5 0 5 10 15 20 25 30 35 40 0 5 10 15 20 25 ad h e si ve p e e l st re ss i n M Pa
absissa along the overlap in mm 1D-beam ME 1D-beam FE
33
4.3. Comparison of 1D ME and FE models with 3D FE models
To compare with the 3D FE CZM and with the 3D FE VM, the 1D-beam FE and ME models with eaME=eaFE=0 and with eaME=eaFE=ea were considered, respectively. The linear and
nonlinear geometrical analysis hypotheses was associated for the 1D-beam model with fME=0
and fME=f, respectively. The maximal adhesive shear stress Tmax and peel stress Smax predicted
by the 1D-beam ME and FE models and by the 3D FE models as well as the differences in Tmax and Smax predicted by the 1D-beam ME and FE models relatively to those predicted by
the related 3D FE model are provided in Table B-3 (Appendix B). The FGA balanced and unbalanced joints subjected to pure mechanical or combined mechanical and thermal loadings were considered. Concerning the adhesive peak shear stress, the absolute relative differences are small and lower than 8% in the worst case. It appears that the 1D ME and FE models provide the same order of magnitude of absolute relative differences. Concerning the adhesive peak peel stress, the absolute relative differences are larger than for the shear stress and reach 17.5% in the worst case. The 1D ME and FE models provide almost the same order of magnitude of absolute relative differences. But the largest absolute relative differences are obtained with the 1D ME models. For both shear and peel stresses, the absolute relative differences are lower when the geometrical effect of the adhesive thickness (i.e.: eaME=eaFE=0
and CZM) is neglected. The nonlinear geometrical analysis hypothesis increases the absolute relative differences in terms of adhesive peak peel stress, all the more for the 1D ME models and independently on the adhesive thickness geometrical effect. The adhesive peak shear stress appears as less sensitive to geometrical nonlinearities. The comparison of adhesive shear and peel stress distributions along the overlap for the FGA unbalanced joint subjected to mechanical and thermal loadings and pure mechanical loadings are then provided in Figure 17 to Figure 18 and Figure 19 to Figure 20, respectively. For the 3D FE VM, the adhesive shear tends to zero in x=0 and x=L, in order to comply with the free stress conditions at overlap
34 ends (Figure 19). The adhesive peel stress is decreasing too. The adhesive peak stresses are obtained for an abscissa located within the overlap near the overlap ends. The hypotheses underlying the 1D-beam ME and FE models as well as the 3D FE CZM are not able to produce this behaviour. Nevertheless, a good agreement is globally show in terms of distribution shape. The differences shown are representative for the effect of simplification hypotheses on kinematics and constitutive behaviours. A last remark concerns the choice the adhesive Young’s modulus as the adhesive peel modulus in this paper. Other choices could have been made to represent for the confinement of the adhesive layer between both adherends and subjected to out-of-plan tensile. The contribution of adherend out-of-plane stiffnesses in the adhesive peel modulus [32] or the plane strain adhesive Young’s modulus instead of the adhesive Young’s modulus as the adhesive peel modulus [33,14] are possible choice examples. Nevertheless, this discussion is out of the scope of this paper, even if it could be addressed with the provided models and results presented in this paper.
Figure 17. Adhesive shear stress distribution along the overlap from the 1D-beam ME
(eaME=0 and fME=f) and FE (eaFE=0 and nonlinear geometrical) models and 3D FE CZMM for
the unbalanced case under combined mechanical and thermal loadings.
0 5 10 15 20 25 30 35 40 45 0 5 10 15 20 25 ad h e si ve sh e ra st re ss i n M Pa
abscissa along the overlap in mm
35 Figure 18. Adhesive peel stress distribution along the overlap from the 1D-beam ME (eaME=0
and fME=f) and FE (eaFE=0 and nonlinear geometrical) models and 3D FE CZMM for the
unbalanced case under combined mechanical and thermal loadings.
Figure 19. Adhesive shear stress distribution along the overlap from the 1D-beam ME (eaME=ea and fME=f) and FE (eaFE=ea and nonlinear geometrical) models and 3D FE VM for
the unbalanced case under a pure mechanical loading.
-10 -5 0 5 10 15 20 25 30 35 0 5 10 15 20 25 ad h e si ve p e e l st re ss i n M Pa
abscissa along the overlap in mm
1D-beam ME 1D-beam FE 3D FE CZM 0 5 10 15 20 25 30 35 40 45 0 5 10 15 20 25 adh es iv e shear stres s in M P a
abscissa along the overlap in mm
36 Figure 20. Adhesive shear stress distribution along the overlap from the 1D-beam ME (eaME=ea and fME=f) and FE (eaFE=ea and nonlinear geometrical) models and 3D FE VM for
the unbalanced case under a pure mechanical loading.
5. Application: influence of overlap length
As an application of the simplified stress analyses based on ME models, the influence of the overlap length on the maximal adhesive stresses of balanced FGA joints was studied. In the case of HA joints, the increase of overlap length tends to decrease the maximal adhesive stresses [30,32].
5.1. 1D-bar kinematics
Within the 1D-bar framework the peak shear stress tends to a finite value [32] for HA joints. The analytical expression for the critical applied tensile load can then be deduced. Moreover, it is not useful to increase the overlap length above a certain value to increase the strength. When using FGA instead of HA, the distribution of adhesive shear stress could predict an adhesive peak stress at the centre of the overlap [14] instead of at both overlap ends. The
-10 -5 0 5 10 15 20 25 30 35 40 0 5 10 15 20 25 ad h e si ve p e e l st re ss i n M Pa
absissa along the overlap in mm
37 adhesive shear stress distribution as a function of the normalized abscissa along the overlap is provided for various overlap lengths in Figure 21. The abscissa normalization is defined by (x-L/2)/(L/2). Depending on the overlap length, three different behaviours appear as shown in
Figure 22. For small overlap lengths, the adhesive peak shear stress is located at the centre of the overlap. For long overlap lengths, the adhesive peak shear stress is located at both overlap ends. For intermediate overlap lengths, the adhesive peak stress is reached between the overlap centre and the overlap end. The adhesive peak shear stress as function of the overlap length is provided in Figure 23 for the FGA and HA joints. As for the HA joints, the increase of the overlap length tends to reduce the adhesive peak stresses. Nevertheless, contrary to the HA joints, there is an overlap length for which the adhesive peak shear stress is minimal, and is equal here to around 30 mm.
Figure 21. Adhesive shear stress distribution along the overlap (normalized abscissa) for various overlap lengths in the case of FGA joints.
0 5 10 15 20 25 -1 -0.8 -0.6 -0.4 -0.2 0 0.2 0.4 0.6 0.8 1 ad h e si ve sh e ar st re ss i n M Pa
normalized abscissa along the overlap in mm
L=9 mm L=10 mm L=15 mm
38 Figure 22. Normalized abscissa for which the adhesive shear stress is reached as function of
the overlap length in the case of FGA joint.
Figure 23. Adhesive peak shear stress as function of the overlap length for FGA and HA joints. 0 0.1 0.2 0.3 0.4 0.5 0.6 0.7 0.8 0.9 1 0 20 40 60 80 100 n or m al p osi ti on o f m ax im al str ess overlap length in mm FGA 0 5 10 15 20 25 30 10 20 30 40 50 60 70 80 90 100 m axi m al ad h e si ve sh re ar str e ss i n M Pa overlap length in mm FGA HA at Ga,max HA at Ga,min
39
5.2 1D-beam kinematics
The 1D-beam ME model, under the ME formulation hypotheses eaME=0 and fME=f is used to
provide the adhesive peak shear and peel stress as a function of overlap length for FGA and HA joints, in Figure 24 and Figure 25 respectively. The evolutions appear as similar between the FGA and HA joints. However, the adhesive peak shear and peel stresses are lower than those with the minimal modulus HA joint, over the range of overlap length selected. The reduction in adhesive peak shear and peel stress tends is more significant for shorter overlap lengths. The reduction in adhesive peel stress, which mainly drives the failure of singe-lap bonded joints [30], is less significant than in adhesive shear stress.
Figure 24. Adhesive peak shear stress as a function of the overlap length for FGA and HA joints, according to 1D-beam ME (eaME=0 and fME=f) model.
0 5 10 15 20 25 30 35 40 45 50 10 20 30 40 50 60 70 80 90 100 m ax im al adh esi ve she ar str ess i n M P a overlap length in mm FGA
HA at Ga,max and Ea,max HA at Ga,min and Ea,min
40 Figure 25. Adhesive peak peel stress as a function of the overlap length for FGA and HA
joints, according to 1D-beam ME (eaME=0 and fME=f) model.
6. Conclusions
In this paper, a comparison between simplified and refined stress analyses of simply supported FGA single-lap balanced and unbalanced joints subjected to pure mechanical tensile in-plane loading or combined with thermal loading is presented. The simplified stress analyses are considered in the 1D-bar and 1D-beam framework. The ME technique is the resolution scheme used for the simplified stress analysis. The 1D ME models are then described in this paper including a convergence study, while the detailed mathematical derivation can be found in an already published paper [8]. It is indicated that the 1D-beam ME model allows for the simple consideration of various and classical local equilibriums [28-30] offering the consideration or not of the adhesive thickness on the local equilibrium bending equation and a possible approximation of geometrical nonlinearities. To assess the 1D ME models, 1D FE models and 3D FE models are presented, including convergence studies. The 1D FE models are very close to the hypotheses on which the 1D ME models are based, except
0 10 20 30 40 50 60 70 10 20 30 40 50 60 70 80 90 100 m axi m al ad h e si ve p e e l st re ss i n M Pa overlap length in mm FGA
HA at Ga,max and Ea,max HA at Ga,min and Ea,min
41 for the management of nonlinear geometries. Indeed, the 1D-beam ME model presented considers only a coupling between the normal forces and bending moments and neglects the 2nd order deformation. This approximation has the advantage to avoid any iterative resolution scheme. Two types of 3D models are employed. The first type models the adhesive layer as a cohesive zone, which has not geometrical thickness, while the second models model the adhesive layers with brick element. Finally, an application study of the 1D ME models is presented, consisting in the analysis of the influence of the overlap length on the adhesive peak stresses. The following conclusions can be made. Firstly, the 1D-bar ME model nearly provides the same predictions as the 1D-bar FE model: lower than 0.4% on the adhesive peak shear stress. The difference comes from the assignment strategy of the FGA modulus. Secondly, the 1D-beam ME models provide predictions close to 1D-beam FE models: lower than 4% and 8% on the adhesive peak shear and peel stresses respectively. The geometrical effect of the adhesive thickness and the geometrical nonlinearities cause an increase of absolute relative differences. Thirdly, compared to the predictions of 3D FE models, the 1D-beam ME models provide predictions lower than 8% on the adhesive peak shear stress and up to 17.5% for the adhesive peak peel stress. Once again, the geometrical effect of the adhesive thickness and the geometrical nonlinearities cause a significant increase of absolute relative differences on the adhesive peak peel stress. The use of beam FE models instead of 1D-beam ME models restricts the level of increase of absolute relative differences only; both 1D ME and FE models result in similar order of magnitude of absolute relative difference. However, the measured relative differences are representative for the some units of MPas. As a result, the simplified stress analyses could be used at the pre-sizing stage to perform early design, possibly based on comparative studies. Fourthly, it is shown that the increase of the overlap length reduce the adhesive peak stresses as for the HA joints. Moreover, there is a range of overlap lengths for which the adhesive peak stresses of FGA joints are smaller than
42 those minimal moduli HA joints. Finally, in the 1D-bar kinematics framework, there is an overlap length for which the adhesive peak shear stress is minimal.
Acknowledgement
This work has not received any specific grant.
Appendix A
This appendix provides the derivation of the constitutive equations of laminated beams used in the 1D-beam analysis, in the (X,Yj,Z) reference local axis of the adherend, the height origin
of which is taken on the neutral line. The normal force and the bending moment are written such as: 𝑁𝑗(𝑋) = ∫−ℎ+ℎ𝑗𝑗𝜎𝑗𝑏𝑑𝑌𝑗 = 𝑏 ∑ ∫ 𝜎𝑗𝑝𝑗𝑑𝑌𝑗 ℎ𝑝𝑗 ℎ𝑝𝑗−1 𝑛𝑗 𝑝𝑗=1 , 𝑗 = 1,2 (A-1) 𝑀𝑗(𝑋) = ∫−ℎ+ℎ𝑗𝑗−𝑌𝑗𝜎𝑗𝑏𝑑𝑌𝑗 = −𝑏 ∑ ∫ 𝜎𝑗𝑝𝑗𝑌𝑗𝑑𝑌𝑗 ℎ𝑝𝑗 ℎ𝑝𝑗−1 𝑛𝑗 𝑝𝑗=1 , 𝑗 = 1,2 (A-2)
where, in the adherend j nj is the number of layers and hpj is the final height of the pjth layer.
Moreover, the orthotopic behavior provides
𝜎𝑗𝑝𝑗 = 𝑄𝑗𝑝𝑗(𝜀𝑗𝑝𝑗− 𝛼𝑗𝑝𝑗Δ𝑇) , 𝑗 = 1,2 (A-3)
where, in the adherend j, 𝑄𝑗𝑝𝑗 is the matrix of reduced stiffness in the p
jth layer.
As a result, the normal force and the bending moment are given by: 𝑁𝑗(𝑋) = 𝑏 ∑ ∫ 𝑄𝑗𝑝𝑗(𝜀 𝑗𝑝𝑗− 𝛼𝑗𝑝𝑗Δ𝑇) 𝑑𝑌𝑗 ℎ𝑝𝑗 ℎ𝑝𝑗−1 𝑛𝑖 𝑝𝑗=1 , 𝑗 = 1,2 (A-4) 𝑀𝑗(𝑋) = −𝑏 ∑ ∫ 𝑄𝑗𝑝𝑗(𝜀 𝑗𝑝𝑗− 𝛼𝑗 𝑝𝑗 Δ𝑇) 𝑌𝑗𝑑𝑌𝑗 ℎ𝑝𝑗 ℎ𝑝𝑗−1 , 𝑛𝑗 𝑝𝑗=1 𝑗 = 1,2 (A-5)
43 𝑁𝑗(𝑋) = ∑ 𝑄𝑗𝑝𝑖𝑗[∫ 𝑑𝑌𝑗 ℎ𝑝𝑗 ℎ𝑝𝑗−1 ] 𝑛𝑗 𝑝𝑗=1 𝑑𝑢𝑗 𝑑𝑋 − 𝑏 ∑ 𝑄𝑗 𝑝𝑗[∫ 𝑌 𝑗𝑑𝑌𝑗 ℎ𝑝𝑗 ℎ𝑝𝑗−1 ] 𝑛𝑗 𝑝𝑗=1 𝑑𝜃𝑗 𝑑𝑋 − 𝑏 ∑ 𝑄𝑗𝑝𝑗𝛼 𝑗 𝑝𝑗[∫ 𝑑𝑌 𝑗 ℎ𝑝𝑗 ℎ𝑝𝑗−1 ] 𝑛𝑗 𝑝𝑗=1 Δ𝑇 (A-6) 𝑀𝑗(𝑋) = 𝑏 ∑ 𝑄𝑗𝑝𝑗[∫ 𝑌𝑗𝑑𝑌𝑗 ℎ𝑝𝑗 ℎ𝑝𝑗−1 ] 𝑛𝑗 𝑝𝑗=1 𝑑𝑢𝑗 𝑑𝑋 + 𝑏 ∑ 𝑄𝑗 𝑝𝑗[∫ 𝑌 𝑗2𝑑𝑌𝑗 ℎ𝑝𝑗 ℎ𝑝𝑗−1 ] 𝑛𝑗 𝑝𝑗=1 𝑑𝜃𝑗 𝑑𝑋 + ∑ 𝑄𝑗𝑝𝑗𝛼𝑗𝑝𝑗[∫ 𝑌𝑗𝑑𝑌𝑗 ℎ𝑝𝑗 ℎ𝑝𝑗−1 ] Δ𝑇 𝑛𝑗 𝑝𝑗=1 (A-7)
The stiffness parameters are thus defined such as for j=1,2: 𝐴𝑗 = 𝑏 ∑ 𝑄𝑗𝑝𝑗(ℎ 𝑝𝑗− ℎ𝑝𝑗−1) 𝑛𝑗 𝑝𝑗=1 (A-8) 𝐵𝑗 =𝑏2∑ 𝑄𝑗𝑝𝑗(ℎ 𝑝𝑗 2− ℎ 𝑝𝑗−1 2) 𝑛𝑗 𝑝𝑗=1 (A-9) 𝐷𝑗 = 𝑏3∑ 𝑄𝑗𝑝𝑗(ℎ𝑝𝑗 3− ℎ 𝑝𝑗−1 3) 𝑛𝑗 𝑝𝑗=1 (A-10) 𝑁𝑗𝑇̅ = 𝑏 ∑ 𝑄𝑗𝑝𝑗𝛼𝑗𝑝𝑗(ℎ𝑝𝑗 − ℎ𝑝𝑗−1) 𝑛𝑖 𝑝𝑗=1 Δ𝑇 (A-11) 𝑀𝑗𝑇̅ =𝑏2∑ 𝑄𝑗𝑝𝑗𝛼𝑗𝑝𝑗(ℎ𝑝𝑗 2− ℎ 𝑝𝑗−1 2) 𝑛𝑗 𝑝𝑗=1 Δ𝑇 (A-12) Appendix B
This appendix provide the tables relating to the predicted adhesive peak stresses and their relative differences between the 1D-bar ME model and the 1D-bar FE model (Table B-1), between the 1D-beam ME models and 1D-beam FE models (Table B-2) and between the 1D-beam ME and FE models and the 3D FE models (Table B-3).
Table B-1. Adhesive peak shear stresses and difference of 1D-bar ME model prediction relatively to 1D-bar FE model predictions.