Any correspondence concerning this service should be sent to the repository administrator: [email protected]
This is an author’s version published in: http://oatao.univ-toulouse.fr/27015
To cite this version: Beda, Adrian and Villevieille, Claire and Taberna, Pierre-Louis and Simon, Patrice and Matei Ghimbeu, Camélia Self-supported binder-free hard carbon electrodes for
sodium-ion batteries: insights into their sodium storage
mechanisms. (2020) Journal of Materials Chemistry A, 8 (11).
5558-5571. ISSN 2050-7488
Official URL
DOI : https://doi.org/10.1039/C9TA13189B
Open Archive Toulouse Archive Ouverte
OATAO is an open access repository that collects the work of Toulouse researchers and makes it freely available over the web where possible
Self-Supported Binder-Free Hard Carbon Electrodes for Sodium-Ion
Batteries: Insights into the Sodium Storage Mechanisms
Adrian Beda 1,2, Claire Villevieille 3, Pierre-Louis Taberna 4,5, Patrice Simon 4,5, Camélia
Matei Ghimbeu 1,2,5,*
1Université de Haute-Alsace, CNRS, Institut de Science des Matériaux de Mulhouse (IS2M)
UMR 7361, F-68100 Mulhouse, France
2Université de Strasbourg, F-67081 Strasbourg, France
3University Grenoble-Alpes, University Savoie Mont-Blanc, Grenoble INP, LEPMI
Laboratory, 1130 rue de la piscine, 38402 Saint Martin d’Hères, France
4Université de Toulouse, CIRIMAT, UMR-CNRS 5085, F-31062 Toulouse, France
5Réseau sur le Stockage Electrochimique de l’Energie (RS2E), FR CNRS 3459, 80039 Amiens
Cedex, France
Corresponding author:
ABSTRACT
Hard carbons are one of the most promising negative electrode materials for sodium-ion batteries (NIBs). In contrast to most of the published works employing powder-like electrodes containing binders, additives and solvents, we report herein an innovative way to prepare binder-free electrodes by simple impregnation of cellulose and cotton filter papers with a phenolic resin solution. The latter enables improvement of the poor mechanical properties and thermal stability observed for pristine hard carbon self-standing electrodes (SSEs) along with the carbon yield. A high reversible specific capacity and long-term stability were observed for cellulose compared to those of cotton-based SSEs in NIBs, i.e., 240 mAh·g-1 vs. 140 mAh·g-1, respectively, for C/10 rate and high mass loading (~5.2 mg·cm-2). This could be ascribed to the larger amount of defects on cellulose than cotton as quantified by temperature programmed desorption coupled with mass-spectrometry (TPD-MS), the structure and porosity being similar for both materials. Furthermore, the addition of a conductive sputter coating on the cellulose SSE surface improved the reversible specific capacity (to ~300 mAh·g-1) and initial coulombic efficiency (ICE) (to 85%). Operando X-ray diffraction (XRD) was performed to provide additional insights on the Na storage mechanisms. Although no shift was noticed for the graphite (002) diffraction peak, clear evidence of sodium intercalation was observed in the plateau region appearance of a new diffraction peak (~28.0° 2θ) likely associated with a sodium intercalation compound.Consequently, the sloping region could be related to the Na+ adsorption on hard carbon defects and pores.
Keywords: hard carbon; self-supported electrode; binder-free; Na-ion batteries; storage
1. Introduction
Sodium-ion batteries (NIBs) are currently receiving substantial attention as an alternative to lithium-ion batteries due to the limited lithium availability, the inhomogeneous distribution of lithium resources over the world, the high price of these batteries, etc. 1. Compared to lithium, sodium is approximately a thousand times more abundant, which means that it is less expensive, and it is more environmentally friendly than Li 2. In particular, NIBs could fulfill sustainability and cost-effectiveness requirements for large-scale stationary energy storage systems. However, designing low-cost electrode materials (cathodes or anodes) with high energy density is still a key challenge that limits NIB commercialization 2. Among the different materials explored as anodes for NIBs (e.g., transition metal oxides 3, carbon-based materials 4, intermetallics 5 and organic compounds 6), hard carbon materials are particularly interesting mainly due to their appropriate specific capacity (up to ~300 mAh·g-1 with low loading) and low operating voltage (~ 0 V vs. Na+/Na) 7. Although other anode materials might offer better electrochemical performance at the laboratory scale, carbon materials are difficult to compete with in terms of cost, efficiency, toxicity and feasibility in a commercial cell. In addition, the use of alloying and conversion anodes can cause several issues, such as high average voltage, large volume expansion and low initial coulombic efficiency (ICE) 8. Therefore, such anodes are unlikely to be part of first generation sodium cells, and lithium-ion batteries (LIBs) could confirm this trend because they are still using graphite anodes after 30 years of commercialization. The layered structure of graphite materials, which is extensively used in LIBs, has been proven to be inaccessible for Na ions due to the weaker binding energy of Na+ to the graphite surface, larger radius and higher
weight of Na than Li ions. In contrast, hard carbon materials do not exhibit an organized structure but develop in distinct microstructural states. This unique structure, described by Dahn and his team 9 as a “falling cards model”, is able to incorporate sodium and deliver good
electrochemical performance.
For anode materials, organic/inorganic powders are usually mixed with polymer binders at different ratios to improve the mechanical stability of the electrode. The extensive use of polyvinylidene fluoride (PVDF) raises environmental concerns due to the organic solvents used to dissolve it (e.g., N-methyl-2-pyrrolidone (NMP), which is toxic and volatile
10). On the other hand, the processing of Na-carboxymethylcellulose (Na-CMC), which is
by side reactions (e.g., oxidation of Na+ and electrolyte decomposition). Another important
aspect to consider when preparing electrodes is their integrity, which affects their long-term cyclability. In this regard, a polymeric binder facilitates the adhesion between the anode and current collector 11. However, the casting method (slurry on Al/Cu foil) makes NIBs rigid, thick, bulky and heavy 12. Moreover, this process may hinder ionic diffusion by blocking some of the pores and decreasing the electronic conductivity, since the binder is an inactive and insulating material. As a result, the cycling stability might decrease at fast cycling rates 13. Therefore, the traditional slurry-casting method must be revised to improve the battery performance.
An alternative approach to solve these pre-cited issues is to prepare binder-free electrodes, which are so-called self-supported electrodes (SSEs). In contrast to conventional electrodes, SSEs use binder- and solvent-free active materials, resulting in a decreased dead weight and toxicity level and improved conductivity 14. Moreover, SSEs could also be used without a current collector, thus decreasing the battery weight and cost further.
Cellulose and cotton are two of the most abundant and renewable resources on Earth. While cotton can be found in nature as a soft fiber (cotton plants), cellulose is not a stand-alone product (e.g., the chemical composition of cotton consists of approximately 90% cellulose). Such availability makes them attractive as precursors for hard carbon preparation, and self-supported films can be readily designed in a variety of shapes (e.g., paper, fibers, powder, and filters). However, when thermally treated at high temperatures (>1000°C), a low carbon yield and low mechanical stability are usually observed 15–18, which may explain why there are a very limited number of publications on hard carbon SSEs derived from cellulose/cotton or other sources for SIBs.
Because SSEs are binder- and conductive additive-free materials, they are suitable for studying the intrinsic sodium storage mechanisms in hard carbon. Although it is widely accepted that the storage mechanisms involve several processes, such as adsorption through pores, intercalation between graphene layers and Na+ interaction with carbon
defects/functional groups 19–21, assigning a particular process to a certain potential range on
the galvanostatic curve is still controversial. Stevens and Dahn 22 first proposed in the 2000s
that the high voltage slope region (> 0.1 V) corresponds to the insertion of Na between the graphene sheets, while the low voltage plateau (below 0.1 V Na+/Na) corresponds to Na pore
filling. This mechanism was supported by subsequent studies 23,24 and accepted for one
decade. Recent studies, however, proposed an opposite mechanism where the sloping potential region is correlated to pore filling, while the low-potential plateau is attributed to
Na+ intercalation between graphene-like layers 25–29. Moreover, the importance of defects,
heteroatoms and functional groups in the sloping region was emphasized 28–31. The discrepancy between reported mechanisms is due to the complex structure of hard carbons, leading to data that is obtained by different characterization techniques (X-ray diffraction (XRD), small-angle X-ray scattering (SAXS), Raman spectroscopy and nuclear magnetic resonance (NMR) spectroscopy) being difficult to interpret. Therefore, in-depth investigation of Na-ion mechanism insertion in hard carbon to propose a general storage mechanism is still highly encouraged. In this regard, SSEs can be considered ideal candidates since they do not contain binders and graphitic-based additives, which may contribute to signals during data collection and indirectly to the performance of the hard carbon.
Therefore, in this paper, we report a simple way to prepare high-performance self-standing carbon-based anode materials for NIBs derived from cellulose and cotton that is impregnated with phenolic resin. Those materials could achieve a specific capacity as high as 320 mAh·g-1 (at C/10 rate) along with a high initial CE of 82% with loading higher than 5 mg·cm-2. The delivered specific capacity could be further increased to 355 mAh·g-1 together with 85% initial coulombic efficiency (ICE) by designing an ultrathin coating of electrically conducting metal on the hard carbon surface of the SSEs. The Na storage mechanism was also studied by operando XRD, and the results revealed the appearance of a diffraction peak in the low voltage plateau assigned to Na intercalation compounds. Since no shift on the (002) peak was observed at high voltage (> 0.1 V), the newly formed peak was attributed to the insertion of Na in the carbon structure in the plateau region, while the carbon porosity and defect sites could be more likely associated with the sloping region. These results support the Na “adsorption-intercalation” mechanism in hard carbon.
2. Material and methods
Materials synthesis: Phloroglucinol (1,3,5-benzenetriol, C6H6O3) and glyoxylic acid
monohydrate (C2H2O3·H2O) were purchased from Sigma-Aldrich and used as-received
without any further purification. Ethanol (C2H6O) was used as the solvent. The filter papers
were procured from Carl Roth, Millipore (cellulose-based called FP-A, FP-B and FP-C, depending on their type) and Whatman (cotton-based, named FP-D). Table S1 resumes the filter paper characteristics and their commercial names. When directly carbonized, the FPs show poor mechanical stability and low carbon yield; therefore, a strategy to overcome these issues was developed. This novel synthesis of self-supported binder-free electrodes involves two main steps: filter paper impregnation with phenolic resin and thermal treatment at high
temperature. First, an eco-friendly phenolic resin solution was obtained by dissolution of phloroglucinol (0.82 g) and glyoxylic acid (0.9 g) in ethanol (10 mL) according to our previous work 32 and aged for 1 h to increase its polymerization and viscosity degree. The FPs
were punched at desired sizes (~ 2 cm2) and immersed in the phenolic resin for approximately 2 min and then dried overnight in the oven at 80°C. The drying step induced the polymerization of the resin and thus further increased the crosslinking degree. Further, the impregnated films were covered by an alumina plate to avoid bending during the thermal treatment at 1300°C in an inert atmosphere (Ar, 15 L h-1) for 1 h. The as-obtained hard carbon SSEs were denoted as HC-A, HC-B, HC-C and HC-D. The overall synthesis process is illustrated in Scheme 1 while the imaged of obtained materials are provided in Figure S1 (Supporting Information). Some of the materials were used as electrodes for Na-ion batteries in half cells, while some of the electrodes were sputtered with a thin layer of gold before electrochemical testing, using a 108 Auto Cressington Sputter Coater.
Material characterization: Wetting measurements were performed with the contact angle method to evaluate the hydrophobic/hydrophilic character of the FPs and thus to determine their affinity for phenolic resin uptake. A Krüss drop shape analyzer DSA 100 was used to study the static contact angle by placing a droplet of solvent on the material surface, while a camera evaluated the contact angle. Thermogravimetric analysis (TGA) was performed to study the mass loss and impregnation process by heating the materials to 900°C at 5℃ min-1 under N2 atmosphere (Mettler-Toledo TGA 851e). The morphology/structure of the hard
carbon materials was studied by high-resolution transmission electron microscopy (HRTEM) with a JEOL ARM-200F model instrument operating at 200 kV. Scanning electron microscopy (SEM) measurements were performed with a FEI Quanta 400 scanning electron microscope with a high-resolution low vacuum field emission gun (FEG). The cotton and cellulose filter paper samples (before carbonization) were all gold sputter-coated prior to SEM evaluation to compensate for their lack of conductivity, which is an essential feature required to obtain SEM images. The structure of carbon materials was studied by Raman spectroscopy and X-ray diffraction (XRD). Raman measurements were performed at room temperature using a LabRAM BX40 (Horiba Jobin-Yvon) spectrometer equipped with a He-Ne excitation source (532 nm wavelength). XRD analysis was performed using a Bruker D8 Advanced diffractometer with flat-plate Bragg-Brentano θ-θ geometry. Textural properties of the hard carbon SSEs were investigated with a Micromeritics ASAP 2420 machine using N2 gas as
adsorbate (77K) and a Micromeritics ASAP 2020 instrument using CO2 adsorbate (273 K).
port and for another 2 h on the analysis port. The Brunauer-Emmett-Teller (BET) specific surface area (SSA) was determined from the linear plot in the relative pressure range 0.05-0.3, while the pore size distribution (PSD) was calculated from N2 adsorption isotherms using the
nonlocal density functional theory (NLDFT) standard slit model for carbon materials carried out by SAIEUS software. XPS was used to determine the chemical composition, the nature and amount of functional groups along with the presence of impurities in the range 200-1200 eV by using a VG Scienta SES 2002 spectrometer equipped with a monochromatic X-ray source (Al Kα=1486.6 eV) and a G Scienta XM780 monochromator. Temperature-programmed desorption (TPD) analysis was used to determine the nature and amount of oxygen-based functional groups present in the materials and to quantify the amount of active sites (ASA). Thus, the measurements were performed in a vacuum system equipped with a mass spectrometer (MS) that was constructed in the laboratory 33. The samples were heat treated up to 950°C at a heating rate of 5°C min-1. The gases released were quantitatively analyzed during the experiment by the mass spectrometer. Prior to the analysis, the mass spectrometer was calibrated using several gases usually desorbed from the carbon surface, i.e., H2, H2O, CO, N2, O2 and CO2. Prior to each TPD analysis, a N2 sensibility measurement
was performed, which allowed further quantification of the other gases. To determine the number of defects and the ASA, the materials were exposed to oxygen introduced at 300°C (oxygen pressure: 66.5 Pa), which was subsequently chemisorbed for 10 h to form surface oxygenated complexes. A second TPD was performed at 950°C with a 10°C/min heating rate to determine the amount of oxygenated groups and finally the ASA.
Electrochemical testing: The SSEs with a mass loading of approximately 5 mg·cm-2 (~12 mm
diameter) were first dried at 80°C under vacuum before testing. The cells were assembled in an argon-filled glove box using sodium metal prepared as a counter/reference electrode as follows 34. A glass fiber separator was used and the electrolyte consisted of 1 M NaPF
6
dissolved in ethylene carbonate (EC)/ diethyl carbonate (DEC) with a 1:1 volume ratio. Electrochemical performance were measured using an ASTROL cycling device. Galvanostatic charge-discharge tests were conducted at a constant current in a voltage window between 0.01 and 1.2 V (versus Na+/Na) at C/10 and C/5 rates (the theoretical
specific capacity was considered 372 mAh·g-1). At the end of each discharge and charge
cycle, potentiostatic steps with a duration of 1 h were added. All experiments were conducted at room temperature. In the text, all the potentials are expressed relative to Na metal (vs. Na+/Na).
Operando XRD: Operando measurements were performed using an in situ cell constructed in the laboratory with a beryllium window in Bragg-Brentano geometry 35 using the SSEs. Currents similar to those described in the above section were applied. Each pattern was acquired for 1 h from 20° to 55° with a step size of 0.0334°.
3. Results and discussion
The eco-friendly and facile method developed herein to prepare binder-free self-standing hard carbon electrodes is presented in Scheme 1. Cellulose and cotton-based filter papers (FPs) are immersed in a phenolic resin solution composed of phloroglucinol and glyoxylic acid dissolved in ethanol. After impregnation, the FPs are dried at low temperature (80°C) to induce polymerization of the resin prior to thermal treatment at 1300°C. The synthesis procedure is described in detail in the experimental section.
Scheme 1. Synthesis procedure used to prepare hard carbon (HC) SSEs using FPs
impregnated with phenolic resin, thermopolymerized (TP) at 80°C and thermally treated (TT) at 1300°C.
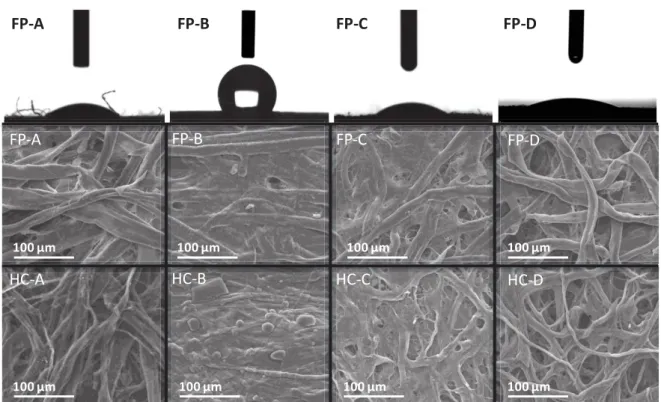
Various types of filter paper based on cellulose (FP-A, FP-B, FP-C) and cotton (FP-D) were used to prepare the hard carbon (HC) SSEs, denoted HC-A, HC-B, HC-C and HC-D, respectively. The physical properties of the filter paper materials (pore size and thickness) are listed in Table S1 (Supporting Information). The FP-B and FP-C materials exhibit the smallest pore size (1.2 and 2.5 μm), followed by FP-A (~ 15 μm) and cotton-based FP-D with a pore size of 22 μm. Concerning material thickness among the samples, FP-B has the lowest value (0.082 mm), while the other three FPs have a similar thickness of approximately 0.2 mm.
SEM images of the FPs (Figure 1, middle) show a fiber network that was randomly oriented with diameters between 10-20 μm and a macroporous structure. FP-B and FP-C look denser than the other filter papers, in line with the smaller pore size information provided by the producer. During the thermal treatment, the fibrous structure is maintained, but the fiber diameter shrinks to 5-10 μm. Such a fibrous open network should favor the electronic
TP 80oC TT 1300oC FP Phenolic resin Mechanical pressing Self-sustained HC electrodes Phenolic resin Cellulose Cotton FP impregnated Impregnation
conductivity of the material as well as enable Na pathways and electrolyte transport and thus improve the electrochemical performance.
Figure 1. (top) Wettability measurements of the different filter papers based on cellulose
(FP-A, FP-B, FP-C) and cotton (FP-D); SEM images of pristine filter paper (middle) and hard carbon SSEs obtained by impregnated filter papers annealed at 1300°C (bottom).
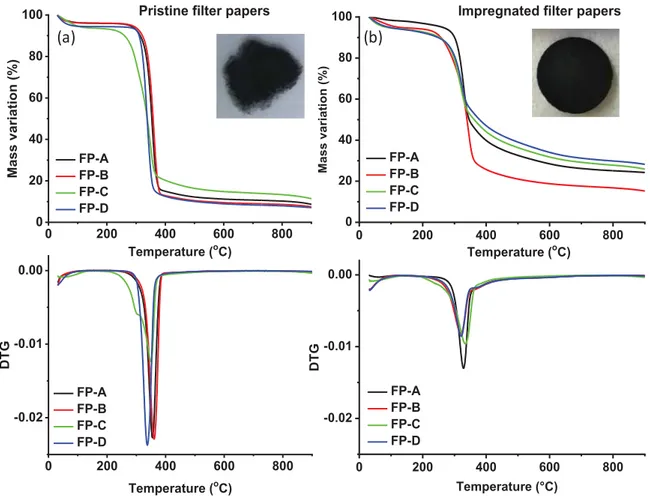
Figure 2 shows the results of the thermal stability of the materials, before and after impregnation with phenolic resin, using thermal gravimetric analysis (TGA) and derivative thermogravimetric (DTG) measurements up to 900°C under a N2 atmosphere. Without
impregnation (Figure 2a), the FPs exhibits an initial weight loss of 5 to 8 wt.% corresponding to moisture removal that occurs below 150°C and a significant mass loss (approximately 80 wt.%) in the temperature which takes place in the range of 300-400°C. This loss, clearly emphasized by the DTG results through the presence of intense and sharp peaks at approximately 350°C, is attributed to the decomposition of α-cellulose, which is the main constituent of both precursors 36. Finally, the thermal decomposition leads for all pristine FPs to a low carbon yield of approximately 10 wt.%. Moreover, important to observe that after pyrolysis at 1300°C the hard carbon obtained are completely disintegrated (in-set Figure 2a), reason why the impregnation with the phenolic resin have been proposed herein to overcome such inconvenient. We can see, therefore, that for the FPs impregnated with phenolic resin, the carbon yield percent improves significantly, i.e., approximately 27 wt.% for C and FP-A, slightly higher than that for FP-D (30 wt.%), while for sample FP-B, the mass loss is more
FP-A FP-B FP-C FP-D FP-C FP-D FP-B FP-A 100 μm 100 μm 100 μm 100 μm HC-C HC-D HC-B HC-A 100 μm 100 μm 100 μm 100 μm HC B
significant, leading to lower yield of 18 wt.%. Consequently, the impregnation process is a key step that increases the carbon yield up to three times. It is important to mention that this step is crucial to improve the mechanical stability and the integrity of the electrodes as can be seen in the in-set of Figure 2b showing well preserved hard carbon electrodes after the pyrolysis step of the impregnated filter papers.
Figure 2: TGA/DTG curves recorded in inert atmosphere of different filter papers (a) before
and (b) after their impregnation with phenolic resin. In-set: images of the resulting hard carbon self-sustained electrodes after pyrolysis in the oven at 1300°C.
A possible explanation for the different behavior of the samples before and after impregnation could be related to the affinity of the material for the phenolic resin. To check the impregnation process, wettability (contact angle) measurements were performed, which provide information on the hydrophobicity or hydrophilicity of a substrate (Figure 1, top). There is an obvious difference between FP-B (which gave the lowest carbon yield among the samples) and the other three samples, the former exhibiting a contact angle of approximately 120°, while the other materials instantaneously absorb the water droplet, as shown by the images taken at the exact moment when the drop makes contact with the surface. The
0 200 400 600 800 0 20 40 60 80 100 FP-A FP-B FP-C FP-D M as s vari ati on ( %) Temperature (oC) FP-A FP-B FP-C FP-D FP-A FP-B FP-C FP-D FP-A FP-B FP-C FP-D Temperature (oC) 0 200 400 600 800 0 20 40 60 80
100 Impregnated filter papers
M ass var iati o n (%)
Pristine filter papers
0 200 400 600 800 -0.02 -0.01 0.00 D TG Temperature (oC) 0 200 400 600 800 -0.02 -0.01 0.00 D T G Temperature (°C) (a) (b)
hydrophobic character of FP-B could be caused by several factors: the pore size (1.2 μm), packing density and surface chemistry. If the porosity is large enough to diffuse water, a local high packing density could block the water diffusion on the first layer.
However, the surface chemistry might play a role in conferring
hydrophobic/hydrophilic characteristics; thus, we obtained more information on surface chemistry by performing energy-dispersive X-ray spectroscopy (EDX) (Table S2, Supporting Information). The results revealed metal-based impurities only in the FP-B material structure. These limiting factors could result in poor impregnation with the phenolic resin, which further explains the decreased yield observed.
Further, we cannot differentiate between the other three materials because the drop adsorption takes place very quickly due to the open porosity. Considering these findings, FP-B does not represent an efficient choice in terms of yield to prepare SSEs.
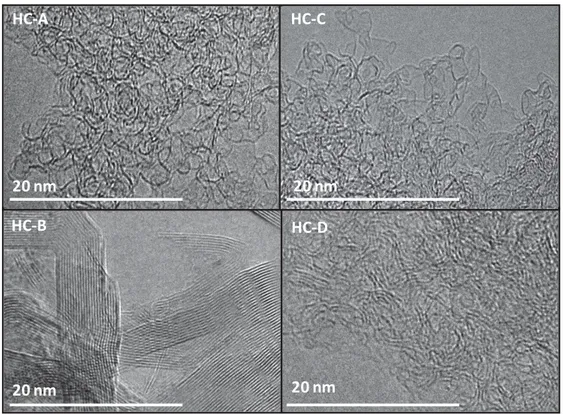
Figure 3. Transmission electron microscopy images of hard carbon SSEs derived from
carbonized FPs: HC-A, HC-B, HC-C, and HC-D.
Figure 3 shows the TEM images of the hard carbon SSEs impregnated with the phenolic resin. The HC-A, HC-C and HC-D samples have a highly disordered structure containing turbostratic domains, characteristic of hard carbon materials, as first described by Dahn and coworkers 9. Moreover, the cotton sample (HC-D) shows local short-range clusters of graphene layers, which are not observed for the two cellulose FPs (HC-A and HC-C).
HC-A HC-C
HC-B HC-D
20 nm
20 nm 20 nm
The HC-B sample shows a different structure from the others, with a high degree of graphitization and large graphitic crystals containing 20-35 graphene layers. However, the structure is not completely graphitized, and the specific disordered structure of hard carbons could still be observed in different areas of the material. This high graphitization degree is assumed to originate from the interaction of metallic impurities (between 7 and 13 wt.%, as revealed by EDX, Table S2) with carbon at higher temperatures, which catalyzes the amorphous carbon and converts it into graphite 37. The presence of graphite is not favorable for Na storage due to the limited interlayer space, and impurities could favor parasitic electrochemical reactions, thus affecting the electrochemical performance.
These results suggest that the HC-B sample may not be appropriate for NIB applications due to the low carbon yield, low mechanical stability and presence of impurities/graphitized structure. In the case of sample HC-A, although less pronounced than sample HC-B, mechanical issues were also noticed during the manipulation, such SSEs breaking. Additionally, when several cells were closed and then re-opened to check the mechanical stability of the materials, SSE breaking was observed, this being related to the lower carbon yield as well as to the diffrent morphology showing rather unwoven fibers in this case (Fig. 1). Therefore, the initial filter paper properties (composition, surface chemistry and morphology) are important parameters to be taken into consideration for optimal hard carbon electrodes preparation. All these technical aspects directed our choice for sample HC-C and HHC-C-D to be more analysed and tested in the Na-ion batteries. Moreover, since the mass loading is closely related to the filter thickness, the similar thinkness of HC-C of the HC-D samples (0.195 mm for HC-C vs. 0.185 mm for HC-D), allows also to fairly compare those two different precursors.
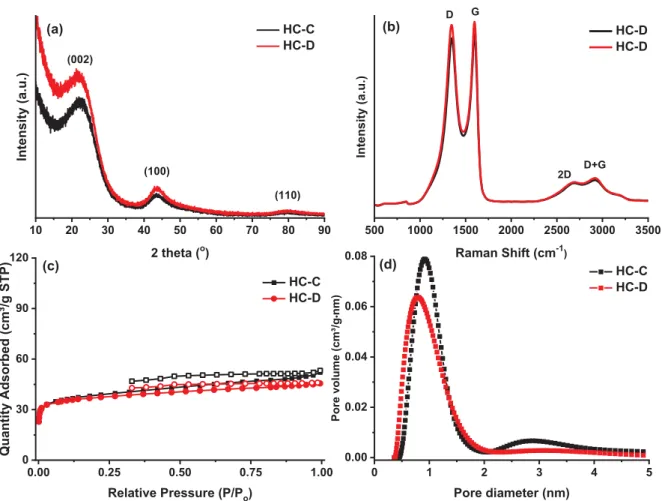
The SSE structure was investigated by XRD and Raman spectroscopy, and the results are presented in Figure 4a and b. The XRD spectra show the typical signature of hard carbon materials with the characteristic diffraction peaks corresponding to the (002), (100) and (110) planes of graphite located at a 2θ values of 22°, 43.5°and 80°, respectively. The d-spacing (interlayer spacing, d002) of the two materials was determined using Bragg`s law for the (002)
planes. Both samples have a high d-spacing (4.1 Å for HC-D vs. 4.0 Å for HC-C) compared to that of graphite (3.4 Å), which should be favorable for Na intercalation in the graphene layers. Moreover, the low-intensity and broad shape of the peaks confirm the disordered-like structure of the materials. Raman spectra show two intense and distinct bands corresponding to a defect-induced D-band at approximately 1350 cm-1 and the crystalline graphite G band at 1600 cm-1. The ratio between the intensities of the D and G bands was calculated to determine
the disorder degree. The values that were obtained, namely, 1.9 for HC-D and 1.8 for HC-C, confirm the TEM results. In the 2500-3000 cm-1 region, two additional low-intensity and broad peaks can be identified. The first one corresponds to 2D band, which is characteristic of bulk graphite and is therefore related to the degree of graphitization in the material, and a second band (D+G), which is related to the presence of defects.
Figure 4. Characterization of the selected cellulose (black trace) and cotton (red trace)-based
hard carbon SSEs: a) XRD spectra, b) Raman spectra, c) N2 adsorption-desorption isotherms,
and d) NLDFT pore size distribution.
The N2 adsorption-desorption isotherms (Figure 4c) are characteristic of nonporous
materials; a similar BET surface area was obtained for both samples, and a slightly higher value for the HC-C material than that of the HC-D material (119 vs. 113 m2·g-1, respectively). The pore size distribution revealed that the two materials contained mainly micropores (Figure 4d), with a pore diameter of 1 nm on average. Additionally, adsorption measurements using CO2 as a gas probe were performed as advised elsewhere 29, and the results confirm a
higher specific surface area (SSA) for HC-C than that of HC-D (492 m2·g-1 vs. 386 m2·g-1,
10 20 30 40 50 60 70 80 90 HC-C HC-D Intensity (a. u.) 2 theta (o) D G (100) (110) (a) (b) (c) (d) 500 1000 1500 2000 2500 3000 3500 HC-D HC-D Intens ity (a .u.) Raman Shift (cm-1) 2D D+G 0.00 0.25 0.50 0.75 1.00 0 30 60 90 120 HC-C HC-D Quantity Adsor bed (cm³/g STP ) Relative Pressure (P/Po) 0 1 2 3 4 5 0.00 0.02 0.04 0.06 0.08 HC-C HC-D P ore volume (cm³ /g • nm) Pore diameter (nm) (002)
respectively, as shown in Table 1). Worth to remark that the obtained values by CO2
adsorption are much higher than those obtained with N2, implying the existence of smaller
pores that are not accessible for N2. Indeed, the PSD for both materials indicated a substantial
amount of ultramicropores with pore sizes centered at ~0.4 nm for C and ~0.6 nm for HC-D (Figure S2, Supporting Information).
Table 1. Hard carbon SSE characteristics, including SSA, interlayer distance (d002), disorder
degree (ID/IG), structural defects (ASA), oxygen surface groups (COx) and oxygen-to-carbon
ratio. Sample Name N2 SSA m2 g-1 CO2 SSA m2 g-1 d002a Å ID/IGb ASAc m2 g-1 COxc mmol g-1 O/Cd HC-C 119 493 4.0 1.83 15.5 0.77 0.030 HC-D 113 386 4.1 1.90 9.4 0.66 0.017
a-determined by XRD; b-determined by Raman spectroscopy; c-obtained by TPD-MS and d- calculated by X-ray photoelectron spectroscopy (XPS).
To gain more insight into the material structure and porosity, cross-sectional views of the samples were evaluated (Figure S3, Supporting Information). Both HC-C and HC-D materials show a layered-like structure with well-developed porosity (pore sizes of few micrometers); the HC-C material is less porous and denser than HC-D. The measured thickness of the SSEs from SEM cross sections using ImageJ software was found to be 66 μm (HC-C) and 87 μm (HC-D). The higher thickness of the HC-D electrode could be correlated to the higher filter paper pore size, which allows for better impregnation with phenolic resin (since the initial thickness of FP-D is lower than that of FP-C).
Functional groups in the SSEs were analyzed by both XPS (surface groups) and temperature-programmed desorption coupled with mass spectrometry (TPD-MS, bulk technique). The HC-C and HC-D compositions of 97.7 and 96.6 at. % C and 2.9 and 1.7 at. % O, respectively, were determined based on wide XPS peaks (Table S3, SI). The oxygen-to-carbon ratio is lower for sample HC-D (0.017) than that of HC-C (0.030), indicating that a relatively significant number of oxygenated functional groups are still present for HC-C after thermal treatment at high temperature. The high-resolution C1s spectra of the materials are shown in Figure 5 a and b, while Table S3 (Supporting Information) gives the quantitative analyses of the components. Both samples exhibit an intense and sharp peak at 284.3 eV attributed to sp2 graphitic carbon, which is the main phase for both materials, i.e.,
approximately 91 at.% for HC-C and approximately 94 at.% for HC-D material, respectively. Further, sp3 carbon was identified at 285 eV only for HC-C (approximately 3%). Low-intensity signals at high binding energies were observed for both samples due to the presence of COOR, C-OR and C=O oxygen functional groups 38.
Figure 5. XPS C1s high-resolution deconvoluted spectra of (a) HC-C, (b) HC-D SSEs, (c)
TPD-MS desorption profiles (dot line: HC-C and full line: HC-D) and (d) active surface area of HC-C and HC-D SSEs. Comparison of ASA values of SSEs with reported values for cellulose (HC-cellulose) 29 and phenolic resin (HC-Ph. Resin) 32 derived hard carbons.
TPD-MS measurements were further performed on the samples. Thus, the hard carbon SSEs were heat treated under vacuum, and the evolved species were monitored by a mass spectrometer. The oxygen functional groups present on the carbon surface decompose in CO and CO2 during the heating process (Figure 5c), and their release temperature indicates the
composition of the initial oxygen functional groups present in the materials. At low temperature, CO2 desorbs as a result of carboxylic and lactone groups decomposition, but
0 200 400 600 800 1000 0.00 0.05 0.10 0.15 0.20 0.25 De so rption rate ( µmol/s/g) Temperature (°C) CO CO2 294 292 290 288 286 284 282 280 C P S
Binding Energy (eV)
Csp2 COOR C=O C-ORCsp3 Sat 2Sat 1 294 292 290 288 286 284 282 280 C P S
Binding Energy (eV)
Csp2 COOR C=O C-OR Sat 2Sat 1 (a) (b) 290 288 286 284
Binding Energy (eV) COOR C=O C-OR Sat 2 Sat 1 290 288 286 284
Binding Energy (eV) COOR C=O C-OR Csp3 Sat 1 Phenol Carbonyl Quinone Carboxylic acid Lactone Anhydride Ether HC-C HC-D HC-Cellulose HC-Ph. Resin 0 4 8 12 16 20 ASA ( m 2 g -1) Hard Carbons (c) (d)
during an increase in the temperature, anhydride decomposition produces CO2 along with CO
(350-600°C) 29. At temperatures higher than 400°C, CO is the main gas desorbed as the acidic and basic groups decomposes (phenol, quinones, and ethers) 33. The latter groups are observed
clearly in the HC-C sample, which has a very intense CO peak (Figure 5). This translates to a larger amount of oxygen-based functional groups of 0.77 mmol·g-1 for HC-C than that for HC-D (0.66 mmol·g-1), which is consistent with the XPS results. Considering this information, we conclude that both materials present significant surface functionality (COx),
which could impact the electrochemical performance.
Additionally, the structural defects (active sites) that determine the active surface area (ASA) were quantified by TPD-MS (Figure 5d). This parameter is important in the context of NIBs and is involved in the storage mechanism (slope capacity), as shown previously 29. The amount of active sites was determined by quantifying the amount of oxygen complexes (CO and CO2 groups) formed at the surface of the carbon material when oxygen chemisorption at
300°C was performed after vacuum cleaning of the carbon surface during the TPD-MS experiment. The results presented in Table 1 show a higher ASA value for HC-C (15.5 m2·g-1) than that for HC-D (9.4 m2·g-1), which means that more active sites/defects are present on the surface of HC-C material. If the obtained values are compared to those reported for cellulose
29 32and phenolic resin 32 hard carbons prepared at the same temperature (1300°C), it can be
seen that the HC-C active surface area is the highest one. This may be related to its much higher ultramicroporosity as revealed by CO2 adsorption (Table 1). Although it was clearly
noted that the ASA is involved in the storage mechanisms, it is not yet clear what would be the optimal range of active sites to avoid contributing to an irreversible capacity, as shown in the very similar lithium-ion batteries 39,40.
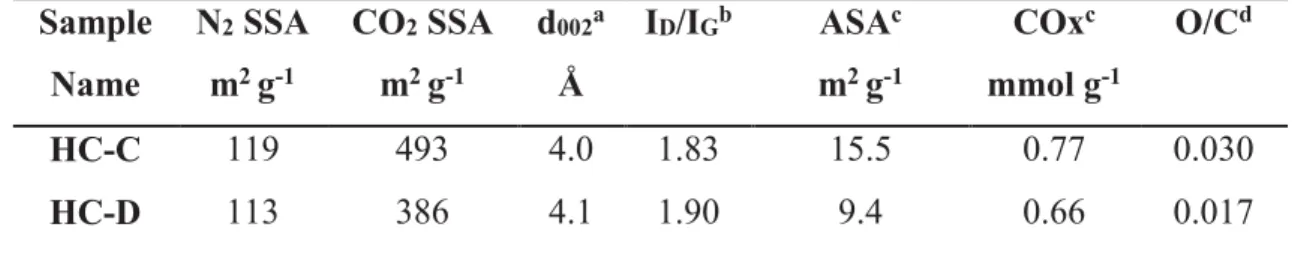
At this point we can conclude that the two selected self-sustained electrodes present interesting features which are compatible with sodium storage applications. Although, the materials structure and texture are rather similar, the surface functional groups and the amount of structural defects are different and could be used to discriminate between the samples. Therefore, the two SSEs were investigated as anode materials for SIBs using the constant current, constant voltage protocol (CCCV) at a C/10 rate for 5 cycles followed by cycles at a C/5 rate. The results are presented in Figure 6a and b.
A sloping region can be observed at high voltage (down to ~ 0.07 V) followed by a potential plateau below 0.07 V, in agreement with the electrochemical signature of hard carbons 8,22,29. Additionally, during the first sodiation, a broad and low-intensity shoulder can be observed between 0.8 V and ~0.4 V, attributed to the formation of the solid electrolyte
interfase (SEI) 41. As expected, this shoulder disappears after subsequent cycles. During
cycling, we can see two different behaviors. On one hand, we have the HC-C sample where specific capacity is gained from the sloping region as well as the low-potential plateau (even if it is short).
On the other hand, the HC-D sample where the specific capacity is primarily gained from the sloping region. At this stage and due to the poor electronic conductivity of the samples, we cannot claim that the reaction mechanism is different for these two carbons. However, it seems that more specific capacity is gained in the sloping region for the HC-C than for HC-D samples which can be attributed to the micropores being more favorable in the HC-C sample than in the HC-D sample but also to the larger amount of defects in HC-C sample.
Figure 6. Cycling profiles of pristine samples: a) HC-C and b) HC-D, cycled at C/10
followed by C/5. Cycling profiles of SSEs coated by gold sputtering: c) HC-C and d) HC-D, cycled at C/10 followed by C/5.
During the first cycle, an initial irreversible capacity is observed for both materials, accounting for 17% and 36.5% of the initial discharge capacity for HC-C and HC-D,
0 50 100 150 200 250 300 350 0,00 0,25 0,50 0,75 1,00 1,25 Pote nt ial [V] vs . Na +/Na
Specific charge [mAh/g]
Cycle: / 1st / 2nd / 3rd / 5th / 10th / 20th / 30th / 50th 0 50 100 150 200 250 300 350 0.00 0.25 0.50 0.75 1.00 1.25 Poten tial [V] vs . Na +/Na
Specific charge [mAh/g]
Cycle: / 1st / 2nd / 3rd / 5th / 10th / 20th / 30th / 50th c) d) C/5 C/10 C/5 C/10 0 50 100 150 200 250 300 350 0.00 0.25 0.50 0.75 1.00 1.25 Poten tial [V] vs . Na +/Na
Specific charge [mAh/g]
Cycle: / 1st / 2nd / 3rd / 5th / 10th / 20th / 30th / 50th 0 50 100 150 200 250 300 350 0.00 0.25 0.50 0.75 1.00 1.25 Pote nt ial [V] vs . Na +/Na
Specific charge [mAh/g]
Cycle: / 1st / 2nd / 3rd / 5th / 10th / 20th / 30th / 50th C/5 a) b) C/10 C/10 C/5 0 10 20 30 0.05 0.10 0.15 0.20 0 10 20 30 0.05 0.10 0.15 0.20 0.25 C/5 C/10 C/10 C/5
respectively. This irreversibility can be associated with two important phenomena, i) the formation of SEI layer as a result of the electrolyte decomposition10,23,42 and, ii) irreversible reactions due to Na trapping in the carbon structure. For the former, it involves decomposition reactions of electrolyte at the carbon surface which leads to degradation compounds of electrolyte salt and/or solvent such as: organic/inorganic carbonates (ROCO2Na and Na2CO3),
NaF and Na2O that create a barrier at the electrode surface. For the latter, irreversible
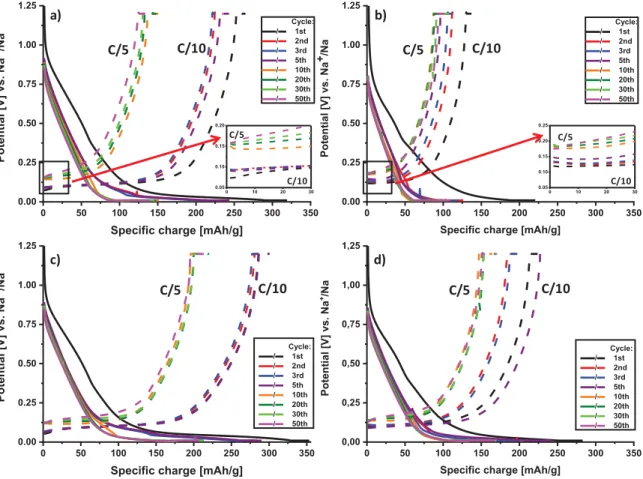
reactions such as Na trapping into the defects and porosity or between the graphene sheets may also occur contributing to the initial irreversibility, as well 29. All these undesired reactions are closely related to the carbon properties (porosity, functional groups and defects) but also to the electrolyte/solvent type and purity and electrochemical cycling conditions. A key feature for all the samples involves the ohmic potential (IR) drop that occurs when switching from the discharging step to the charging step 43. This phenomenon is generally associated with the electrolyte resistive contribution as well as with the SEI formation, which might be thick or not homogeneous. Unfortunately, such a sharp increase in potential lowers the total specific capacity delivered by the materials since an important specific capacity is usually gained at low potential. As expected, the IR drop is more pronounced for the HC-D sample than for the HC-C sample, which agrees with the CE being lower during the first cycle. A potentiostatic step was then further applied to compensate for the kinetics limitation of the materials. Now, if we compare the two samples, we can see that for the HC-C sample, this IR drop is almost stable for a given C rate, whereas for the HC-D sample, some fluctuations depending on the C rate could be observed. This behavior may be related to the SEI formation but also to the CE being lower for the HC-D sample than that for the HC-C sample. This latter phenomenon affects the long-term cycling stability of a material. Regarding the cycling performance (plotted in Figure 7, black triangles), we can see that the specific capacity of the HC-C samples is higher than that of the HC-D sample. As expected, the specific capacity is higher at the C/10 rate than that at C/5. For the first five cycles, a specific capacity of approximately 300 mAh·g-1 was obtained for the HC-C sample and it was
approximately 210 mAh·g-1 for the HC-D sample.
Those values for the HC-C and HC-D samples drop to approximately 210 mAh·g-1 and
160 mAh·g-1 at C/5 rate, respectively, indicating a kinetics mainly controlled by ohmic drops,
coming from the SEI layer and a limited electrical percolation in the electrode. With the exception of the first cycle with a poor CE due to SEI formation, Na trapping into the defects, porosity or the graphene sheets, the HC-C sample has a CE of approximately 99%, whereas it is only 96%-97% for the HC-D sample, indicating more degradation in that case. However,
for both samples, these results need to be mitigated because we applied a CCCV protocol, thus the specific capacity obtained includes the charges coming from the potentiostatic step and the galvanostatic one. For sake of clarity, we calculated (see Supporting Information Figure S4) the specific capacity during the constant potentiostatic step from the difference of the total specific capacity and the galvanostatic cycle capacity.
Figure 7. Long-term cycling stability and CE of pristine hard carbon SSE (black triangles)
and sputter-coated SSE (red squares): (a) HC-C and (b) HC-D.
There is an important contribution during the sodiation step compared to the desodiation step for both samples. This behavior is generally expected as it is always more difficult to insert Na (or Li) than to remove it. At the C/5 rate, the contribution of the potentiostatic step is almost 50% of the total specific charge for the HC-C sample and almost 60% for the HC-D sample. As mentioned, during desodiation, the contribution of the potentiostatic step is minor, only a few percent. Additionally, we can see that the influence of
0 10 20 30 40 50 60 0 50 100 150 200 250 300 350 400 / / Pristine / / Gold Cycle Spec ific cha rge [m Ah/g] C/10 C/10 C/5 C/5 70 80 90 100 Coulo mbi c e fficie ncy [%] 50 100 150 200 250 300 350 400 / / Pristine / / Gold Spec ific cha rge [m Ah/g] C/10 C/10 C/5 C/5 70 80 90 100 Coulo mbi c e fficie ncy [%]
HC-C
HC-D
a)
b)
the potentiostatic step is rate dependent since its contribution is less important at C/10 than it is at C/5. Thus, those results indicate that the system is lacking of electronic conductivity, which allows cycling at a fast rate without a loss in specific charge, especially for the last potential plateau at a very low potential. Indeed, a lack of electronic conductivity generates a strong polarization (i.e., an IR drop), and thus, a potential plateau at a low potential close to the cut-off value or close to Na plating, like in hard carbon materials, was omitted.
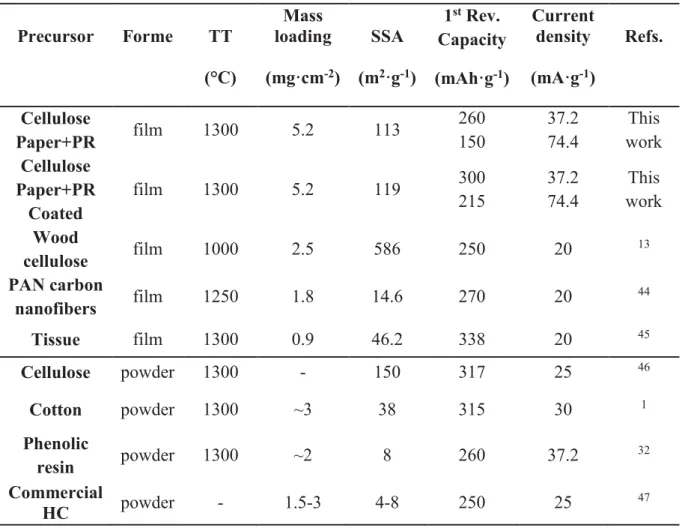
Table 2. Characteristics and performance of cellulose/cotton derived hard carbons and/or
self-sustained electrodes for NIBs reported in the literature and comparison with the obtained SSEs in this work.
Precursor Forme TT (°C) Mass loading (mg·cm-2) SSA (m2·g-1) 1st Rev. Capacity (mAh·g-1) Current density (mA·g-1) Refs. Cellulose Paper+PR film 1300 5.2 113 260 150 37.2 74.4 This work Cellulose Paper+PR Coated film 1300 5.2 119 300 215 37.2 74.4 This work Wood cellulose film 1000 2.5 586 250 20 13 PAN carbon nanofibers film 1250 1.8 14.6 270 20 44 Tissue film 1300 0.9 46.2 338 20 45 Cellulose powder 1300 - 150 317 25 46 Cotton powder 1300 ~3 38 315 30 1 Phenolic resin powder 1300 ~2 8 260 37.2 32 Commercial HC powder - 1.5-3 4-8 250 25 47
To assess the role of the electrical percolation in the electrode, a thin layer of gold was sputter coated on one side of the electrode, and then the electrochemical performance was investigated again. Sputtering with gold metal was preferred in our study due to its excellent corrosion resistance (1.5 V Au vs. standard hydrogen electrode (SHE)).
As we can see in Figure 6c and d, the gold SSEs deliver a higher specific capacity than the pristine ones. The specific capacity jumps from approximately 150 mAh·g-1 to 220 mAh·g-1 at the C/5 rate for HC-C and from approximately 100 mAh·g-1 to 160 mAh·g-1
for HC-D. Even at the C/10 rate, the specific capacity of the HC-C sample is approximately 300 mAh·g-1. Both samples deliver better performance as compared to SSEs or cellulose/cotton-derived hard carbons for NIBs reported in other papers (Table 2), particularly considering the more realistic testing conditions.
For instance, J. Jin et al.44 reported a reversible capacity of 275 mAh·g-1 while using a current density of 20 mA·g-1 and a mass loading of 1.8 mg·cm-2, values which are almost two times lower than in our case. Hou et al.45 published indeed very good performance (i.e. ~335 mAh ·g-1 reversible capacity at 20 mA·g-1) but the mass loading used is extremely low, 0.9 mg·cm-2. In another study performed on cellulose self-standing electrodes, Shen et al.13, reported a reversible capacity of ~250 mAh·g-1 however, while cycling the material at lower current, 20 mA·g-1. It can be also noted that the materials prepared in this work exhibit higher capacity than that of commercial HC and phenolic resin-derived hard carbon (see Table 2). The higher mass loading used, ~ 5 mg·cm-2 (this work) vs. < 2 mg·cm-2 (most of the articles), is a relevant advantage for practical applications, resulting in an increased areal capacity (mAh·cm-2). Finally, the CE is improved in both cases, showing an increased reversibility for the processes. The present performance maybe further improved by performing more systematic studies on the impact of annealing temperature, heating rate and time which may allow more favorable structure and texture of these materials, particulary lower porosity, lower amount of functional groups and a better electronic conductivity.
A detailed look at the potentiostatic step (Supporting Information, Figure S5), shows again a more important capacity contribution during the sodiation step than during the desodiation. As expected, the capacity measured during the potentiostatic step decreases owing to the benefit of the current collector and the better electronic percolation. For the HC-C samples, the capacity recorded during the potentiostatic step gives 30% of the total specific capacity at C/5, whereas it is approximately 50% for the SSEs without a current collector. For the HC-D sample, the trend is the same; the potentiostatic step contributes 45-50%, whereas it is more than 60% without a current collector.
Just by comparing the galvanostatic profiles presented in Figure 6, one can easily see the improvement in the reversible capacity, especially for the low-potential plateau for both materials. This supports the existence of a limited electrical percolation inside the SSEs due to the absence of current collectors as well as due to the lack of conductive carbon (carbon
black). Such limitations can be overcome by heat treating the SSEs at higher annealing temperatures than the SSEs used in this work (1300°C); however, a compromise should be made afterwards to ensure a good balance between the structure, porosity and defects to maintain good electrochemical performance.
Two main hypotheses are usually proposed to explain the storage mechanism of sodium ions in hard carbons, i.e., intercalation between the locally pseudo-ordered graphene layers and adsorption into the pores. Although debates still exist in the literature for the attribution of both phenomena, recent works are more likely to associate the slope and potential plateau regions with the Na “adsorption-intercalation” mechanisms, respectively 25–
31. Additionally, the presence of surface functional groups, heteroatoms or structural defects
(graphene sheet edge) also affects the storage mechanism, particularly in the sloping region
28,29,31.
Considering all of these points, we attempted to better understand the sodium insertion mechanism. The characteristics of the HC-C and HC-D samples in terms of structure and microporosity are very similar, while their morphology, surface functional groups and structural defects content are different; those features could be used to discriminate the two samples. When considering the recently proposed reaction mechanisms, the higher ASA value and oxygen surface functional groups along with the larger number of ultramicropores found in HC-C than those for HC-D should lead to greater specific capacity in the sloping region (by Na adsorption mechanism), which is the case, as shown in Figure 6a and b. Similar results were obtained in our previous works, where we found that while the number of functional groups (COx), ASA (carbon edge defects) and the micro-/ultramicro-porosity decrease, the
sloping region decreases as well. Furthermore, the potential plateau (via Na intercalation mechanism) should berather similar for the two materials when considering the measured d-spacing values found to be very closed between the two samples (4.0 and 4.1 Å for HC-C and HC-D, respectively). However, while HC-C material exhibits a significant potential plateau, which is in good agreement with the large interlayer distance (4.0 Å); HC-D develops a very poor specific capacity despite the larger d-spacing (4.1 Å). As the potential plateau capacity is suspiciously low despite all the characteristics observed, it could be the electrode mass and thickness that play a role. The thickness of the HC-C electrode is lower (66 µm) than that of HC-D electrode (87 µm), which translates as well into a smaller electrode mass (4.5 mg vs. 5.9 mg, respectively). Both, the higher thickness and mass of HC-D may cause an increase in the resistance (i.e., a decrease in the conductivity) and increased pathway lengths for sodium diffusion 48,49. A decreased electronic conductivity (in the absence of a current
collector/conductive carbon) could also explain the limited specific capacity delivered at low potential along with the curve shape resembling that of Na plating. As a result, to find more insights into the storage mechanisms, operando XRD measurements were performed (Figure 8) by recording a diffractogram every 1 h while the cell was cycled (in CCCV protocol) at the C/25 rate.
The contour plot of Figure 8a shows the evolution of the 2θ angle versus time in the 16°-34° 2θ range, where the purple color corresponds to the lowest intensity, while the dark red color corresponds to the highest intensity. No noticeable shift can be observed for the (002) peak during the discharging-charging step, even if we can see a decrease of its full width half maximum (FWHM), especially at the end of the discharge associated with a decrease in the peak intensity. This observation is in agreement with other works 22,27,28 which associate this behavior with a disordering transition in the carbon microstructure due to Na ion intercalation. Additionally, we can observe the appearance of a shoulder at 28.0° when the material reaches a potential below 0.07 V. As the potential decreases, the intensity of the new peak increases and then decreases once the charging step starts. It is worth mentioning that such a peak was not observed in reported previous works using in situ and ex situ XRD techniques to determine the sodium insertion reaction mechanism 19,22,23,26,30,31,50. The newly formed peak cannot be related to sodium adsorption into defects and/or porosity since there are no reports that such modifications can be detected by XRD. Rather, it resembles an intermediate sodiation stage, similar to Li-graphite intercalation compounds (GICs) that occur in lithium-ion batteries. It is known that stage I to IV Na-GICs are not stable 51 and have never been observed, but higher stage compounds, such as NaC64 (stage VIII), have been proposed 52. Moreover, a very recent study published by Wang et al. 53, propose the formation of NaC
20
compound. Based on both in-situ and ex-situ TEM technique coupled with SAED and EDX analyses, the authors observed a volume expansion of the carbon particles upon Na-insertion in the potential plateau region which was attributed to the above mentioned Na intercalated compound. Moreover, in the slope region, the formation of Na and Na2O nanocrystals was
observed and attributed to the the absorption of sodium in the porosity and the interaction with the defects.
Figure 8. (a) Contour plot representing the operando XRD experiment recorded during the 1st
discharge-charge cycle of HC-D SSE at C/25 rate along with the corresponding charge/discharge profile. (b) 2D plot of normalized diffractogram obtained from the operando XRD measurement in the first cycle along with its (c) three-dimensional (3D) plot that was not normalized.
To further highlight this process, we plotted the compilation of the diffractograms in Figure 8b, where a shoulder is clearly visible. Furthermore, it is clear that once the sodiation starts, the intensity of the (002) peak decreases progressively (Figure 8c) until full sodiation, indicating a decrease in the material structural ordering and a possible adsorption. When the current is reversed and desodiation starts, the peak intensity increases again, as suggested by the dark red traces. The process is not completely reversible since Na+ trapping and/or
irreversible intercalation occurs. Surprisingly, a small peak appears at 2θ = 28.8° (marked with * in Figure 8b), which could correspond to Na metal. However, at such a high voltage
a)
15 20 25 30 35 40 45 50 0.00 0.25 0.50 0.75 1.00 Normali ze d In tens ity 2 θ (°) (002)*
b)
c)
(0.4 V), Na plating cannot thermodynamically occur, as reported is several papers 28,54,55,
deposition being possible only bellow 0V. Therefore, it is unlikely that this peak corresponds to Na metal plating and might be due to the cell design.
These experiments then suggest that Na storage into hard carbon materials is based on both the intercalation of sodium in pseudographitic domains and on the adsorption of sodium in the micro/ultramicropores and defects. Considering that no shift was noticed for the (002) plane and that the appearance of the new diffraction peak occurs at low voltage (< 0.1 V), our conclusion goes in the direction that the potential plateau region is dominated by the intercalation of Na between the graphene layers. Based on these results, the carbon porosity filling with Na in the plateau region cannot be proven but either completely excluded, however, it appears to have a significantly lower contribution.
Regarding the sploping region, the decrease/increase of (002) peak intensity during Na-insertion/extraction can be a sign of carbon microstructure modification which become more disordered. The reason behind such observation it not fully understood yet and can be triggered by the interaction of Na on the defective graphene layers and/or adsorption into the open porosity.
Therefore, our results bring new experimental evidence which strengthen recently reported results 20,27,29 that propose an “adsorption-insertion” mechanism where Na+ first adsorbs on the HC surface via defects along with micro/ultramicroporosity filling, while in the plateau region, Na+ intercalates between the graphene layers with the formation of intercalated compounds. Nevertheless, there is still a great need for supplementary experimental and theoretical works in order to elucidate the exact nature of the compounds behind the newly formed XRD peak and to provide further insights for such complex storage mechanisms.
Conclusions
In summary, self-supported, binder and current collector-free hard carbon electrodes were prepared from cellulose and cotton FPs. An innovative approach based on the impregnation of the FPs with phenolic resin was developed to increase the mechanical and thermal stability of the material. As a result, the carbon yield increased from 10 to approximately 30 wt.%, as shown by the TGA results. A systematic study with XPS, contact angle, XRD, Raman spectroscopy, and SEM measurements was performed on several materials that enabled the selection of two promising materials from different precursors to study their electrochemical behavior in SIBs. The selected SSEs possessed similar structural and textural properties, while the surface chemistry, number of defects and morphology mainly differentiated the two materials. Galvanostatic/potentiostatic discharge-charge curves revealed that the cellulose-based SSE delivered a higher performance than the cotton-based SSE, i.e., a reversible specific capacity of 240 mAh·g-1 vs. 140 mAh·g-1 and 82% vs. 65% CE at the C/10 rate, for high loaded electrodes. To compensate for the lack of electronic conductivity due to the absence of a current collector, the SSEs were sputter coated with conductive gold before electrochemical evaluation, and the results led to an important improvement with a high reversible capacity of 300 mAh·g-1 and high CE of 85% that increased to 100% with the second cycle. The storage mechanism was studied by operando XRD, and the results revealed the formation of a new peak likely related to some Na intercalated species. However, their nature still needs to be elucidated by further studies. Additionally, our findings suggest a mechanism that implies sodium intercalation into the graphitic domains in the low voltage plateau as the main process and Na+ adsorption on hard
carbon defects and pores in the sloping region.
Conflicts of interest
There are no conflicts of interest to declare.
Acknowledgements
This work was performed in the frame of RS2E (French research network on electrochemical energy storage) and the laboratory of excellency for electrochemical energy storage, STORE-EX. The authors thank DGA (Direction Générale de l'Armement, N° 2016 60 0050) and Region Alsace (N° 618342) for the financial support of this work. We also thank Dr. Stephan Knopf (SEM images, EDX analysis), Dr. Samar Garreau (XPS analysis), Ms. Bénédicte Réty (TPD-MS) for technical support via IS2M technical platforms and Dr. Cyril Marino (Paul
Scherrer Institut) for technical support (Operando XRD, cell assembly training) and interesting discussions about electrochemistry.
References
1 Y. Li, Y.-S. Hu, M.-M. Titirici, L. Chen and X. Huang, Advanced Energy Materials, 2016,
6, 1600659.
2 J. Deng, W.-B. Luo, S.-L. Chou, H.-K. Liu and S.-X. Dou, Advanced Energy Materials, 2018, 8, 1701428.
3 S. Guo, J. Yi, Y. Sun and H. Zhou, Energy Environ. Sci., 2016, 9, 2978–3006. 4 J. Górka, C. Vix-Guterl and C. Matei Ghimbeu, C, 2016, 2, 24.
5 Z. Li, J. Ding and D. Mitlin, Acc. Chem. Res., 2015, 48, 1657–1665.
6 V.-A. Oltean, S. Renault, M. Valvo and D. Brandell, Materials, 2016, 9, 142. 7 J.-Y. Hwang, S.-T. Myung and Y.-K. Sun, Chem. Soc. Rev., 2017, 46, 3529–3614. 8 C. Bommier, D. Mitlin and X. Ji, Progress in Materials Science, 2018, 97, 170–203. 9 J. R. Dahn, W. Xing and Y. Gao, Carbon, 1997, 35, 825–830.
10 C. Bommier and X. Ji, Small, 2018, 14, 1703576.
11 K. Cao, L. Jiao, Y. Liu, H. Liu, Y. Wang and H. Yuan, Advanced Functional Materials, 2015, 25, 1082–1089.
12 H.-G. Wang, W. Li, D.-P. Liu, X.-L. Feng, J. Wang, X.-Y. Yang, X. Zhang, Y. Zhu and Y. Zhang, Advanced Materials, 2017, 29, 1703012.
13 F. Shen, H. Zhu, W. Luo, J. Wan, L. Zhou, J. Dai, B. Zhao, X. Han, K. Fu and L. Hu, ACS Appl. Mater. Interfaces, 2015, 7, 23291–23296.
14 M. Liao, Q. Zhang, F. Tang, Z. Xu, X. Zhou, Y. Li, Y. Zhang, C. Yang, Q. Ru and L. Zhao, Nanomaterials (Basel), 2108, 8(4), 183.
15 S. Nam, B. D. Condon, Y. Liu and Q. He, Polymer Degradation and Stability, 2017, 138, 133–141.
16 A. Ali, F. Xie, L. Yu, H. Liu, L. Meng, S. Khalid and L. Chen, Composites Part B: Engineering, 2018, 133, 122–128.
17 M. Dogan, J Therm Anal Calorim, 2014, 118, 93–98. 18 S. M. Yasar and B. İçel, 2016.
19 H. Hou, X. Qiu, W. Wei, Y. Zhang and X. Ji, Advanced Energy Materials, 2017, 7, 1602898.
20 D. Saurel, B. Orayech, B. Xiao, D. Carriazo, X. Li and T. Rojo, Advanced Energy Materials, 2018, 8, 1703268.
21 X. Dou, I. Hasa, D. Saurel, C. Vaalma, L. Wu, D. Buchholz, D. Bresser, S. Komaba and S. Passerini, Materials Today, 2019, 23, 87–104.
22 D. A. Stevens and J. R. Dahn, J. Electrochem. Soc., 2001, 148, A803–A811.
23 S. Komaba, W. Murata, T. Ishikawa, N. Yabuuchi, T. Ozeki, T. Nakayama, A. Ogata, K. Gotoh and K. Fujiwara, Advanced Functional Materials, 2011, 21, 3859–3867.
24 D. A. Stevens and J. R. Dahn, J. Electrochem. Soc., 2000, 147, 1271–1273.
25 Y. Cao, L. Xiao, M. L. Sushko, W. Wang, B. Schwenzer, J. Xiao, Z. Nie, L. V. Saraf, Z. Yang and J. Liu, Nano Lett., 2012, 12, 3783–3787.
26 E. M. Lotfabad, J. Ding, K. Cui, A. Kohandehghan, W. P. Kalisvaart, M. Hazelton and D. Mitlin, ACS Nano, 2014, 8, 7115–7129.
27 S. Qiu, L. Xiao, M. L. Sushko, K. S. Han, Y. Shao, M. Yan, X. Liang, L. Mai, J. Feng, Y. Cao, X. Ai, H. Yang and J. Liu, Advanced Energy Materials, 2017, 7, 1700403.